Charts
Which Police Departments Have the Highest Rates of Police Homicides?

Police brutality cases are a serious topic in the United States right now. Multiple instances of deadly use of force in recent times has reopened the debate about racism and police brutality. Police killing statistics for black people are particularly dire. Since 2013, black people make up 28% of victims killed by police, despite being only 15% of the U.S. population.
This visualization from YourLawyer.com highlights which of the 100 largest police departments in the country have the highest rates of police homicides.
Click below to zoom
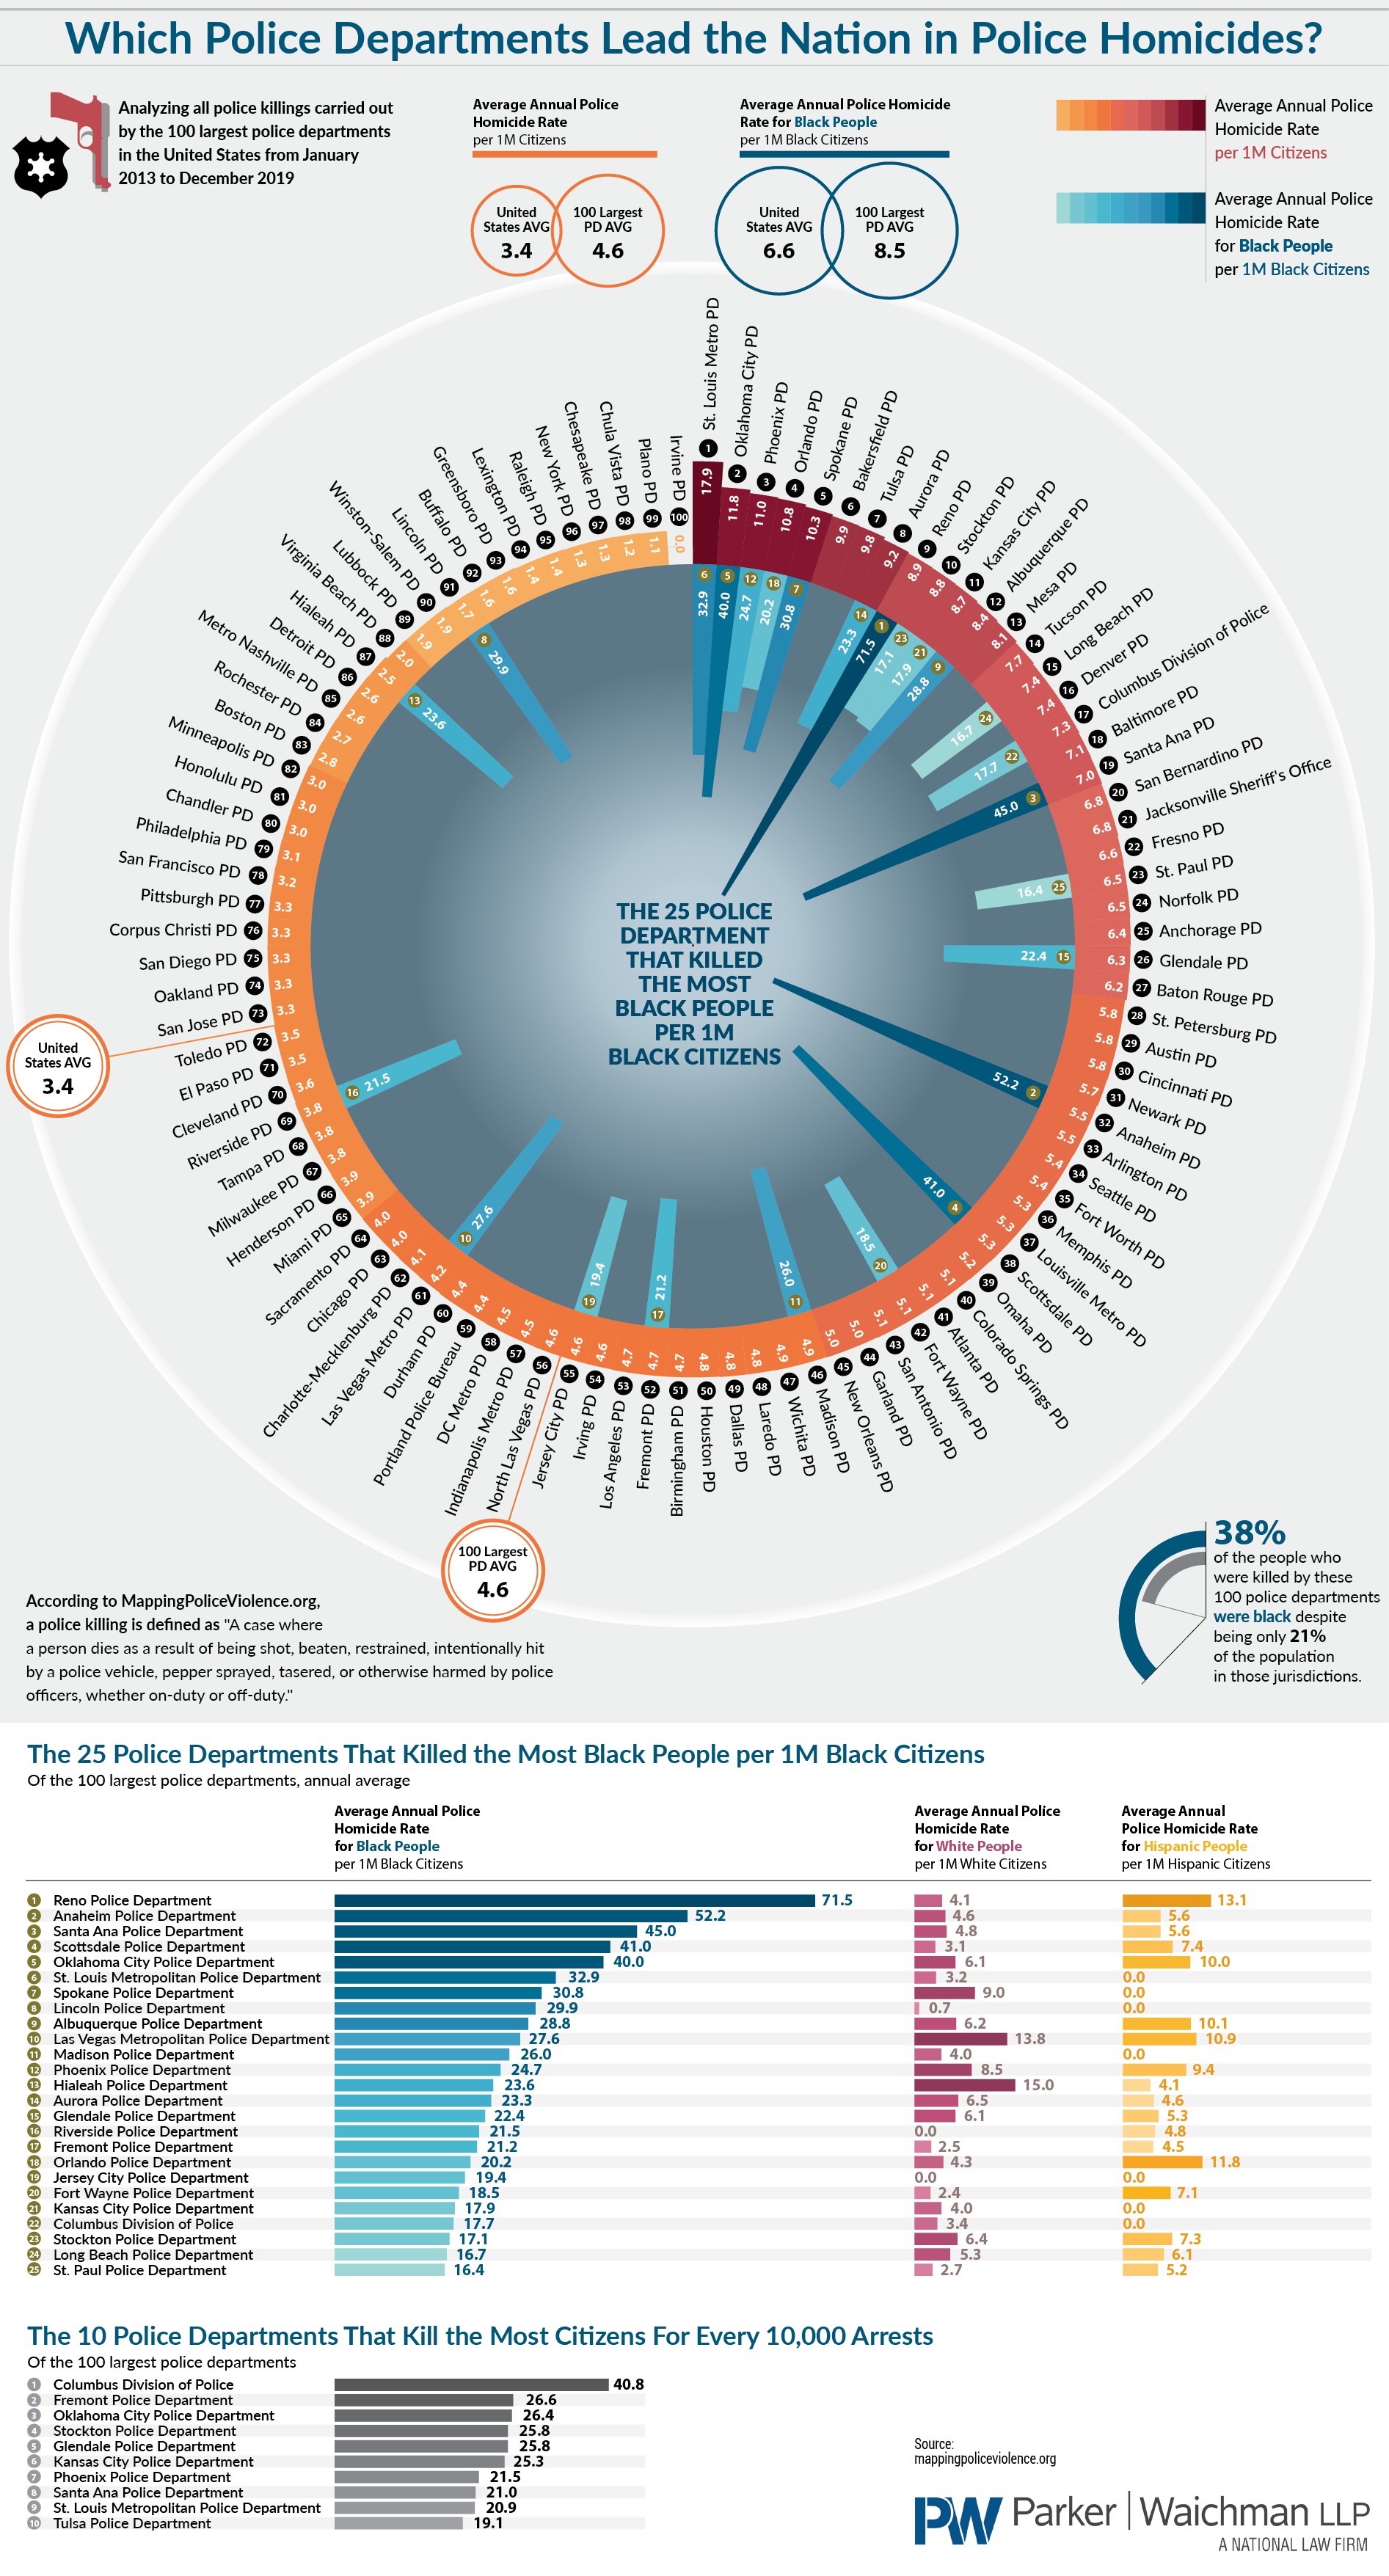
The main visualization is a unique radial histogram. A radial histogram, also known as a circular histogram, is a variation of the traditional linear bar chart that displays data around a circle. This allows more data to be displayed than a linear bar chart. The outer bars represent the average annual police homicide rate per 1 million citizens, and the inner bars indicate the 25 police departments with the highest average annual police homicide rate for black people per 1 million black citizens. Beneath the radial histogram are a series of vertical bar charts outlining more details on police homicides by race.
According to the charts, the St. Louis Metropolitan Police Department has the highest average annual police homicide rate with 17.9 per 1 million citizens. They are also the police department with the sixth highest average annual police homicide rate for black people, with 32.9 per 1 million black citizens. The Reno Police Department holds the top spot for highest average annual police homicide rate for black people in the country at 71.5 per 1 million black citizens.
Did any of these police brutality statistics surprise you?