Charts
America’s Birthday Patterns Reveal Demographics in New Chart
Have you ever noticed that certain months seem to have daily birthdays in your social circle? Kremp Florist’s new study shows birth patterns that reveal remarkable consistency in when people are born and interesting age variations across the states. Through analysis of data from 29.8 million births recorded from the CDC WONDER Natality database and nearly 16 million census survey responses, the data unveils hidden demographic patterns that shape everything from our family planning to regional economics.
Click here to zoom.
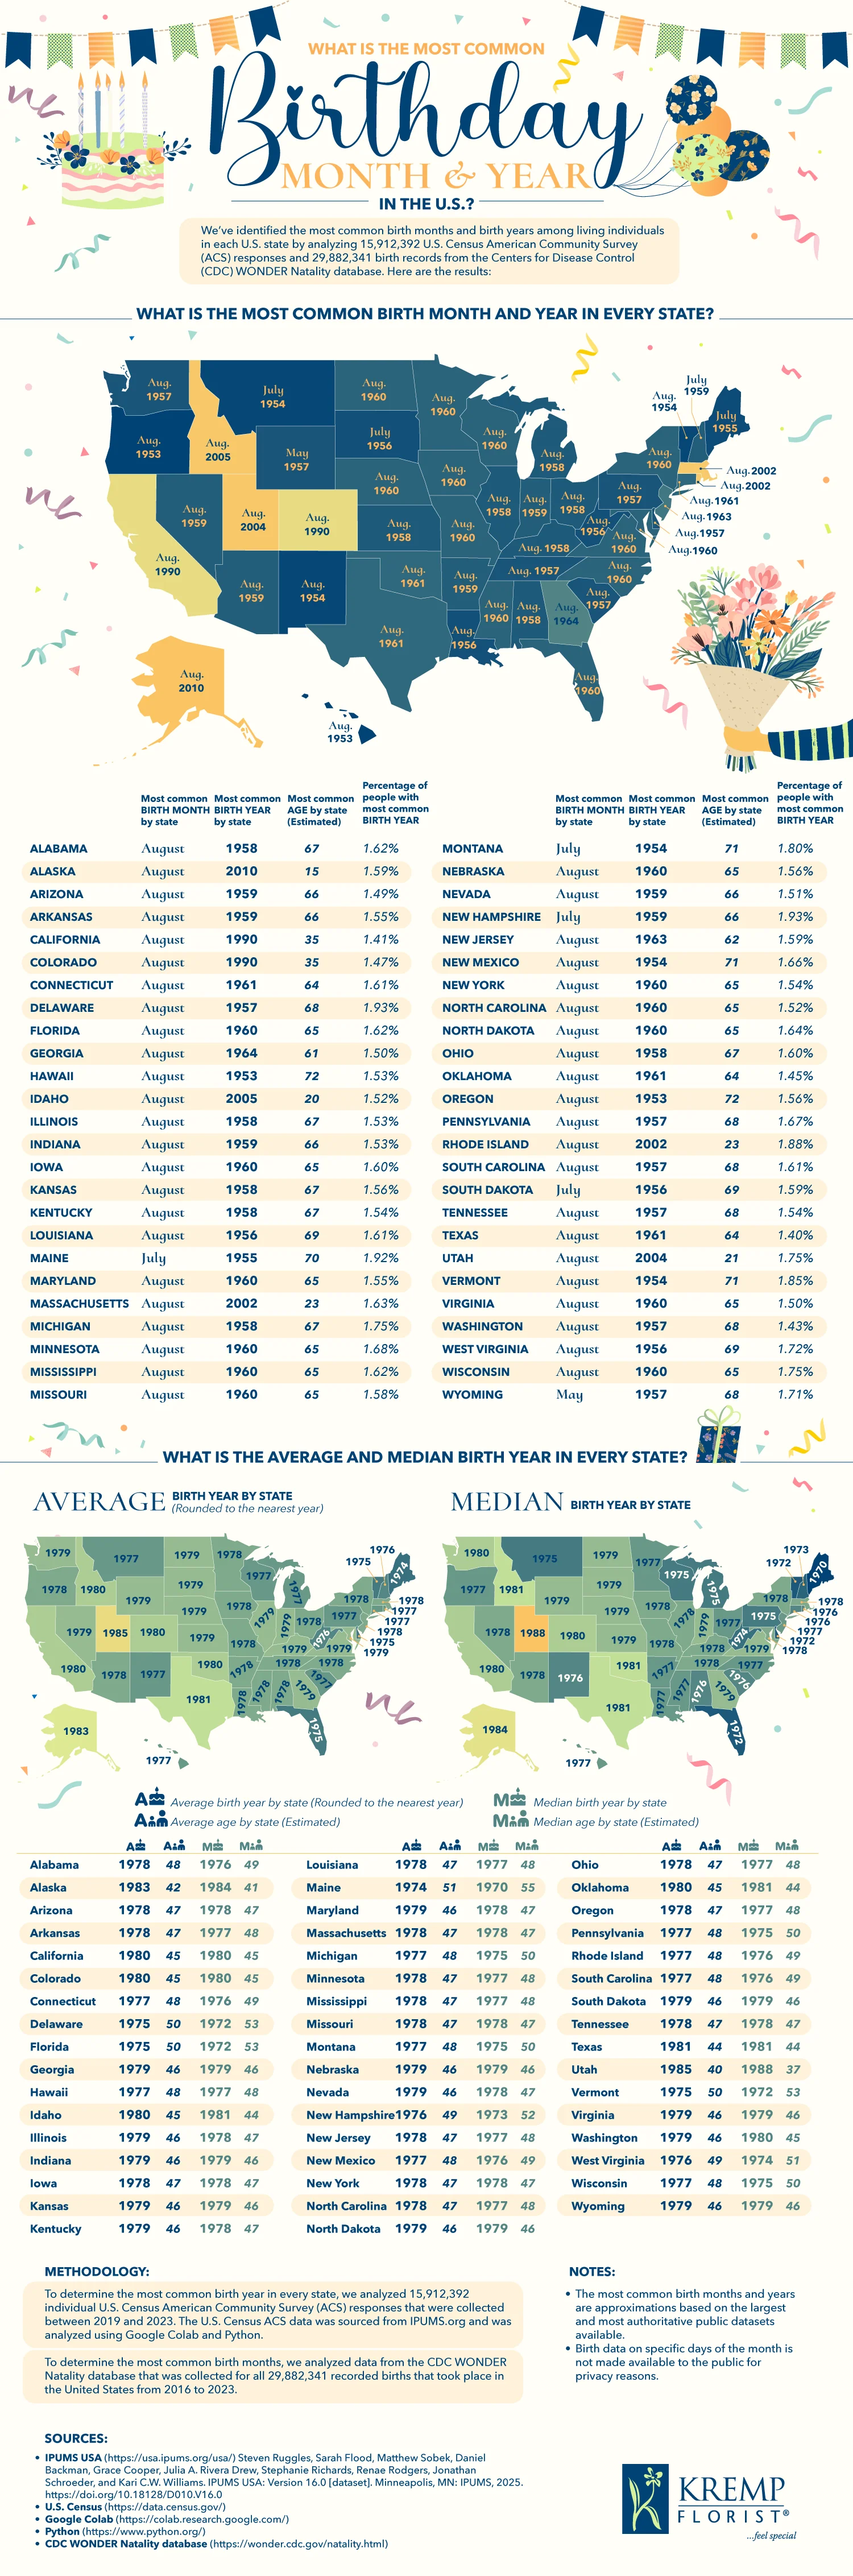
The standout finding is in the most popular birth month. August is by far the most common birth month in 45 out of 50 states. This consistency reflects a few factors that we can tie to conception periods. Late fall to early winter is an ideal time to start a pregnancy. Counting nine months back from August indicates a conception period in November to December. Chill outdoor temperatures encourage more intimate indoor time, and festive dates like Thanksgiving, Christmas, and New Year’s provide opportunities for relaxation and celebration. The positive mood can foster romantic connections.
Science also supports this pattern, suggesting that sperm quality peaks during the winter months and declines in the summer heat since sperm prefer a cooler environment, and high temperatures reduce the quantity and mobility of sperm. Female fertility is affected by the seasons, too. Shorter fall and winter days boost melatonin production, which supports the circadian rhythms that stabilize fertility hormones like prolactin.
The data also goes so far as to reveal the most common single birthday in America. While August dominates the monthly birthday rate, the most common individual birthday is September 9th. There have been about 12,301 birthdays celebrated annually on that day for the past 20 years. This specific birthday is a shared experience for many people, including celebrities like Adam Sandler, Otis Redding, Michael Bublé, Hugh Grant, Leo Tolstoy, and Colonel Sanders.
The team’s analysis also shows us state-by-state age demographics that reflect economic opportunities, migration patterns, and other cultural factors. Maine is the oldest state in America, with a median age of 55. Populations there are living longer, and birth rates are on the decline. Utah has the youngest population, with an average age of 37. The youthful makeup of Utah stems from the state’s high birth rates and youthful urban population.
We generally see older populations in northeastern states like Vermont, New Hampshire, and Delaware. Western and mountain states skew younger, like in Idaho, Texas, and Colorado. These demographics are influenced by economic development, healthcare demands, educational opportunities, and other factors that influence migration to and from the state and longevity.
Kremp’s graphic shows some fascinating regional patterns and consistency trends in ages and birth timing. All these factors help shape America’s diverse landscape and unique regional identities.