Business Visualizations
Map Reveals How Much People Work in Each State
Americans are known for being industrious and hard-working, but are all states created equal in the hours they devote to work? A new map from Qualtrics can give us the answer. The team calculated the percentage of time Americans spent working last year, then color-coded each state based on where it fell on the spectrum. The colorful map shows us that all states fell somewhere within the range of 16% and 27% of last year spent on labor. States on the high end of the spectrum have a green hue, and states on the low end have a pink hue, with average time in the center of the scale represented in shades of blue. The result is an easy-to-read chart showing which state residents worked the most and the least.
Click below to zoom.
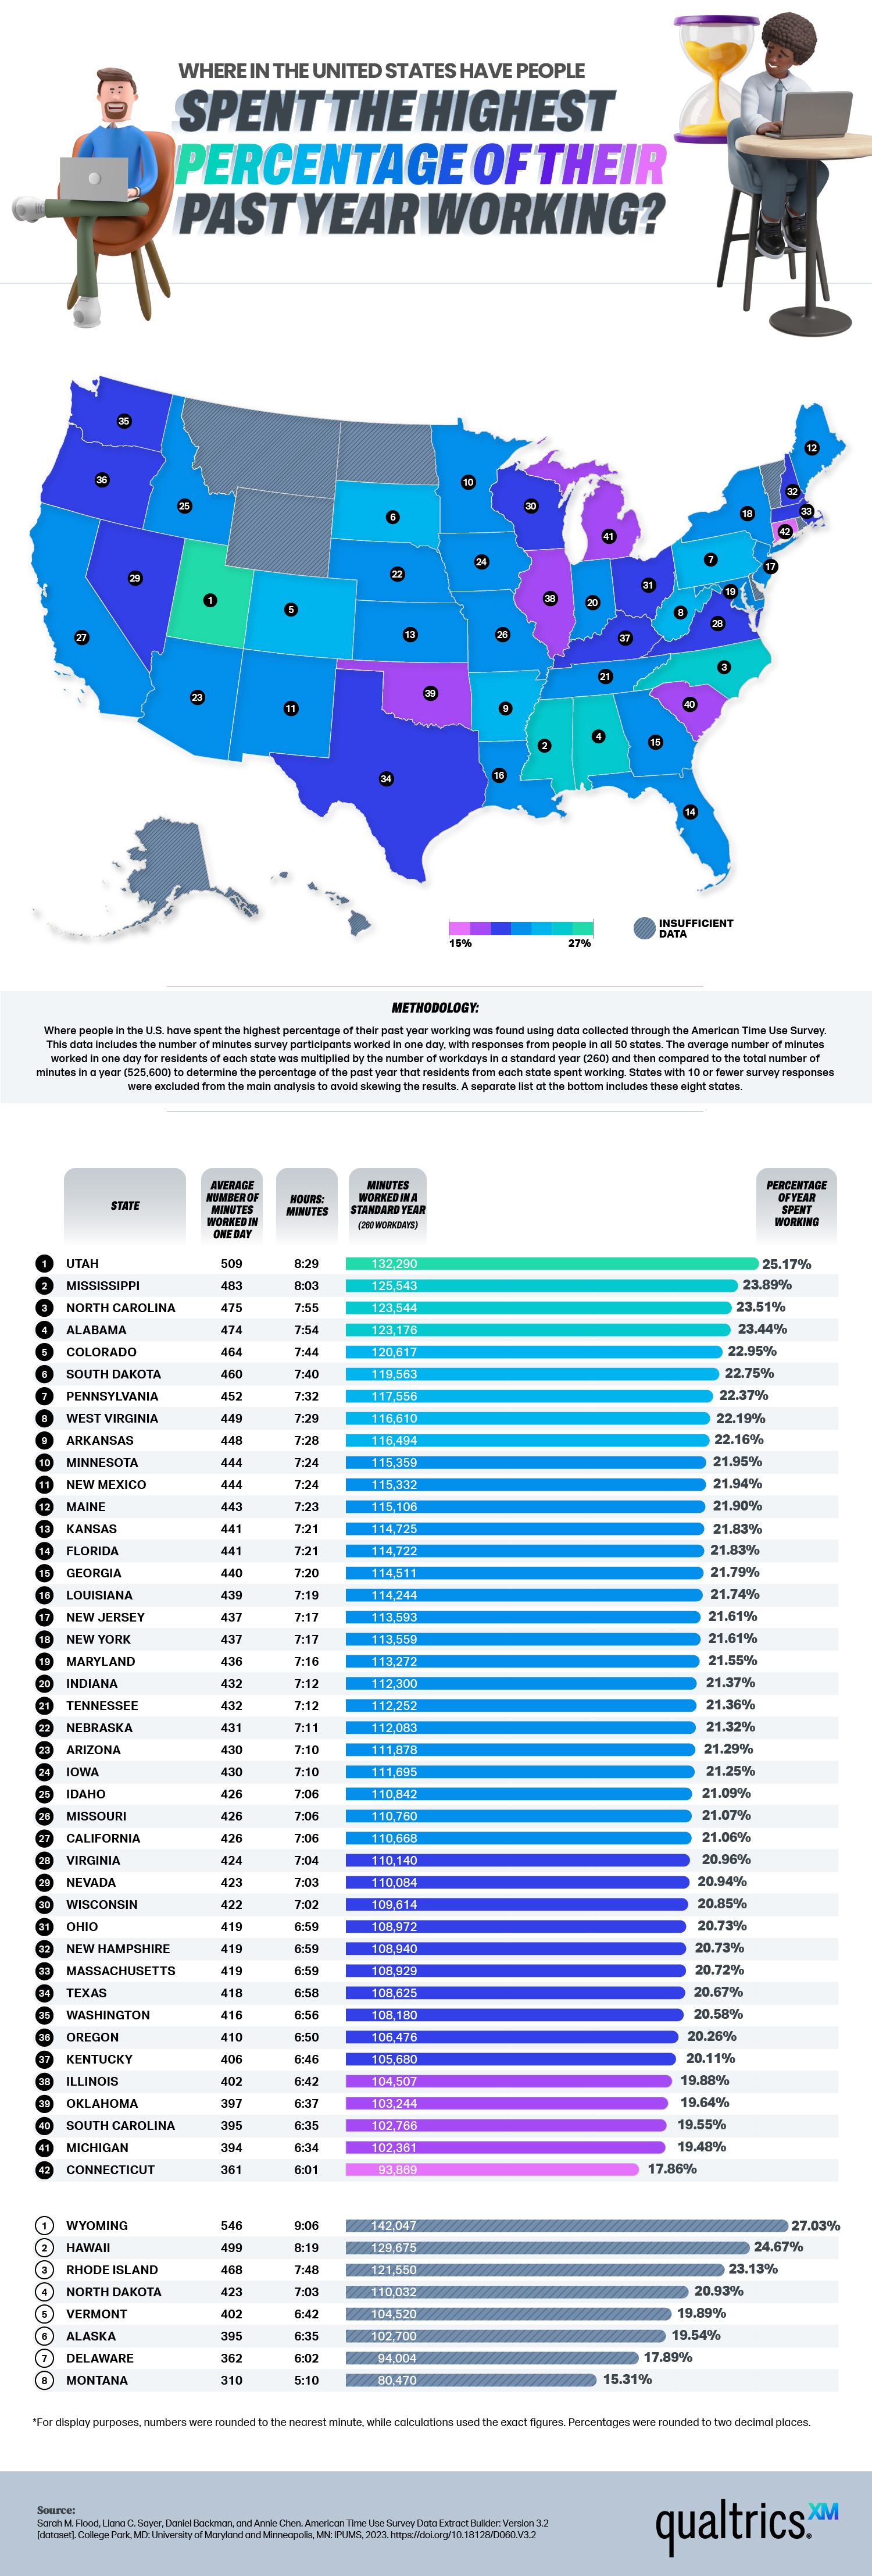
While the range the map represents isn’t huge, workers certainly notice a difference between 16% and 27% of the year spent on the job. What can cause such a big discrepancy? The map helps us get some insights into work culture throughout the nation. For example, residents of Utah spent the most time at work out of all 50 states, and they also have some of the lowest unemployment levels in America. This suggests that plentiful work means lots of time spent laboring, or maybe it implies that Utah residents genuinely enjoy working.
We can also see the effects of low wages on hours spent at work. In states where wages are lowest, like Mississippi, Alabama, South Dakota, and West Virginia, residents worked longer hours, most likely to earn what they need to get by. We can also see this in states with high living costs, like Colorado. It’s an expensive state to live in, and workers there spent more time on the job. We can speculate that the need for more wages pushes employees to work more.
Industry can also play a part in work hours. We already know that Alabama and Mississippi workers are spending a lot of time in the workplace, but we also have to consider that there are a lot of manufacturing jobs in these states. These jobs often come with a high demand for long shifts that exceed 40 hours a week. On the other end of the spectrum, we can see that high availability of part-time work can lead to lower work hours. Connecticut residents worked the least amount of time last year, which is clearly because 29% of the workforce has a part-time job. Other states with the lowest work hours include Michigan, South Carolina, Oklahoma, Illinois, Kentucky, Oregon, Washington, and Texas.
This map is a fascinating insight into American work culture and how it varies across the nation. The best maps and studies give us statistics that can provide us with a bigger picture of an issue like labor, and this map certainly delivers.