Charts
New Map Shows Where Americans Spend the Most Time at Home
A new article from RoveLab presents a data-driven exploration of home-life habits in the United States, examining how much time Americans spend at home and how that changes across each state. Drawing on data from the American Time Use Survey and the Integrated Public Use Microdata Series, the study constructs a ranking of states based on how much time residents spend at home. This data combined at-home activity levels with remote work prevalence.
RoveLab situates its analysis within broader behavioral shifts in the American lifestyle. On average, Americans spend around 18 hours per day at home (including sleep), which reflects a gradual decline in time spent outside the home over the past two decades. This trend pre-dates the COVID-19 pandemic, which spiked time spent at home and prompted the rise of remote work.
Click below to zoom.
Other important facts on time spent at home add more context:
- 80% of Americans engage in daily household activities like cleaning, cooking, and home maintenance.
- 94% of Americans participate in leisure activities at home, including gaming, socializing, and exercise.
- Most Americans watch about 3.57 hours of television daily, which is more than the average amount of daily time spent on household tasks.
These statistics show that a home is the central site of both productivity and leisure, underscoring the growing connection between work and private life.
To determine which state residents are the most homelife-centric, the researchers developed a scoring system that incorporated:
- Average percentage of the day spent at home
- Average daily minutes spent at home
- Percentage of residents working remotely
- Weighted ranking emphasizing time-use data slightly more than remote work numbers
This multi-factor approach shows the team’s effort to balance behavioral statistics with labor trends, offering a comprehensive view of domestic time use.
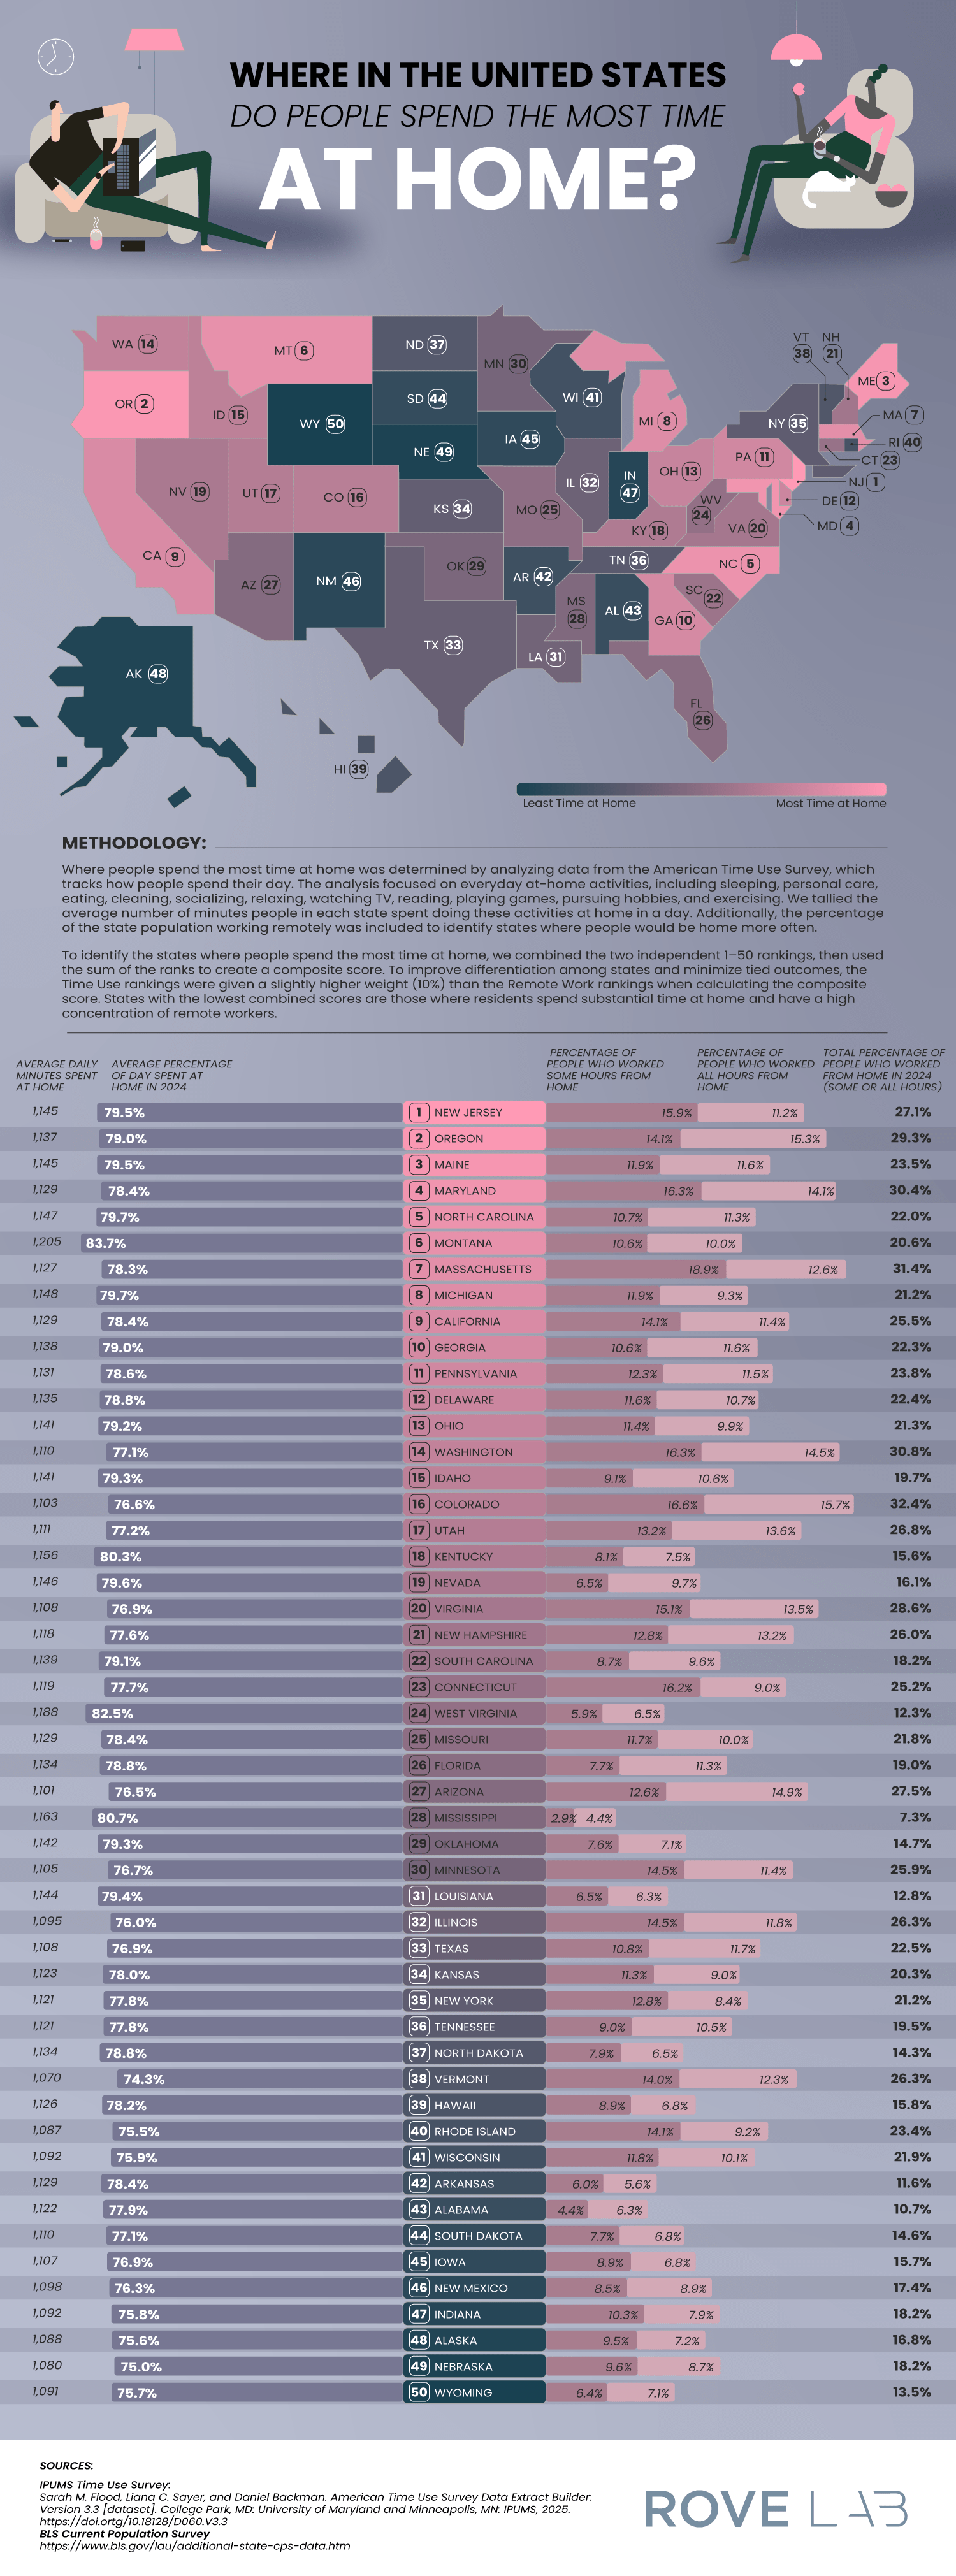
The team found that residents in these states spend the most time at home:
- New Jersey: 5% of the day is spent at home (1,1495 minutes) and 27.1% of residents work remotely.
- Oregon: 79% of the day is spent at home and 29.3% of residents work remotely.
- Maine: 79% of the day is spent at home and 23.5% of residents work remotely.
New Jersey’s lead position is due to several structural factors, such as its proximity to major employment centers and a highly educated workforce, with over 40% of residents holding a bachelor’s degree. These factors create a population ideal for telecommuting. It shows us that socioeconomic factors can shape our daily routines.
At the low end of the scoring, Wyoming ranks as the state where people spend the least amount of time at home. This reflects a low rate of remote work. Montana relies on industries like agriculture, mining, and tourism, which all require in-person workers. The team also speculates that Wyoming’s emphasis on outdoor recreation leads residents to both work and play outside their homes.
By combining time-use data with employment patterns, the study provides valuable insight into how regional differences, evolving job requirements, and leisure habits shape modern American life.