Interactive Visualizations
These Interactive Maps Reveal How the Vaccination Campaign is Going in Each State
COVID has taken the last year and a half of our lives hostage. There isn’t a day that goes by where you don’t hear someone say, “COVID-19” or, “pandemic”. Today, most TV or radio news has shifted to focus on the COVID-19 vaccine.
Scientists agree that the only way out of this pandemic is to vaccinate a high percentage of the population to achieve herd immunity. The exact numbers required for herd immunity varies depending on who you ask but it believed to be in the percentage rage of 75% to 85%. Vaccines began distribution in the United States in early December and since then, over 266 million vaccine doses have been administered in the general population. These interactive visualizations from NPR.org is updated regularly to show how the vaccine rollout is moving throughout the US.
Click below to zoom

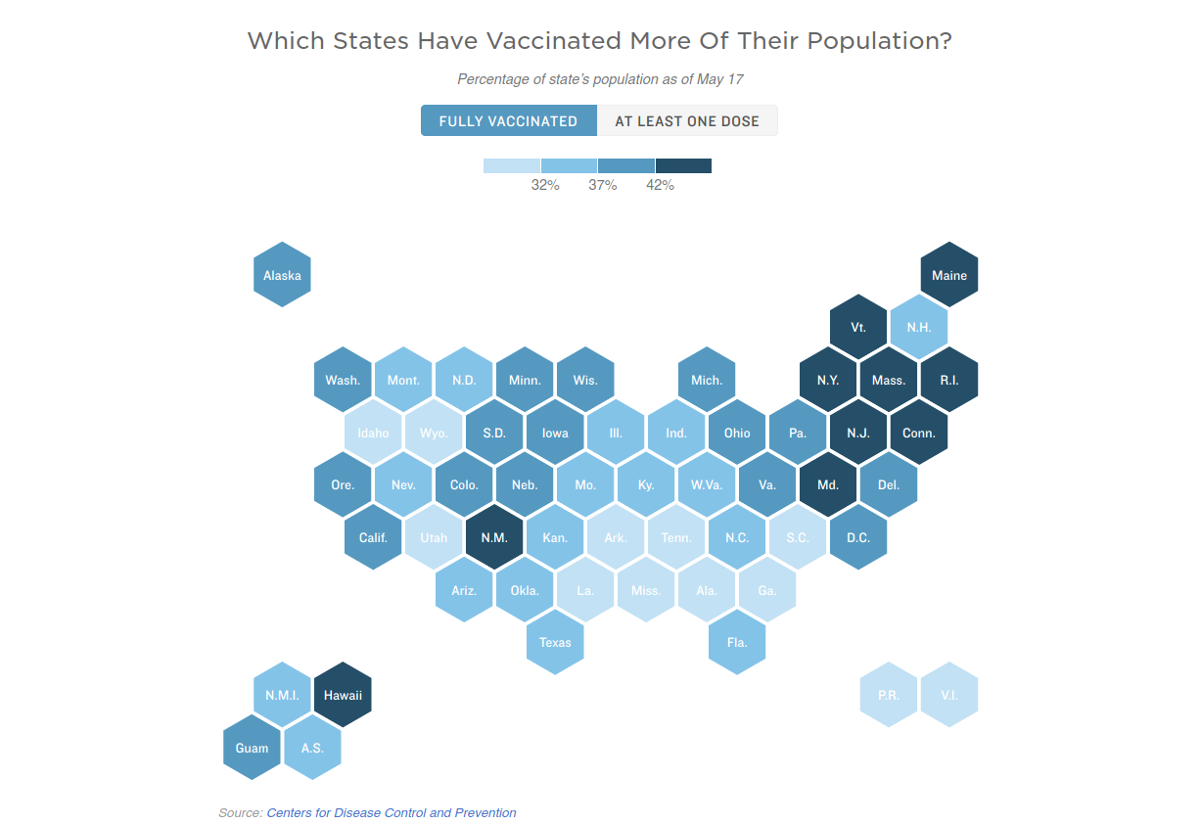
There are five different graphs that organize and display the data from the CDC. The first graph uses a U.S. hexagon heatmap. The different shades represent how much of a state’s population is vaccinated. You can toggle between fully vaccinated and those that have received the first dose to see how each state is progressing.
The second graph is a bar chart that shows how many doses have been given, per day, in the US since December 15th. The highest day was April 1st when 4,284,392 doses were administered. Unfortunately, vaccination numbers have trending downward since then.
The third graph down shows a projected chart of when the majority of people in each state will be fully vaccinated. Rhode Island is in the lead projecting 85% of the entire state to be vaccinated by July 10th, 2021. Mississippi is the last state projected to have 85% of the population vaccinated but not until December of 2022. These projections change on a daily basis based on each state’s weekly vaccination rate.
The forth visual is a bubble chart (specifically a clustered force layout) which represents which states lead the race to get their population vaccinated as well as the state’s population size. Maine currently leads the race with 48.7 of their population fully vaccinated.
The final section on the page is a table showing how the vaccine rollout is going in each state. You can toggle between vaccination rates by age (percent of those over 18 and those over 65) as well as the percentage of doses used by each state. Now that vaccinations have been approved for people 12 years and older, this table will likely need to be updated to include those new numbers.