Charts
U.S. Cities Where Home Prices Have Increased the Most Since the Pandemic
The COVID-19 pandemic has impacted prices and expenses across the board. From groceries to living costs, most people are feeling a hit to their wallets. Housing costs in particular have been rising exponentially. Where in the United States have they been rising the most?
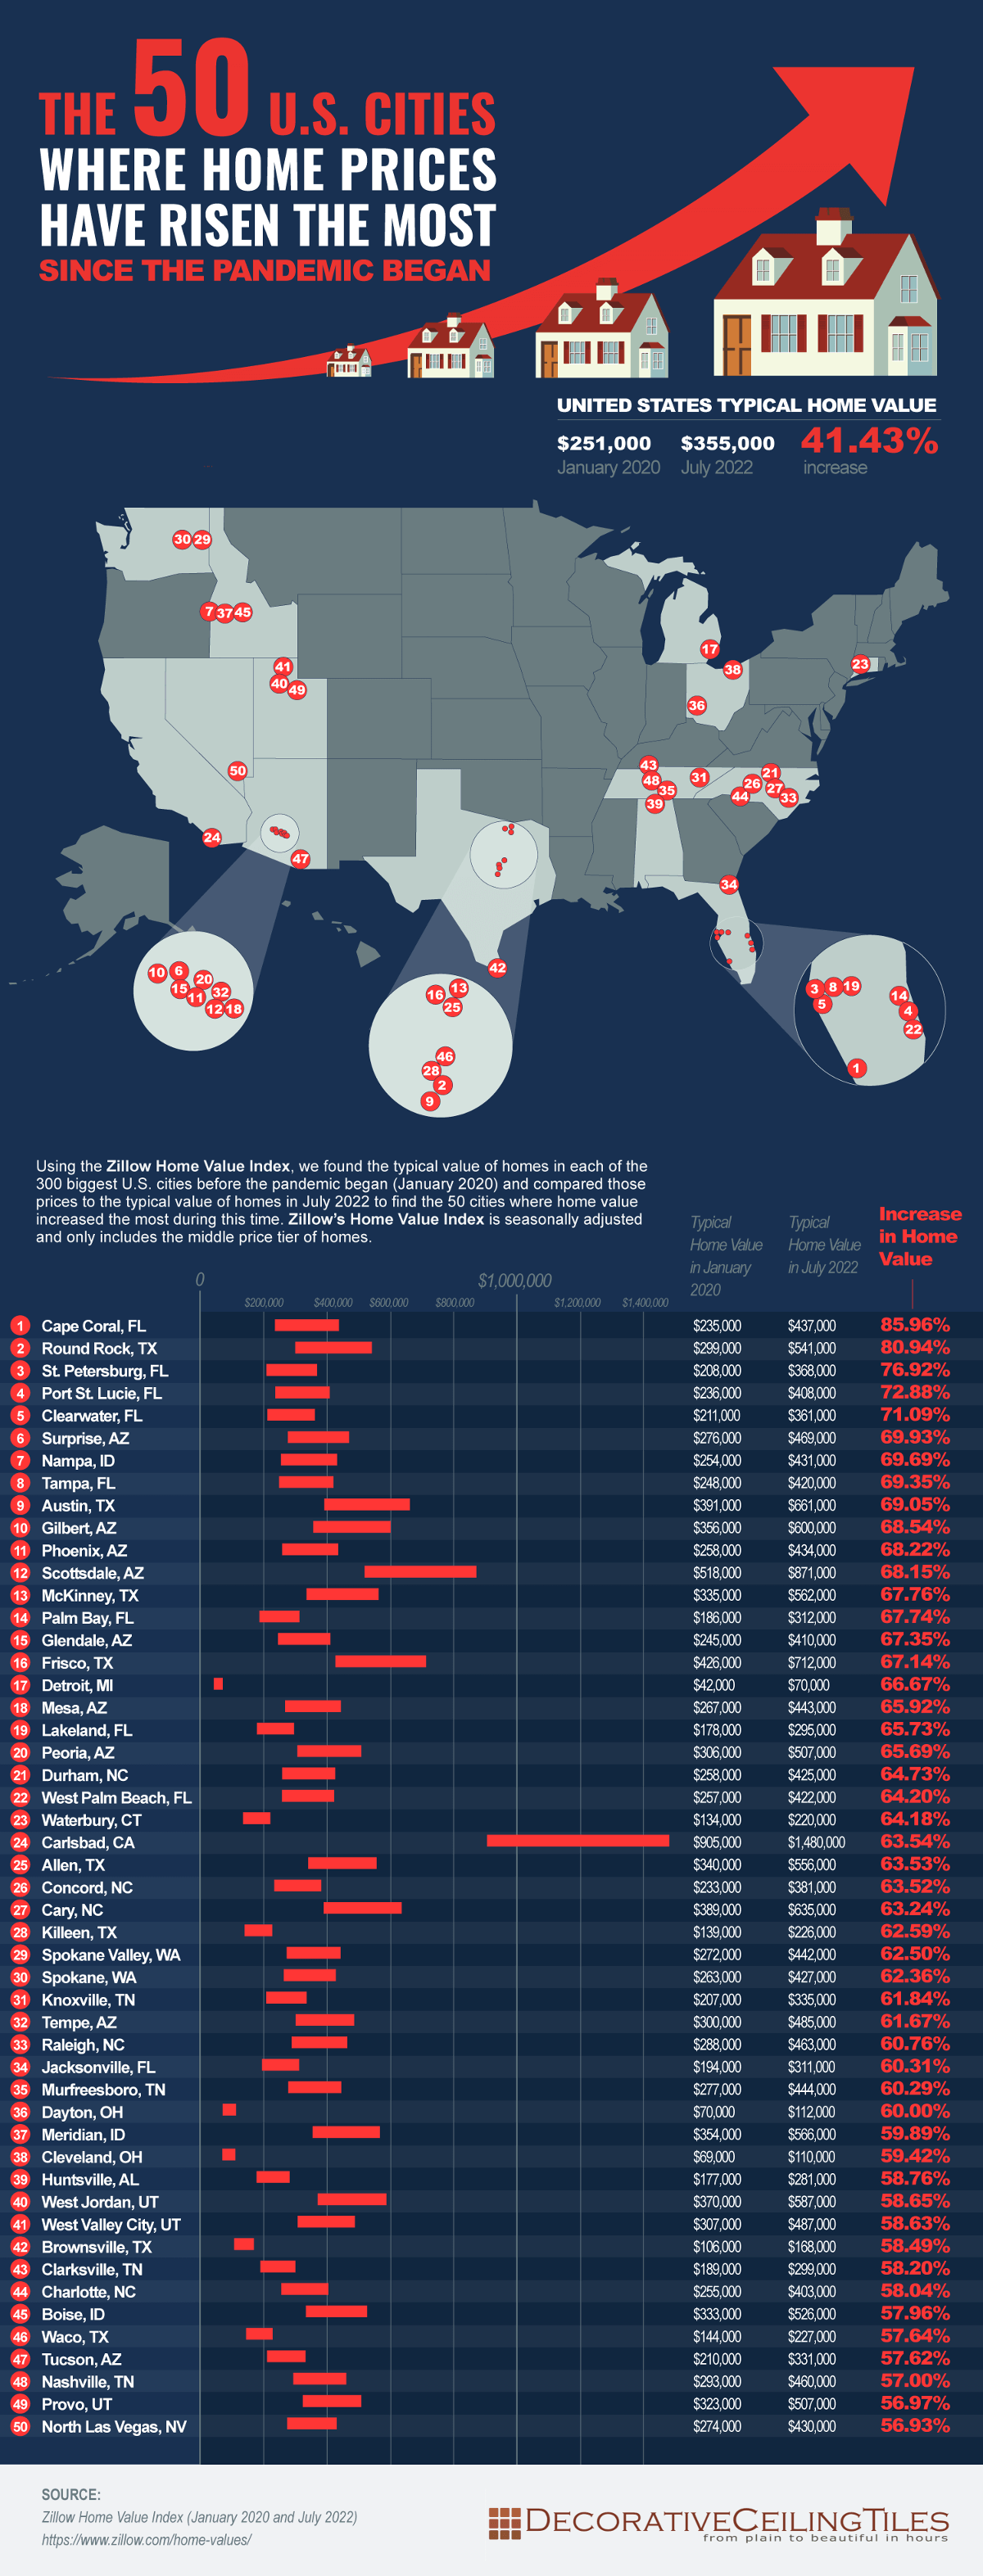
The following visualization shows where in the U.S. home prices have increased the most since the pandemic. The graphic utilizes a pin map at the top to indicate where each of the cities are located, and then uses a column range chart to depict the change in home prices between January 2020 and July 2022.
Click below to zoom
These are the cities that have seen the biggest increase in home prices since the beginning of the pandemic in 2020:
- Cape Coral, FL: 85.96%
- Round Rock, TX: 80.94%
- St. Petersburg, FL: 76.92%
- Port St. Lucie, FL: 72.88%
- Clearwater, FL: 71.09%
- Surprise, AZ: 69.93%
- Nampa, ID: 69.69%
- Tampa, FL: 69.35%
- Austin, TX: 69.05%
- Gilbert, AZ: 68.54%
Unsurprisingly, since many employees are now allowed to work from home, warmer locations have become popular places for relocation. This could play a part in why home prices are increasing in states like Florida and Arizona.
On the flip side, these are the cities where home prices have risen the least since the pandemic:
- Odessa, TX: -1.98%
- Midland, TX: 6.27%
- Washington, DC: 10.47%
- San Francisco, CA: 11.27%
- Las Cruces, NM: 11.35%
- New York, NY: 12.95%
- Laredo, TX: 15.85%
- Boston, MA: 15.91%
- Minneapolis, MN: 16.72%
- Shreveport, LA: 16.96%
Odessa, TX is the only place where home prices have decreased. Major cities like San Francisco, New York City, and Boston have also experienced low levels of home price increases, likely due to many people leaving large cities during the pandemic.
Which city on the list is most surprising to you?
