Charts
A Hidden Health Crisis: Where Children Drink the Most Soda
A new study from the PA Requirements team unveiled regional patterns in children’s soda consumption across the U.S. Some states have consumption rates up to five times higher than others, revealing some truly alarming statistics. The map is based on the CDC’s Youth Risk Behavior Survey, which included 42 states in a week-long analysis of soda drinking behavior. The end result is a map that paints a concerning picture of soda consumption among American children.
Click below to zoom.
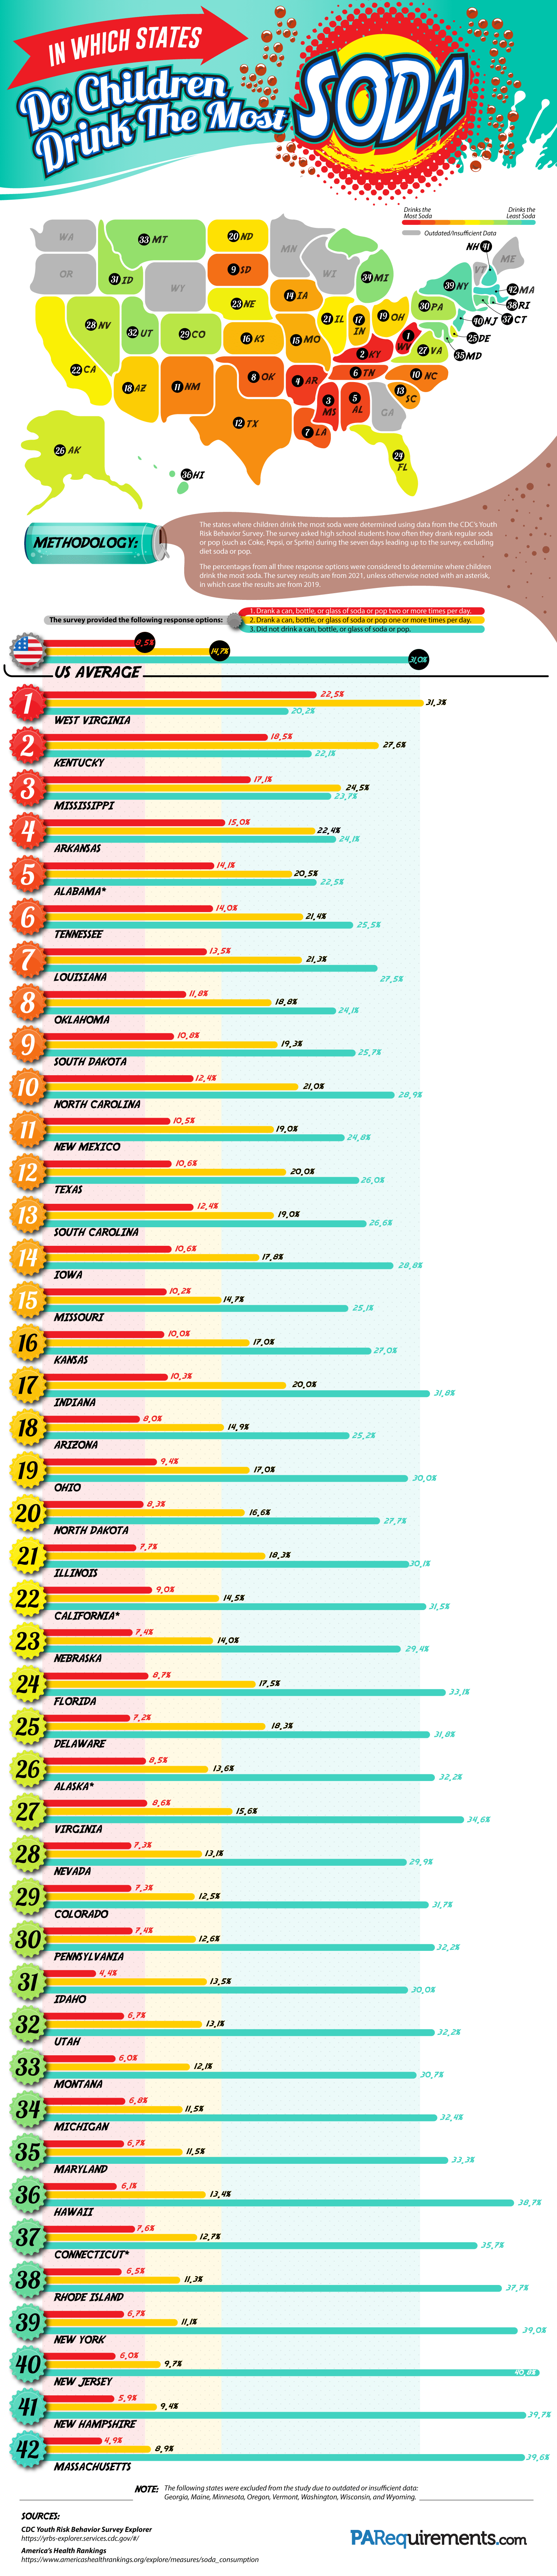
West Virginia is at the top of the list, with 22.5% of high schoolers there reporting that they drank soda twice or more every day. That’s one in four West Virginia teens having several sodas every single day. Kentucky is close behind, with 18.5% of teens drinking multiple sodas, followed by Mississippi at 17.1%. These numbers seem especially high compared to the state with the lowest consumption, Massachusetts. Only 4.9% of teenagers there reported drinking multiple sodas a day.
The survey asked students to report their soda consumption with one of three answers each day: didn’t drink any soda, drank one soda, or drank two or more sodas. Responses show that children in Southern states drank the most soda.
Unfortunately, the results show us more than beverage preferences. There are a lot of health implications we can glean from these results. One soda contains 7 to 10 teaspoons of sugar, comprised of high-fructose corn syrup. For small children, the impacts of consuming so much processed sugar are even more pronounced. High sugar consumption is linked to obesity, dental disease, sleep disruption, and type 2 diabetes.
Children are also more prone to developing a sugar addiction. Drinking too much sugar leads children to develop a sugar addiction and symptoms of excessive sugar consumption, which include weight gain, mood swings, and trouble focusing.
The map colors show us a “sugar belt” across the Southern United States, with seven of the top highest consuming states located in the South. Research has shown that education impacts nutritional choices as well as income levels. Some of the states on the high end of the spectrum have lower public school ratings and high poverty levels, so it seems this isn’t coincidental. Culture may play a part as well. With many soda companies originating in the South, it might be that Southerners enjoy soda more and have normalized having a soda with meals.
Understanding soda consumption rates and health risks can help parents and educators make informed decisions about health choices for children. We don’t always realize how much soda we’re consuming until we look at hard data like this. This map and research underscore the need for soda-drinking interventions, especially in certain regions. While soda is a good treat, it’s not intended to be drunk daily, especially not for children. Through studies like this, awareness, and education, we can improve the health of American children.