Business Visualizations
Cities that Saw the Most Small Business Openings Through the Years
Many Americans have ambitions of opening their own business. From restaurants to clothing boutiques, small businesses are one of the hallmarks of the American dream. People from cities all over the country scout out the perfect locations to start their small businesses.
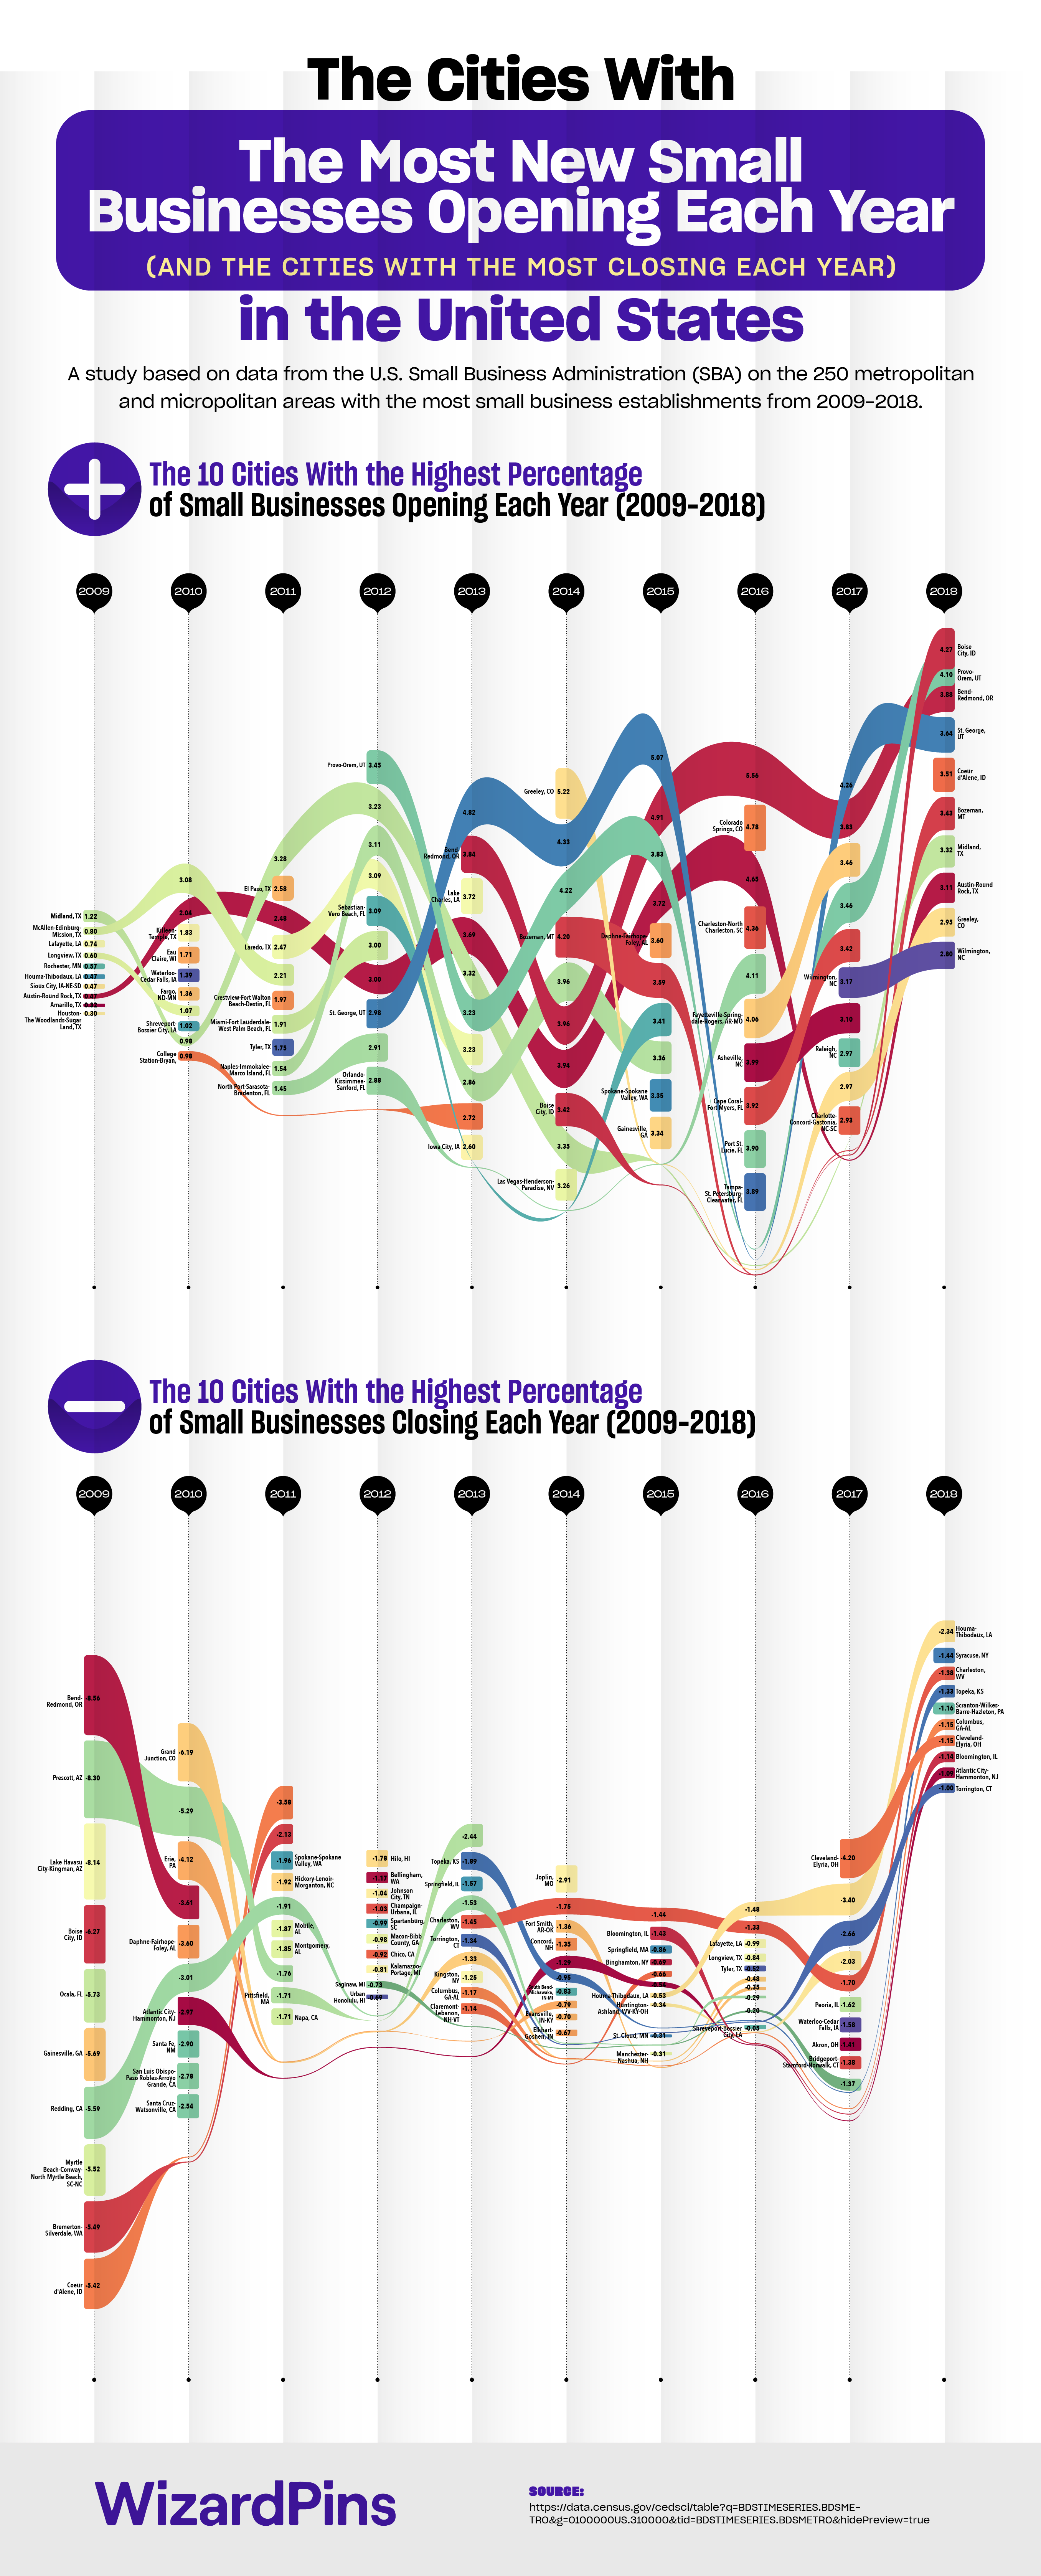
This visualization from WizardPins.com illustrates which U.S. cities had the most small business openings each year between 2009 and 2018.
Click below to zoom

The image utilizes sorted stream graphs to visualize the 10 cities that had the highest percentage of new small business openings each year. It also contains a contrasting graph that illustrates the U.S. cities with the highest percentage of small business closings each year. Some cities (like Austin-Round Rock, TX and Midland, TX) manage to make the list nearly every year. In contrast, Charleston, WV sadly has experienced the one of the highest rates of small business closures since 2013.
As of 2018, these are the U.S. cities that have the highest percentages of small business openings:
- Boise City, ID — 4.274% increase
- Provo/Orem, UT — 4.109% increase
- Bend/Redmond, OR — 3.889% increase
- St. George, UT — 3.64% increase
- Coeur d’Alene, ID — 3.518% increase
- Bozeman, MT — 3.434% increase
- Midland, TX — 3.326% increase
- Austin/Round Rock, TX — 3.11% increase
- Greeley, CO — 2.959% increase
- Wilmington, NC — 2.802% increase
Surprisingly, Idaho cities make the list multiple times. Boise, Idaho’s capital city, saw a more than 4% increase in small business openings in 2018. This makes them the city with the highest rate of small business openings in the country. Coming in at the number five spot is Coeur d’Alene. It’s the largest city in North Idaho