Charts
Study Examines What Americans Spend the Most Money On
As the economy shifts, we can see changes in consumer spending habits, as reflected in this Qualtrics study, which reveals what Americans spend the most money on. These insights show us what Americans prioritize and how much flexible spending money they have available for non-essentials. Using data from the U.S. Bureau of Labor Statistics, the team created a chart breaking down spending by category and then a further breakdown of spending categories by income bracket.
Click below to zoom.
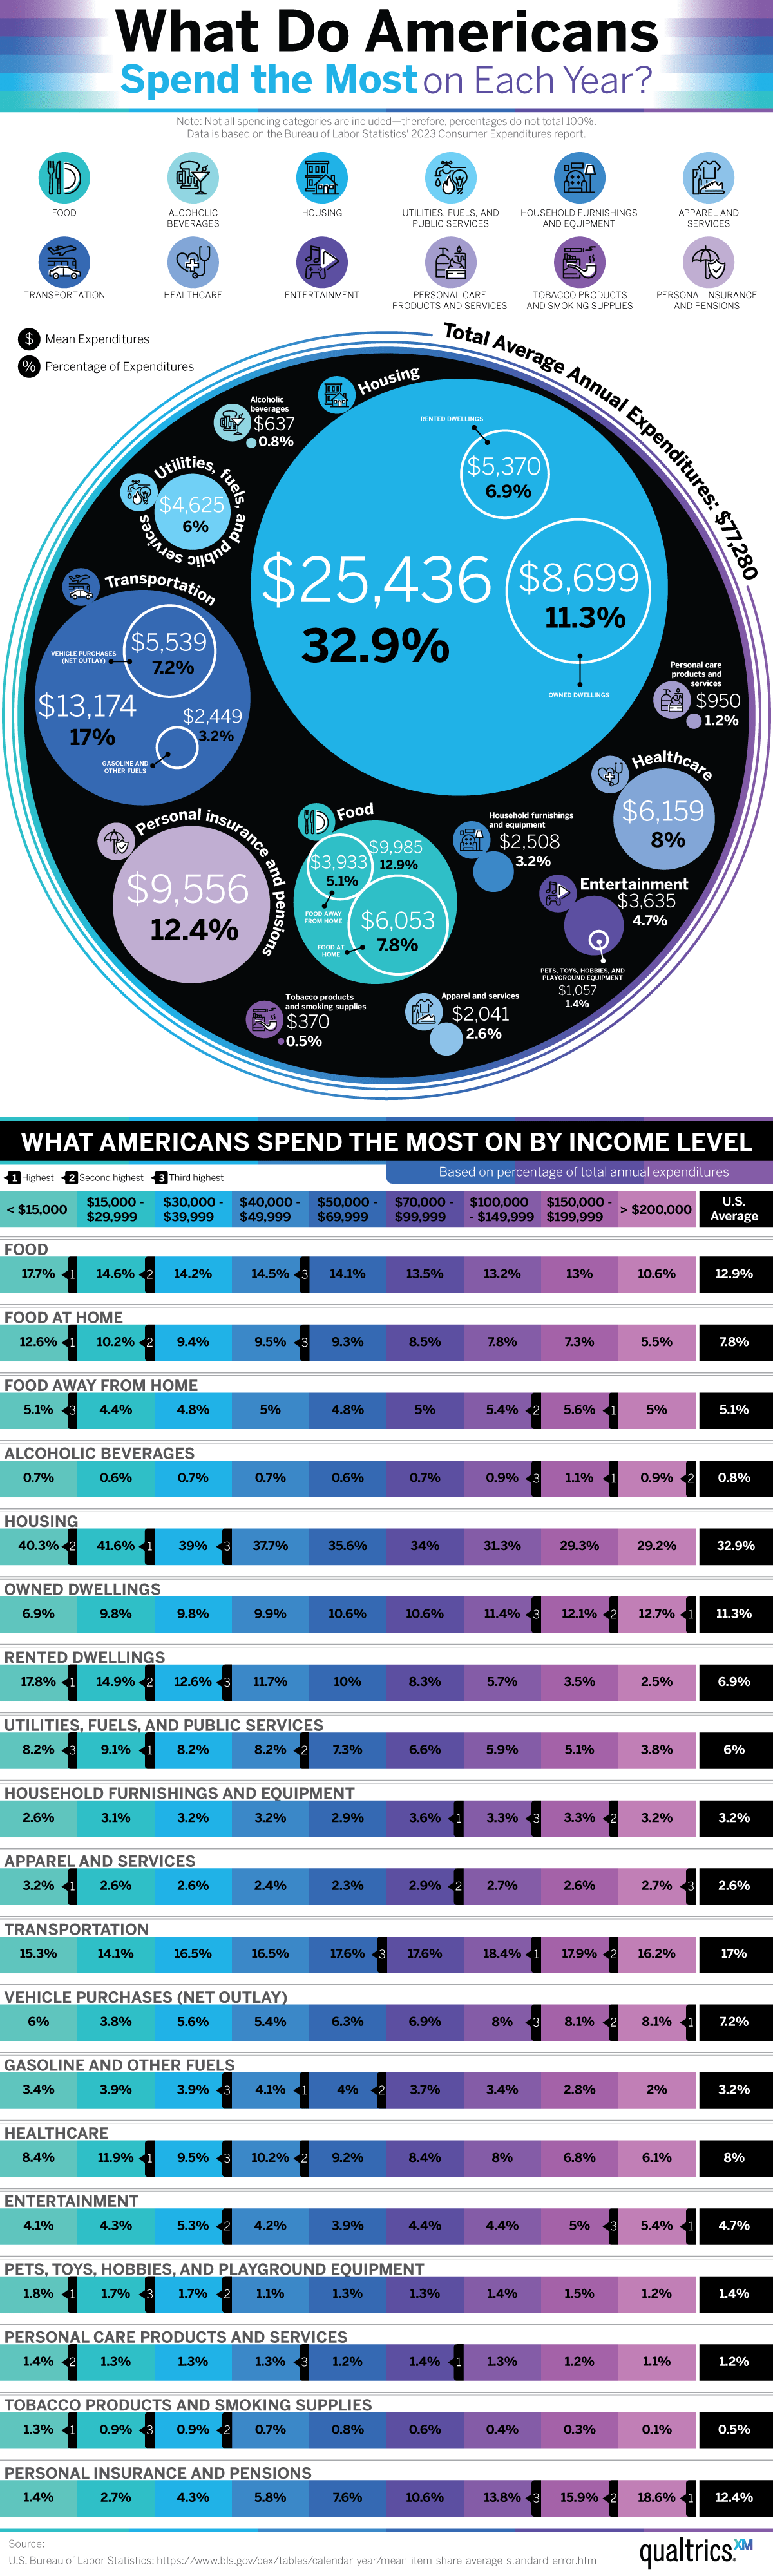
According to the data collected, Americans spend around $77,280 per year. This spending was divided into these categories, ranked by the amount spent on each.
- Housing – $25,436 (32.9% of total annual expenses)
- Transportation – $13,174 (17% of total annual expenses)
- Food – $9,985 (12.9% of total annual expenses)
- Personal insurance and pensions – $9,556 (12.4% of total annual expenses)
- Healthcare – $6,159 (8% of total annual expenses)
- Utilities, fuels, and public services – $4,625 (6% of total annual expenses)
- Entertainment – $3,635 (4.7% of total annual expenses)
- Household furnishings and equipment – $2,508 (3.2% of total annual expenses)
- Apparel and services – $2,041 (2.6% of total annual expenses)
- Personal care products and services – $950 (1.2% of total annual expenses)
- Alcoholic beverages – $637 (0.8% of total annual expenses)
- Tobacco products and smoking supplies – $370 (0.5% of total annual expenses)
Across income categories, Americans spent the most money on housing, which comes as no surprise. Housing costs and mortgage interest rates have been on the rise since 2020 in response to a shortage in housing stock. That means Americans must spend more if they dream of home ownership. The team’s data takes rent into account as well.
Many people also spent a lot on transportation. This is due to a combination of rising fuel costs leading to higher vehicle prices, as well as parts shortages that affected vehicle stock and prices. Another necessity takes number three on the list. According to the data, Americans are spending $1,174 a month on groceries. Grocery prices have dominated newsfeeds for the past few years. We all need food to survive, so seeing this item so far up the list is no surprise.
With so much uncertainty in the world, it seems Americans are investing heavily in insurance and pensions. The data shows that the more money someone makes, the more they spend on insurance, which makes sense as they need to protect expensive assets. Insurance can help offset unforeseen costs and protect investments. Unfortunately, this insurance spending is shared with high healthcare spending as well. Americans spend more than most citizens of other wealthy nations. As the cost of living has increased, so have health insurance premiums. Healthcare spending not only includes health insurance, but also co-pays, medical supplies, and surprise bills.
We live in an era full of strange relationships with money and wealth. Many Gen Z Americans state feeling “pressured” to show off wealth and luxury on social media, while 41% of Americans don’t feel they’re financially secure. Despite rising expenses, Americans still enjoy shopping, with many of them choosing to go shopping as a treat once a month. Gen Z cites boredom as their number one reason for spending money. Even so, 73% say they are willing to cut back on their daily spending to save for longer-term goals. It seems that although prices are rising, many Americans, particularly younger ones, are still willing to spend on a variety of areas.