Charts
Visualizing the Cost Per Ounce of the World’s Most Valuable Metals
The team at Kylar Mack shows us just how valuable the world’s most precious metals are with this illustrated chart visualizing the cost per ounce of the most expensive metals and alloys. A metal is naturally occurring, and many appear on the periodic table of elements whereas an alloy combines two elements.
On this illustrated chart, we can truly visualize the comparative value of these metals because the team stacked money representative of the value beside an image of each metal. The chart is a great example of the power of visual data. Our eye is immediately drawn to the vast stacks of cash beside the most valuable metal, Californium. These stacks tower above ever other metal on the chart making it clear that not all metals are created equal.
Click below to zoom
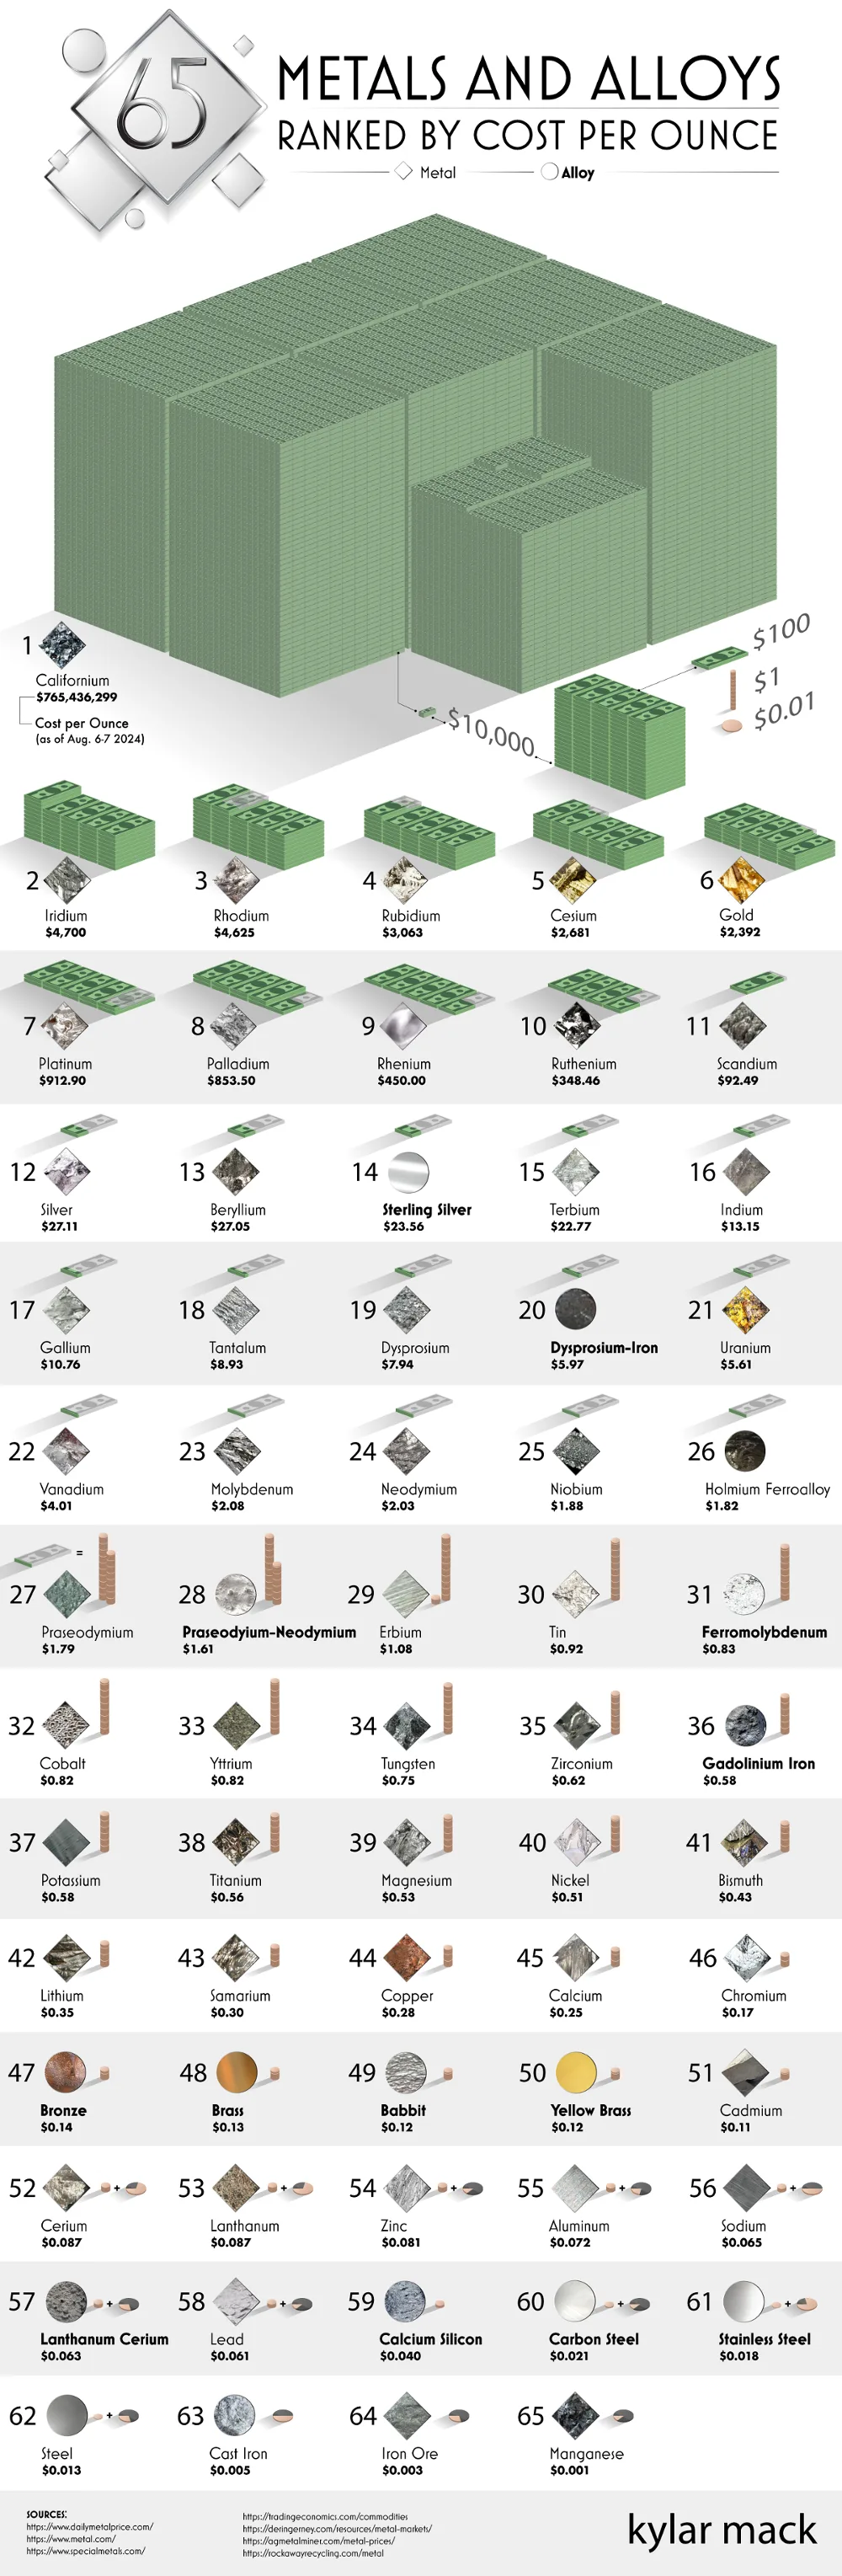
Californium’s value is a shocking $765,436,299 per ounce! That’s significantly higher than the second-most popular metal, a non-synthetic called Iridium, which is valued at $4,700. The key to the value difference lies in the fact that Californium is a synthetic substance. It’s created in a nuclear reactor and only two plants in the world have the capability of engineering it. As for Iridium, it’s naturally occurring but hard to mine and access. It’s found deep under the Earth’s crust, often attached to asteroids. Through this chart, we can learn more about different metals as well as why they’re so highly valued. Many are needed for key electronics and aerospace parts.