Charts
Countries by Their Share of the Earth’s Surface
The total surface area of the Earth is about 197 million square miles. Only about 29% of that area is land; which means the vast majority is covered in water. Looking at this fun and interesting visualization from VisualCapitalist.com you can easily see just how vast the words oceans are compared to land surface area. This information is presented in a gorgeous donut chart which is an efficient and one of our favorite ways to display data when you want to show comparisons. You can think of a donut chart just like a pie chart with the center cut out, this allows the viewer to see the differences easier when compared to slices in a pie chart. Check it out here:
Click below to zoom
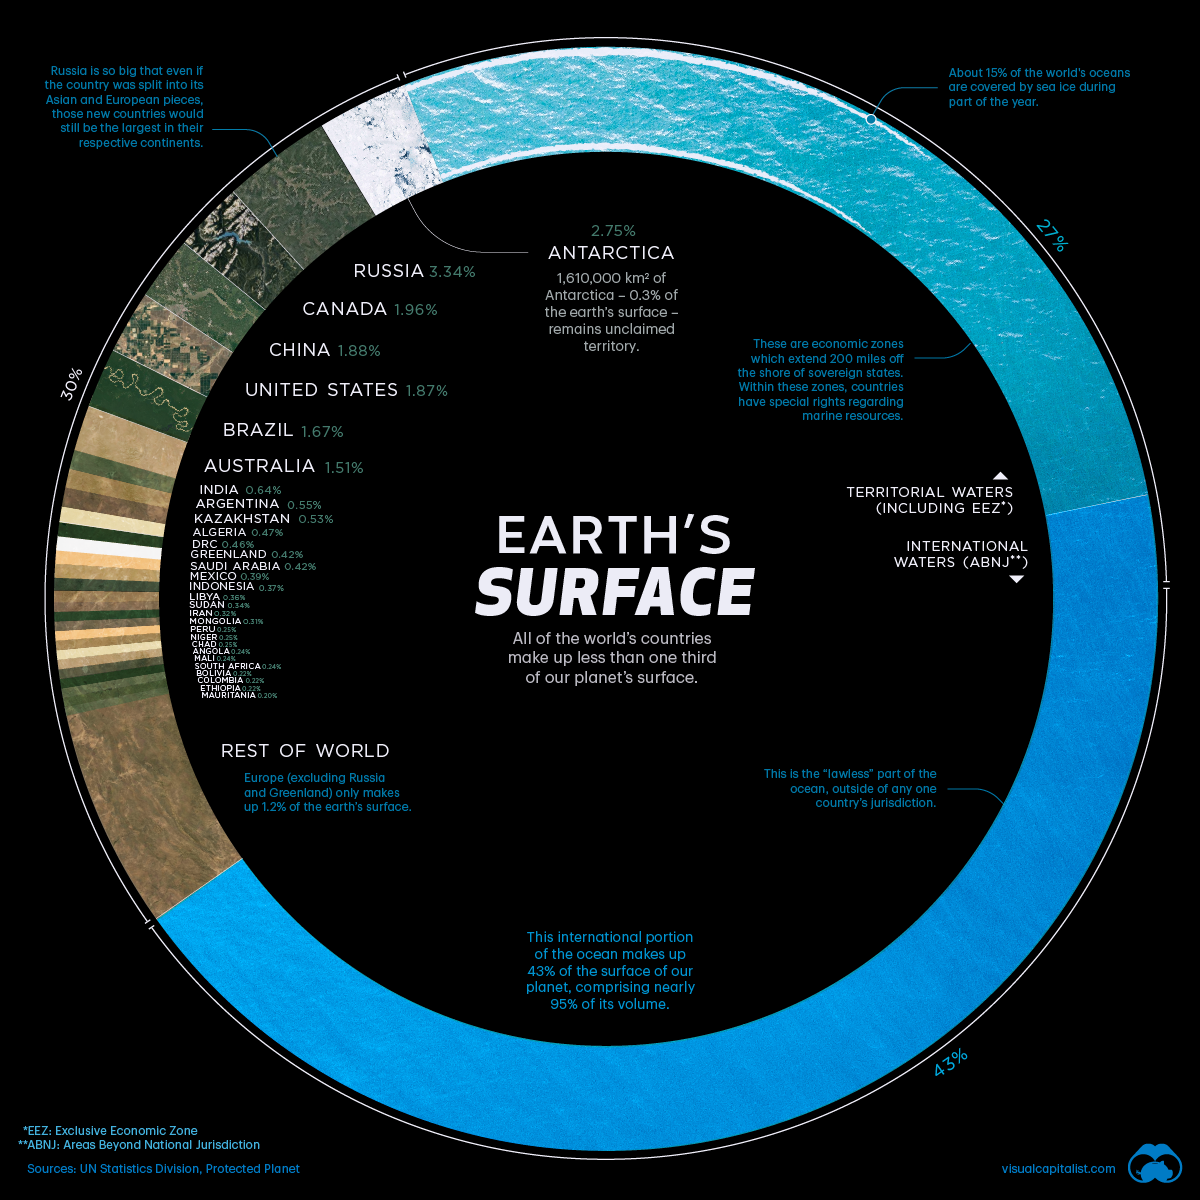
Now, let’s dive into this graphic. Using data from the UNSD (the United Nations Statistics Division), this visualization breaks down individual countries’ share of the Earth’s surface. Russia, Canada, and China are the largest countries by surface area. Russia takes up a whopping 3.35% of the Earth’s land followed not-so-closely by Canada at 1.96%. The continent of Antarctica also takes up a large percentage of Earth’s surface area at 2.75% although .3% of that remains unclaimed and uninhabitable. Other nations that have a combined land mass of over 1% include the US at 1.87%, Brazil at 1.67%, and Australia at 1.51% respectively. There are a total of 195 countries and other regions that make the remaining 1% of the Earth’s surface area. The smallest on this list is the country of Monaco at just 499 acres and Vatican City, the smallest country in the world, taking up just 109 acres of the Earth’s surface.