Charts
Countries by Their Share of the Earth’s Surface
The total surface area of the Earth is about 197 million square miles. Only about 29% of that area is land; which means the vast majority is covered in water. Looking at this fun and interesting visualization from VisualCapitalist.com you can easily see just how vast the words oceans are compared to land surface area. This information is presented in a gorgeous donut chart which is an efficient and one of our favorite ways to display data when you want to show comparisons. You can think of a donut chart just like a pie chart with the center cut out, this allows the viewer to see the differences easier when compared to slices in a pie chart. Check it out here:
Click below to zoom
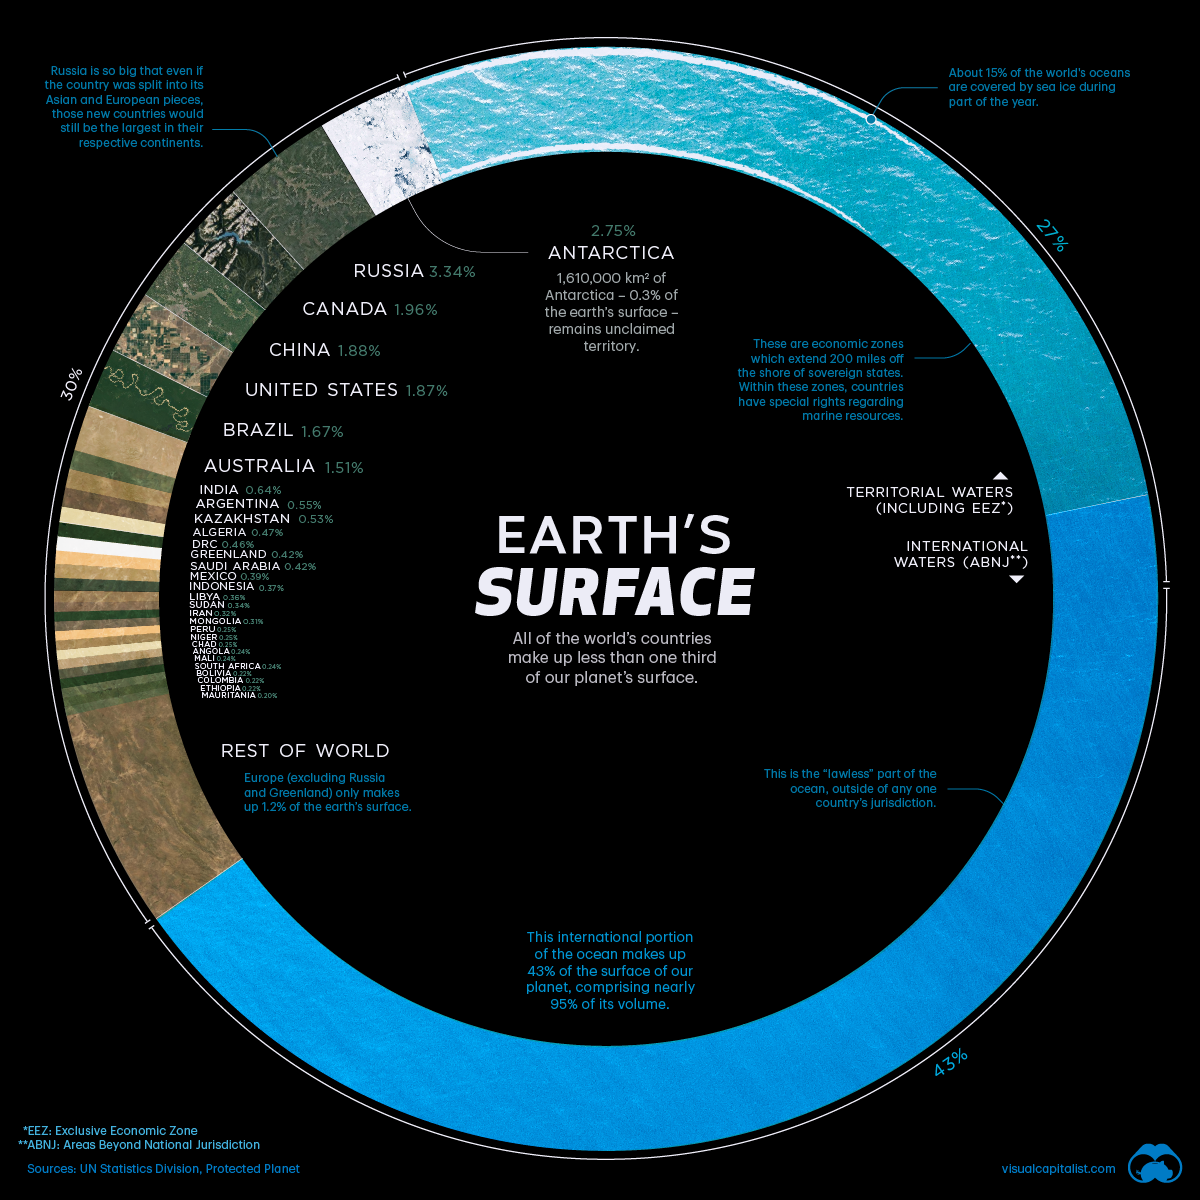
Now, let’s dive into this graphic. Using data from the UNSD (the United Nations Statistics Division), this visualization breaks down individual countries’ share of the Earth’s surface. Russia, Canada, and China are the largest countries by surface area. Russia takes up a whopping 3.35% of the Earth’s land followed not-so-closely by Canada at 1.96%. The continent of Antarctica also takes up a large percentage of Earth’s surface area at 2.75% although .3% of that remains unclaimed and uninhabitable. Other nations that have a combined land mass of over 1% include the US at 1.87%, Brazil at 1.67%, and Australia at 1.51% respectively. There are a total of 195 countries and other regions that make the remaining 1% of the Earth’s surface area. The smallest on this list is the country of Monaco at just 499 acres and Vatican City, the smallest country in the world, taking up just 109 acres of the Earth’s surface.
Business Visualizations
New Research Shows Which Vehicle Makes and Models are Deadliest
Fatal accidents are all too common in the United States, but some crucial factors can affect whether an accident becomes deadly. One of those factors is the safety features of the vehicles involved. Makes and models aren’t equally safe, and the research conducted by the team at Convoy Car Shipping makes this grim fact clear.
The research used data from government organizations to study the statistics on which vehicles were involved in fatal accidents and how many fatal accidents a given vehicle was involved in compared to number of them on the road. The results give us a balanced look at which makes and models have the worst track record of fatal accidents.
Click below to zoom
The research shows that these vehicles are the deadliest:
- Ford Ranger
- Jeep Cherokee
- Dodge Charger
- Nissan Maxima
- Ford Taurus
- Ford Mustang
- Chevrolet Camaro
- Chevrolet Blazer/Tahoe
- Chevrolet Silverado
- Ford Expedition
American-made vehicles aren’t looking safe when we consider the number of Ford and Chevy models on this top ten list. Examine the data to find information on even more vehicles. You’ll also see that this make/model list differs from overall crash statistics. The broader picture proved Harley Davidson motorcycles to be the second most deadly vehicles. We think that this skews the story the data tells because motorcycles have far fewer safety features than cars and trucks. The team at Convoy Car Shipping should be applauded for their attention to detail that considers the unequal safety standard on cars and trucks versus motorcycles. The research gives us all possible data so that vehicle owners can draw their own conclusions.
Charts
Visualizing the Cost Per Ounce of the World’s Most Valuable Metals
The team at Kylar Mack shows us just how valuable the world’s most precious metals are with this illustrated chart visualizing the cost per ounce of the most expensive metals and alloys. A metal is naturally occurring, and many appear on the periodic table of elements whereas an alloy combines two elements.
On this illustrated chart, we can truly visualize the comparative value of these metals because the team stacked money representative of the value beside an image of each metal. The chart is a great example of the power of visual data. Our eye is immediately drawn to the vast stacks of cash beside the most valuable metal, Californium. These stacks tower above ever other metal on the chart making it clear that not all metals are created equal.
Click below to zoom
Californium’s value is a shocking $765,436,299 per ounce! That’s significantly higher than the second-most popular metal, a non-synthetic called Iridium, which is valued at $4,700. The key to the value difference lies in the fact that Californium is a synthetic substance. It’s created in a nuclear reactor and only two plants in the world have the capability of engineering it. As for Iridium, it’s naturally occurring but hard to mine and access. It’s found deep under the Earth’s crust, often attached to asteroids. Through this chart, we can learn more about different metals as well as why they’re so highly valued. Many are needed for key electronics and aerospace parts.
Charts
Mapping Spam Call Hot Spots Around the Country
Spam calls are a widespread problem that can be a nuisance or leave important information vulnerable to scammers. This map from Ooma shows us that although spam calls are widespread, they seem to have concentrated hot spots around the nation.
The Ooma team used data from the Federal Communications Commission to pinpoint where the highest number of spam calls are occurring. The data is based on the number of spam call complaints the FCC receives per capita. The team highlighted each city with the highest number of calls and shows in a graph below the map how many spam calls complaints are received per 1,000 people. The map is a detailed look at where spam calls are concentrated, giving us an interesting look at the data. If you live near one of these hot spots, be wary of answering the phone.
Click below to zoom
These were the cities that had the highest number of spam call complaints per capita:
- Alexandria, Virginia: 22.84
- Pittsburgh, Pennsylvania: 18.75
- Orlando, Florida: 18.52
- Miami, Florida: 17.58
- Atlanta, Georgia: 16.39
- Las Vegas, Nevada: 16.12
- Knoxville, Tennessee: 15.18
- Plano, Texas: 14.91
- Washington, District of Columbia: 14.46
- Columbia, South Carolina: 14.44
Alexandria, Virginia, tops the list with the highest number of spam call complaints. The city has received so many that local police have had to put out spam call warnings and prevention tips. Seeing such high concentrations of spam calls definitely leads to interesting questions about why these areas might receive more calls than others.
Be sure to check the map carefully and take note of whether your area is near is near one of these locations.
-

 Business Visualizations4 weeks ago
Everything Owned by Apple
-
 Maps2 years ago
The Population Density of Europe (and the World) in Two 3-D Maps
-
 Maps1 year ago
The Most Popular Surnames in Countries Around the World
-
 Maps2 years ago
Where Have The Most Shipwrecks Occurred?
-

 Business Visualizations2 years ago
The Most Popular Board Games Based on Units Sold
-
 Maps2 years ago
The World’s Most Expensive Buildings in One Chart
-
 Charts2 years ago
Which Country Produces the Most Oil?
-
 Business Visualizations2 years ago
New Maps Show the Most Popular Beer by State


