Charts

Where Are the Most Bike-Friendly Cities in America?

Published

on

Cycling is becoming an increasingly popular activity in America, especially during the pandemic when so many are stuck at home. Bike sales soared in 2020 as people were looking for a safe activity to keep them active during quarantine.

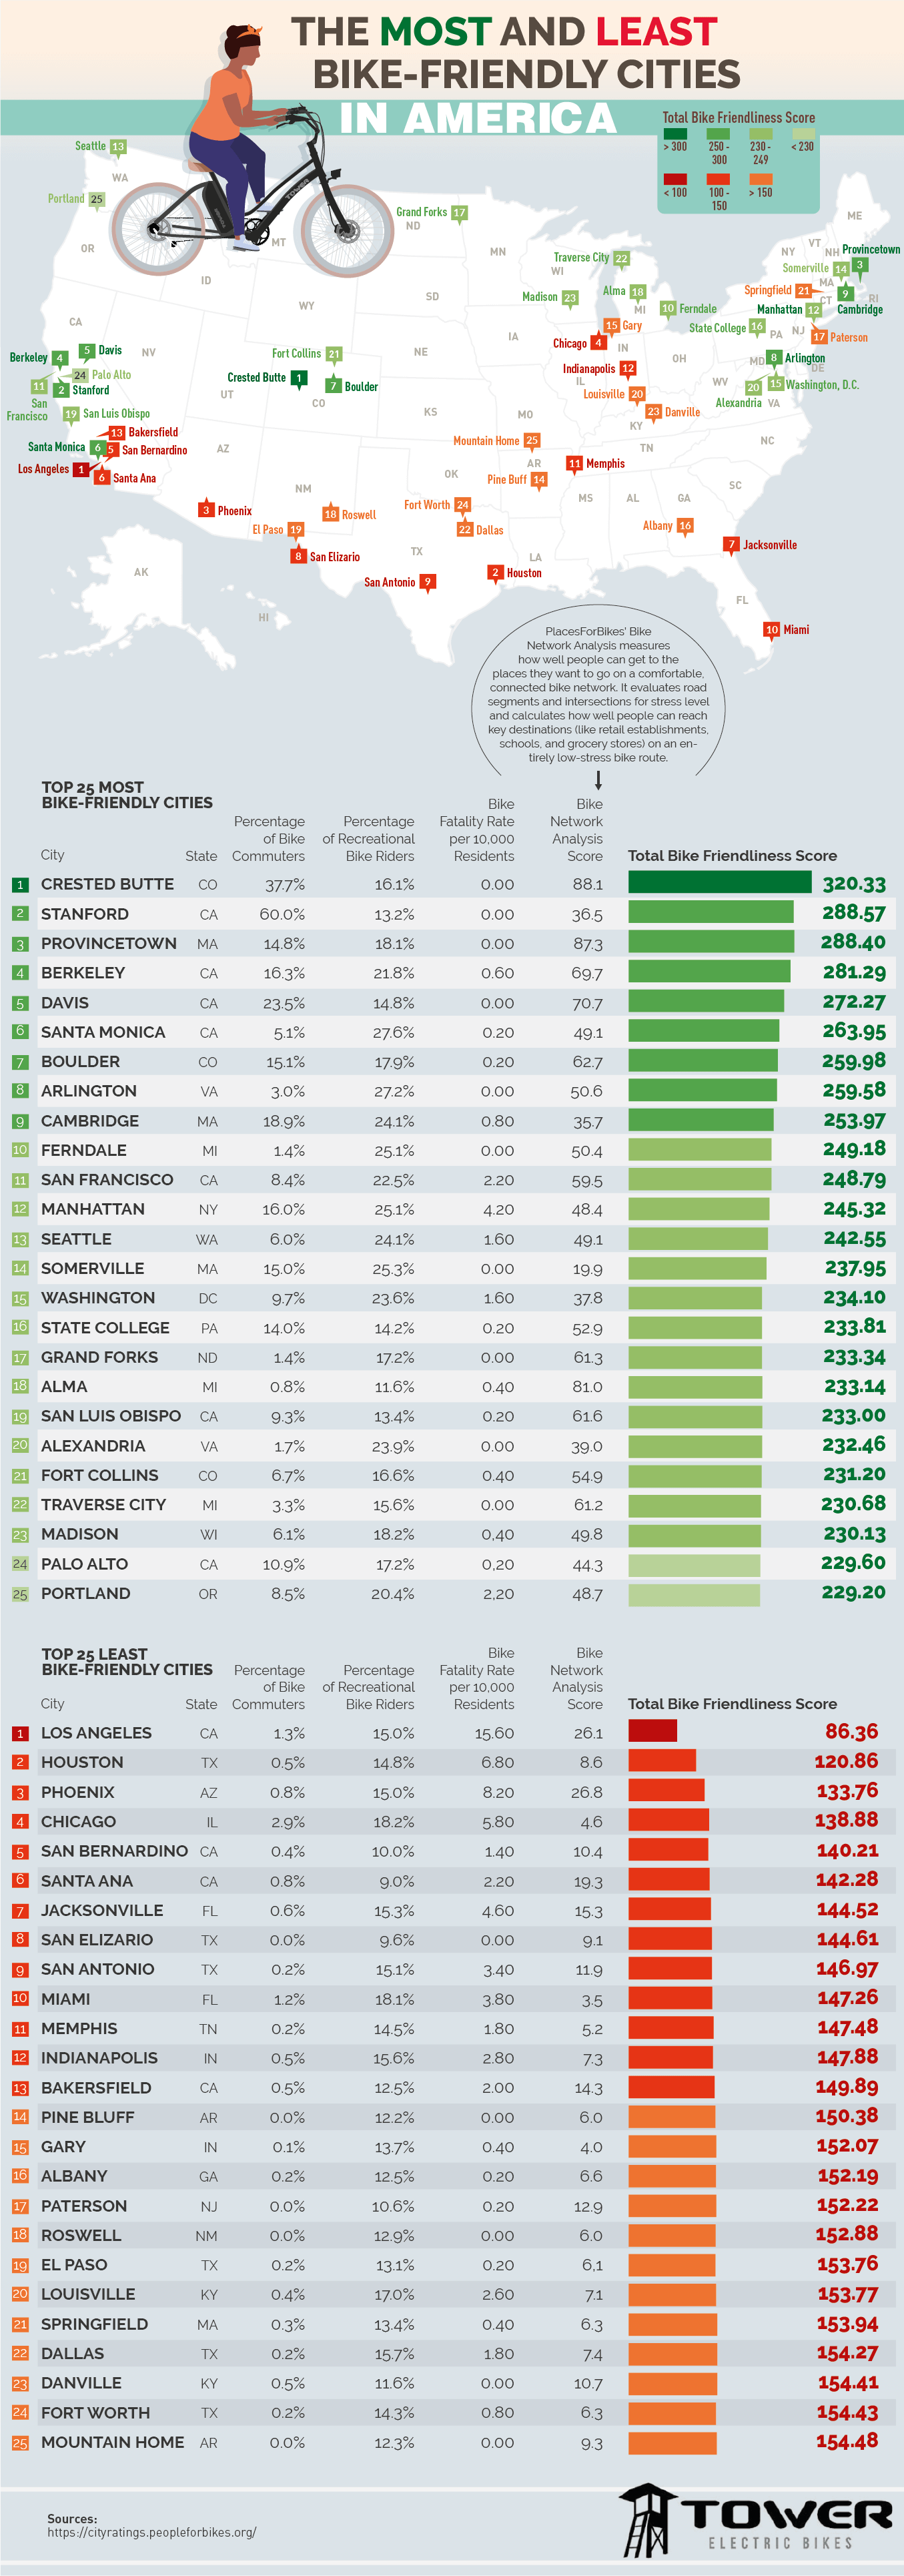
The following visualization from e-bike manufacturer Tower Electric Bikes analyzed a variety of data points to determine the most bike-friendly cities in America as well as the least bike-friendly.

Click below to zoom

The Most and Least Bike-Friendly Cities in America

The graphic compares the percentage of bike commuters, percentage of recreational cyclists, cyclist fatality rate, as well as a score of how well-connected and accessible each particular city is for cyclists to create an overall Bike Friendliness Score. It uses a pin map visualization to point out each of the most and least bike-friendly cities on the U.S. map, color coding each pin to its Bike Friendliness Score. Below the map is a breakdown of the individual statistics as well as bar charts illustrating each city’s score. All data originated from PeopleForBikes.org.

Topping the list of bike-friendly cities is Crested Butte, CO. The city is generally regarded as the birthplace of mountain biking and attracts recreational cyclists from around the country. While Crested Butte is a relatively small city, many larger metro areas make the list as well like Arlington (#8), Manhattan (#12), and Seattle (#13).

In terms of the least bike-friendly cities, many larger cities with poor bike-friendly accessibility to key destinations top the list. Cities like Los Angeles (#1), Houston (#2), and Phoenix (#3) have low numbers of bike commuters, high cyclist fatality rates, and a lack of bike connectivity to locations like grocery stores and schools, making them less hospitable to cyclists.

Continue Reading
Click to comment

Leave a Reply

Your email address will not be published. Required fields are marked *

Charts

The Most Profitable Companies by Industry

Published

on

If you are reading this on mobile, there is a 55.79% chance that you have an iPhone in your hand right now. So it is now wonder that Apple is the most profitable company in the United States with a mind-blowing profit of $94.68 billion in 2021! It pays to be a tech company in America – Apple, Alphabet, Microsoft, and Intel all reign supreme for profitability in the U.S. However, America is a land of opportunity and innovation, so there are many industries that massively lucrative! The team at Cloud Peak Law Group has provided minimalist but striking visualization of the most profitable companies in every industry, including aerospace and defense, apparel, energy, health care, media, finances, and beyond.

Click below to zoom

most-profitable-companies-by-industry-chartistry

The color coding makes it easy to spot trends in the industries that excel in the United States – lots of purples and grays (technology and investing/banking). Pfizer is the first healthcare company to appear on the chart – I wonder how different the rankings would be if COVID-19 never happened? According to The Guardian, Pfizer made nearly $37 billion in sales from its COVID-19 vaccine in 2021, making it one of the most lucrative products in history. The article is titled “Pfizer accused of pandemic profiteering as profits double”, but we desperately needed the vaccine, so can that really be considered predatory? It is certainly a topic of moral ambiguity and debate. I appreciate how quick and easy it is to interpret this chart. Simple can be so effective!

Continue Reading

Charts

These Are the Careers You Should Pursue If You Don’t Want Your Job Stolen by Artificial Intelligence

Published

on

The debut of ChatGPT has sparked a frenzy of curiosity, excitement, and concern about what artificial intelligence is capable of now and in the near future. Will robots be able to perform surgeries? Will they be able to create artistic masterpieces? Will they be able to perform music that moves the soul? Most alarmingly, will they be able to take jobs away from humanity? While some jobs are definitely at risk of automation, there are many kinds of jobs that artificial intelligence is deemed incapable of performing (for now). The team at U.S. Career Institute has created a fascinating visualization exploring the 65 jobs with the lowest risk of robotic automation. Check it out:

Click below to zoom

careers-safe-from-artificial-intelligence

First off, I absolutely LOVE this design, especially the header! How could I not scroll down after seeing that eerily realistic robotic hand touching the globe. Is it trying to penetrate it to take over our jobs? Or is it merely curious? The color scheme, typography choices, and background all come together for an aesthetically pleasing effect. I was surprised to see choreographers as the 2nd occupation with a 0% probability of automation. I imagine artificial intelligence would be capable of scouring countless dance videos online, distinguish patterns, and string together moves that would be appealing and catchy. But perhaps the art of interpreting music and words with movement is purely human. Many of the top occupations involve social skills and emotional intelligence, so that makes a lot of sense. Are you worried about artificial intelligence becoming too embedded in the economy and daily life? We would love to hear your thoughts in the comments below!

Continue Reading

Charts

Food Prices Are Skyrocketing Across the Nation, Here’s Where The Problem is the Worst

Published

on

It is no secret that grocery bills have become much more painful in recent months. Post-pandemic consumer demand, ongoing supply chain shortages, unstable weather patterns, geopolitical crises like the war in Ukraine, and overall inflation all contribute to the high price of food. Food prices have increased 13.5% between August 2021 and August 2022, which is double the overall inflation rate! As with most trends, the increase in prices varies across the United States – many cities are experiencing a significantly higher increase in grocery bills. Take Indianapolis, Indiana for example – grocery bills have increased a staggering 50.6%! The team at Nadric & Cohen Accident Injury Lawyers have compiled information from multiple databases to create a fascinating (and terrifying) visualization of how much more seven common foods cost in the 50 most populous cities.

Click below to zoom

food-prices-skyrocketing-problem-chartistry

The foods they have included are eggs, bread, whole milk, cheese, potatoes, apples, and chicken. It is getting more and more uncomfortable being an omelet enthusiast! I cannot believe that 16 ounces of cheese cost $10.39 in Oakland, California and 12 eggs cost $5.66 in Las Vegas, Nevada! I will say though that the exorbitant price of food these days has compelled me to become more creative and less wasteful with meals to get the most bang for my buck. How much is your grocery bill on average? Do you have any frugal but delicious meal ideas? I would love to hear about it in the comments!

From a design perspective, this visualization is well-organized and pleasant to read despite the abundance of information. The header is beautiful, although it pains me to imagine how much all of that would cost in real life. Whoever is buying those groceries is living large because they bought not one but TWO dozen eggs!

Continue Reading

Trending