Business Visualizations
32 Products with the Highest Markup
Society has been trained not to blink an eye when paying two bucks for a bottle of water, or shelling out ten dollars for a bucket of movie theater popcorn that would cost next to nothing when made at home. However, a bottle of water typically only costs five cents to make, and the wholesale price of popcorn is about 35 cents. When we pay astronomical prices for such products, we are often paying more for convenience, experience, inflation, and societal pressures than we are for actual materials or labor. Products that are rip-offs are aplenty, but with the knowledge offered by this visualization from Swagbucks.com, we can become more savvy and informed consumers:
Click below to zoom
We appreciate the simple and striking data visualization, which is easy to interpret quickly while having a bold emotional impact. The proportional bubbles used to convey percentages do an excellent job in capturing just how monumental these product markups are. Sometimes it makes sense to pay more for the enjoyment and experience (for example, buying a mixed drink at a restaurant), but many of these are infuriating. A funeral casket costing $1,295 often goes for around $325 wholesale. Even in death, it is impossible to escape price-gouging. Also, why is printer ink so expensive? Turns out, many printing companies use an outdated “razor-and-blades model”, where they sell printers cheaply at a loss and attempt to make up for it with ink sales. They also purposely program their printers to prevent the usage of more affordable third-party cartridges by using microchips and firmware updates. Even more reason to be angry when your printer suddenly stops functioning again.
Here are the top 5 products with the biggest markups:
- Text messages (without an unlimited plan) – 6,000%
- Bottled water – $4,000%
- Brand-name prescription drugs – 200-3,300%
- High school ring – 1,329%
- Movie theater popcorn – 1,275%
With the high cost of college tuition making headlines, choosing a college major wisely becomes a crucial financial decision. Student Choice has analyzed college majors by their return on investment (ROI) and created a graph that ranks degrees by their ROI. Passion is certainly an important factor in choosing a college major, but knowing the ROI of a major helps prospective students plan for their future and understand their future financial prospects. This graph is a powerful tool for navigating a competitive job market.
Click below to zoom.
We can see STEM dominating the results, with an Engineering degree claiming the highest ROI at 326.6%. Computer Science earns second place with a 310.3% ROI, and Nursing has a 280.9% ROI. Student Choice gathered its data from the Bureau of Labor Statistics and compared five-year earnings to the cost of four years of college tuition. Unfortunately, Liberal Arts subjects are at the bottom of the list, although they still show a positive ROI. Education majors have a 169.8% ROI and Fine Arts have the lowest ROI at 163.3%.
The team also provided data on individual professions for which these majors qualify. The highest-paid engineers appear to be Aerospace engineers, with a whopping 427% ROI on their engineering degrees. Computer and IT Systems Managers with a degree in Computer Science have an even greater ROI, at 553.7%. Although Liberal Arts degrees have the lowest ROIs, there are still significant opportunities available in specific arts-related professions. For example, marketing managers can achieve a 511.4% ROI and earn degrees in Liberal Arts, Fine Arts, or Graphic Design to qualify. Art Directors show strong earning potential within the creative sector, with a 347.9% ROI.
Some might look at this data and conclude that they can aim for some of these careers without a four-year degree. Others might research how much more they would earn in the career path with a four-year degree. Many employers are willing to pay higher salaries to employees with higher levels of education. Some sectors offer student loan forgiveness options, which can help maximize ROI. There’s a public education loan forgiveness program that forgives student loans for teachers who work in low-income school districts for a certain length of time. Borrowers may find more flexible loan solutions from credit unions compared to federal loan systems as well. Data like this is key to helping prospective students plan for the future and achieve the best ROI.
While the data is useful and well-presented, all prospective students should consider several angles when making an important decision, like which major to declare. In addition to ROI, consider your personal instincts, financial circumstances, skills, and potential career satisfaction. While financial security is important and a strong ROI will help you secure it, job satisfaction is an important aspect of future happiness. Even so, Student Choice’s work here can help all prospective students plan for their financial future.
There are many kinds of entrepreneurs in the U.S., from family-owned restaurants to tech startups. The team at Ooma studied data on the ages of business owners in every state, then mapped out the results to identify any regional patterns. As we can see from the map, business ownership aspirations aren’t limited to a certain age. The team used data from the U.S. Census Bureau to create their map and examined major metropolitan areas to determine where the oldest and youngest business owners reside.
Click below to zoom.
The youngest business owners live in Provo-Orem-Lehi, Utah, where the average age of a business owner is a bit below 49. This is lower than the national average by about a decade. Overall, many young entrepreneurs live in Utah. This could be due to the low cost of living and a family-focused culture with plenty of support for younger business owners. Utah’s economic boom surely helps these businesses get off the ground.
These ten cities have the youngest business owners in the country:
- Provo-Orem-Lehi, Utah
- Bozeman, Montana
- Fargo, North Dakota-Minnesota
- Logan, Utah-Idaho
- Ogden, Utah
- George, Utah
- Salt Lake City-Murray, Utah
- Boise City-Idaho
- Lancaster, Pennsylvania
- Kennewick-Richland, Washington
Utah certainly claimed many spots on this list, but we also see that the Rockies and Upper Midwest support a lot of young business owners. University towns and low living costs all help support younger people in gathering the resources to start their own business.
Moving on to the cities with the oldest business owners, we find that Santa Fe, New Mexico, has the oldest business owners, with an average age of around 59 years. Many of the cities topping this list are located in retirement-friendly areas with slower population growth and higher cost of living. This suggests these are more difficult locations to start a small business in, requiring owners to have more resources and experience to get started.
These ten cities have the oldest business owners:
- Santa Fe, New Mexico
- Napa, California
- Monroe, Louisiana
- Kingston, New York
- Urban Honolulu, Hawaii
- Youngstown-Warren, Ohio
- Bridgeport-Stamford-Danbury, Connecticut
- Scranton-Wilkes-Barre, Pennsylvania
- Hilton Head Island-Bluffton-Port Royal, South Carolina
- Trenton-Princeton, New Jersey
According to the national data the team collected, most business owners are in their late 40s to early 50s. This might surprise some people, as the media often reports on bright young entrepreneurs founding exciting tech startups. However, consider that there are many different types of small businesses in America. In most cases, starting a successful business requires resources, time, and connections that can only be acquired through age and experience. In general, the spread of ages isn’t very large, so it seems the team has pinpointed the ideal age to start up a business.
This map can provide valuable insights into the American economy, both by region and as a whole. While the team identified some regional patterns in entrepreneurship, it appears that entrepreneurs across the nation share many commonalities.
There are more than 30 million businesses in the U.S. — but some of those companies employ far more workers than others. Giants like Walmart and Amazon have more than a million employees working on developing, marketing, transporting and selling their products everyday. Meanwhile, lesser-known companies in industries you may not be as familiar with also employ a significant amount of our workforce.
Using Fortune 500 data, our team at The Chartistry identified the largest employers in every industry, including retail, food, health care, real estate and many more (we included a whopping 75 industries total).
Click below to zoom
Who is the largest employer in America?
Technically, the largest employer in the U.S. is the federal government. But if we’re talking about the company that employs the most people, Walmart takes the cake.
Since Walmart’s first store opened in 1962, the company has grown to establish more than 11,500 stores globally to serve more than 260 million weekly shoppers in 28 countries, according to the company’s site. It’s no surprise that the retailer requires a lot of manpower. Walmart has 2,100,000 employees, and is the only one on our list that employs more than 2 million people.
Who else are America’s biggest employers?
Walmart may offer up the most jobs in the U.S.,but there are plenty of other companies with thousands of employees headed to work everyday. Some of the giants on the list of companies with the most employees in every industry are also among the largest U.S. employers in general.
Amazon, which started in Jeff Bezos’ garage in 1994 as an online bookseller, has grown up to make its mark around the world. There’s a good chance you’ve shopped online via the company, watched its streamer or walked past an Amazon retail store or fulfillment center. Amazon may have started with a solo founder, but it now employs 1,525,000 people.
Home Depot is another retail heavyweight. Founded in 1978 as a hardware store, the company now boasts more than 2,300 stores across North America. But offering up all that home improvement requires a lot of hands on deck: The company has 463,100 employees. That makes it the highest employer in one category of specialty retailers, but TJX, with 349,000 employees, is the largest employer in the apparel-specific specialty retailer category.
In the mail, package and freight delivery industry, you can probably guess who employs the most people. It’s FedEx, which was just an idea in 1965 when its eventual founder Frederick W. Smith wrote a paper at Yale University on the potential of a new way to get time-sensitive shipments to recipients (he received an average grade, according to the company’s website). Since then, the company makes around 14.5 million deliveries each day thanks to its 446,400 employees.
UnitedHealth Group also made our list, which makes sense, seeing as its the largest health insurance company in the U.S. Parent company of United Healthcare, the company was founded in 1977. Nowadays, it employs 440,000 people.
Curious which food and drug store is the largest employer? That would be Kroger, which had its start in 1883 when Barney Kroger invested his life savings of $372 to open a single grocery store. More than 140 years later, Kroger is the nation’s largest grocer with nearly 2,800 stores in 35 states and 414,000 employees. But if we’re talking specifically about food services, latte lovers’ favorite place, Starbucks, is the largest employer, with 381,000 employees. Looking specifically at the food consumer products industry, PepsiCo — which owns brands like Lay’s, Doritos, Gatorade, Quaker and, of course, Pepsi — is the largest employer with 318,000 employees.
The travel industry also requires tons of workers. American Airlines Group, which offers thousands of flights daily in more than 60 countries, is the largest employer in the airline industry with 132,100 people. Hilton Worldwide Holdings, meanwhile, has 178,000 employees to help run its hotels, casinos and resorts.
In the entertainment industry, a very familiar name earns the title for largest employer with its 199,125 workers: Walt Disney.
The largest U.S. employers in each industry
Here are the largest companies by employees in every industry — from hotels and airlines to pharmaceuticals and medical equipment.
|
Industry |
Company |
Number of Employees |
|
General Merchandisers |
Walmart |
2,100,000 |
|
Internet Services and Retailing |
Amazon |
1,525,000 |
|
Specialty Retailers: Other |
Home Depot |
463,100 |
|
Mail, Package, and Freight Delivery |
FedEx |
446,400 |
|
Health Care: Insurance and Managed Care |
UnitedHealth Group |
440,000 |
|
Information Technology Services |
Concentrix |
440,000 |
|
Food and Drug Stores |
Kroger |
414,000 |
|
Insurance: Property and Casualty (Stock) |
Berkshire Hathaway |
396,500 |
|
Food Services |
Starbucks |
381,000 |
|
Specialty Retailers: Apparel |
TJX |
349,000 |
|
Food Consumer Products |
PepsiCo |
318,000 |
|
Commercial Banks |
JPMorganChase |
309,926 |
|
Health Care: Medical Facilities |
HCA Healthcare |
265,000 |
|
Diversified Outsourcing Services |
Aramark |
262,550 |
|
Health Care: Pharmacy and Other Services |
CVS Health |
259,500 |
|
Semiconductors and Other Electronic Components Equipment |
Jabil |
236,000 |
|
Computer Software |
Microsoft |
221,000 |
|
Entertainment |
Walt Disney |
199,125 |
|
Motor Vehicles & Parts |
Lear |
186,600 |
|
Telecommunications |
Comcast |
186,000 |
|
Aerospace & Defense |
RTX |
185,000 |
|
Hotels, Casinos, Resorts |
Hilton Worldwide Holdings |
178,000 |
|
Computers, Office Equipment |
Apple |
161,000 |
|
Food Production |
Tyson Foods |
139,000 |
|
Airlines |
American Airlines Group |
132,100 |
|
Pharmaceuticals |
Johnson & Johnson |
131,900 |
|
Real Estate |
CBRE Group |
130,000 |
|
Industrial Machinery |
General Electric |
125,000 |
|
Scientific, Photographic, and Control Equipment |
Thermo Fisher Scientific |
122,000 |
|
Medical Products and Equipment |
Abbott Laboratories |
114,000 |
|
Construction and Farm Machinery |
Caterpillar |
113,200 |
|
Transportation and Logistics |
GXO Logistics |
109,000 |
|
Household and Personal Products |
Procter & Gamble |
107,000 |
|
Network and Other Communications Equipment |
Amphenol |
95,000 |
|
Chemicals |
3M |
85,000 |
|
Diversified Financials |
Marsh & McLennan |
85,000 |
|
Apparel |
Nike |
83,700 |
|
Tobacco |
Philip Morris International |
82,700 |
|
Beverages |
Coca-Cola |
79,100 |
|
Advertising, Marketing |
Omnicom Group |
75,900 |
|
Wholesalers: Food and Grocery |
Sysco |
71,750 |
|
Insurance: Property and Casualty (Mutual) |
State Farm Insurance |
65,054 |
|
Petroleum Refining |
Exxon Mobil |
61,500 |
|
Financial Data Services |
Fidelity National Information Services |
60,000 |
|
Wholesalers: Diversified |
Genuine Parts |
60,000 |
|
Electronics, Electrical Equipment |
Whirlpool |
59,000 |
|
Oil And Gas Equipment, Services |
Baker Hughes |
58,000 |
|
Packaging And Containers |
WestRock |
56,100 |
|
Securities |
Edward Jones |
54,000 |
|
Engineering and Construction |
Quanta Services |
52,500 |
|
Home Equipment, Furnishings |
Stanley Black & Decker |
50,500 |
|
Waste Management |
Waste Management |
48,000 |
|
Wholesalers: Health Care |
McKesson |
48,000 |
|
Insurance: Life, Health (Stock) |
MetLife |
45,000 |
|
Trucking, Truck Leasing |
J.B. Hunt Transport Services |
34,718 |
|
Toys, Sporting Goods |
Mattel |
33,000 |
|
Railroads |
Union Pacific |
32,973 |
|
Metals |
Nucor |
32,000 |
|
Automotive Retailing, Services |
CarMax |
30,621 |
|
Building Materials, Glass |
Builders FirstSource |
29,000 |
|
Utilities: Gas and Electric |
PG&E |
28,010 |
|
Wholesalers: Electronics and Office Equipment |
TD Synnex |
28,000 |
|
Temporary Help |
Manpower Group |
27,900 |
|
Mining, Crude-Oil Production |
Freeport-McMoRan |
27,200 |
|
Equipment Leasing |
United Rentals |
26,300 |
|
Publishing, Printing |
News Corp. |
25,000 |
|
Miscellaneous |
Service Corporation International |
21,267 |
|
Transportation Equipment |
Polaris |
18,500 |
|
Energy |
NRG Energy |
18,131 |
|
Education |
Graham Holdings |
17,006 |
|
Insurance: Life, Health (Mutual) |
TIAA |
16,023 |
|
Pipelines |
Energy Transfer |
13,786 |
|
Homebuilders |
D.R. Horton |
13,450 |
|
Forest and Paper Products |
Domtar |
13,000 |
|
Shipping |
Kirby Corporation |
5,450 |
Don’t miss our other visuals (Chartistry Originals) that give insight into some of the biggest employers in the U.S, including our map of the biggest Fortune 500 companies in every state, breakdown of America’s most valuable companies ranked by profit per employee and original chart of everything owned by Apple.
Source:
-

 Business Visualizations9 months ago
Everything Owned by Apple
-

 Business Visualizations8 months ago
America’s Most Valuable Companies Ranked by Profit per Employee
-

 Business Visualizations2 months ago
The Biggest Employers by Industry
-

 Business Visualizations4 months ago
The Biggest Fortune 500 Company in Every State
-
 Timelines1 year ago
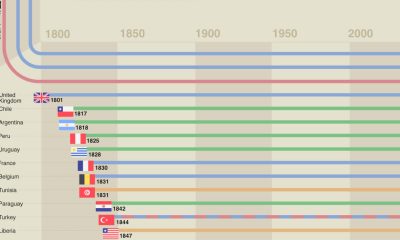
A History of the Oldest Flags in the World
-
 Maps1 year ago
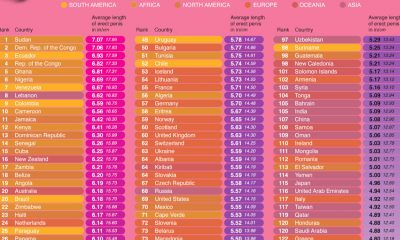
Penis Lengths Around the World
-
 Business Visualizations2 years ago
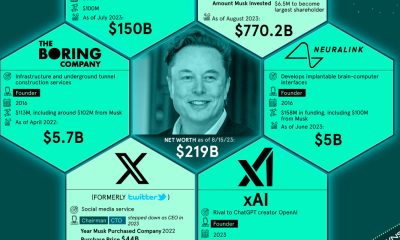
How Many Companies Does Elon Musk Own?
-
 Charts2 years ago
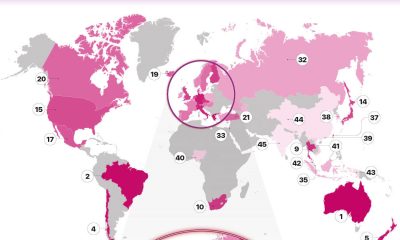
The Most Promiscuous Countries in the World