Business Visualizations
Key Statistics Help Us Understand Customer Churn

Customers have an abundance of choice in all industries these days. When customers switch to a new option, companies call this “customer churn.” Customer churn can be a major detriment to business. In nearly every industry, loyal repeat customers can make or break a business. The team at Qualtrics helps us understand the state of customer churn in the past year with 30 key statistics illustrating the landscape. They took a well-rounded approach to their research, using facts that reveal how many customers are leaving, which industries have high churn, and other factors that help us understand why customer churn happens and how to prevent it.
Click below to zoom.
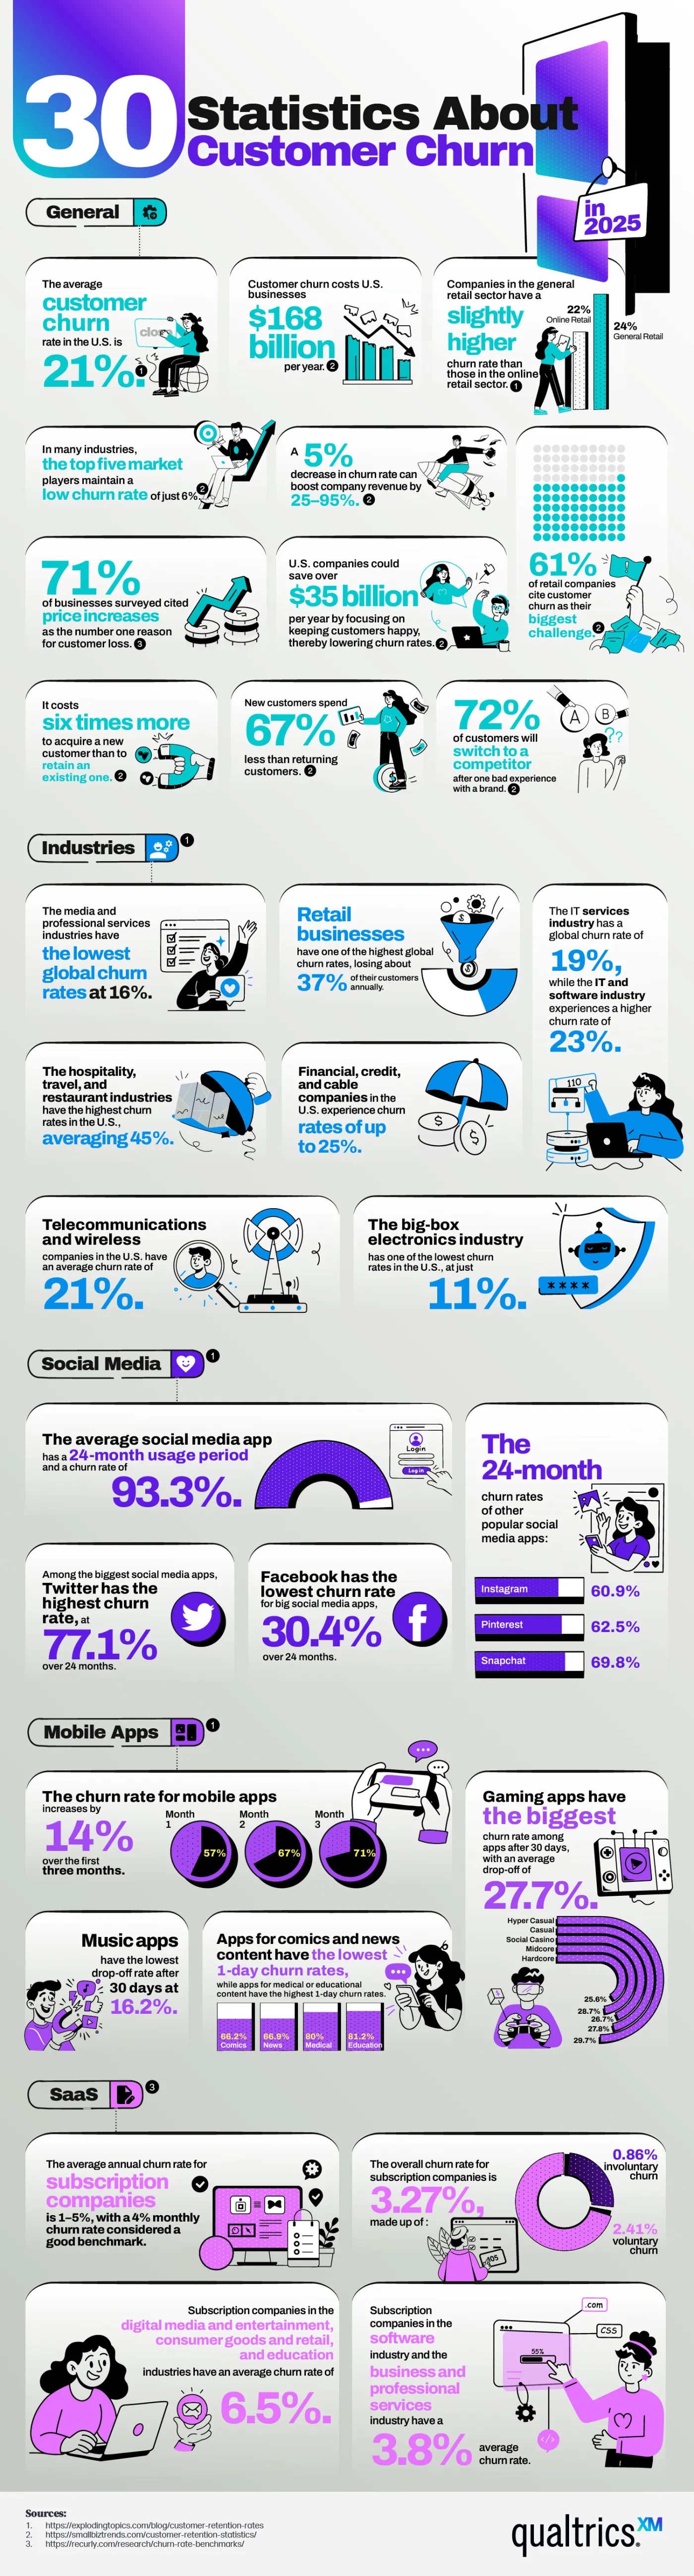
Customer churn gives businesses a way to quantify how well they’re retaining customers. Churn rate is calculated by dividing the number of customers lost over a set period of time by the total number of customers at the start of that period. This calculation yields the number of customers who didn’t return to do business. High churn rates often signal poor retention strategies or a mismatch between what customers expected and received. We can’t underestimate competitor appeal, though. The team’s data shows that 71% of businesses list price increases as their number one reason for losing customers.
The data make it clear that churn rates vary widely across industries. 61% of retail companies say churn rates are one of the biggest challenges in their quest for success. This could be due to the high level of competition and vastly different prices found in the retail sector. Financial, cable, and credit companies experience high churn rates too, around 25%. We can conclude that spending and saving may have the greatest impact on churn, based on industry rates. The big-box electronics industry only has an 11% churn rate, possibly due to fewer choices, but it may have stronger brand loyalty. For example, you’ll rarely see an X-Box fan make the switch to PlayStation. Speaking of the gaming space, apps don’t enjoy the same low churn rate as consoles might. With a 27.7% churn rate, many people give up on gaming apps and try something new after 30 days.
Data might point the way to solutions to reduce customer churn. We can see subscription-based companies with an exceptionally low churn rate of 3.27%. Software and business subscriptions have lower churn rates than digital media and entertainment subscriptions, but they are still among the lowest we’re seeing. A subscription-based service works hard to keep its subscribers, so maybe other types of businesses could learn something from its strategies. For example, social media apps have an enormous churn rate of 93.3% over 24 months. It’s clear that whatever value customers hoped to get from the platform didn’t materialize.
This information-rich graphic leaves us with a lot to think about. By comparing churn rates across industries, we can reflect on key differences that affect these numbers. Perhaps the most important statistic to hold on to is that U.S. companies could save over $35 billion per year by reducing their churn rates.