Business Visualizations
The Largest Companies in America That Are Still Run by the Person Who Founded Them
In the corporate world, leadership changes are practically expected. CEOs come and go, boards shuffle seats, and strategies pivot with the seasons. For most large corporations, the founding vision eventually gives way to the influence of successors, but every once in a while, a company manages to scale the peaks of the Fortune 1000 while still being led by the very person who dreamed it up in the first place.
Going from running a business out of your garage to managing a multi-billion-dollar operation requires an impressive mix of genius, grit, and endurance that most would struggle to sustain across decades of board meetings, bold bets, and bottom-line pressure.
So, what does it take to build a business worth billions and still be the one calling the shots? To find out, our team at The Chartistry has pulled together a graphic that maps out the largest companies in the U.S. that are still being run by the same people who started them.
Click below to zoom.
Tech Giants Still Calling the Shots
The tech industry can be a volatile market, especially when billions of dollars are at stake every year, making founder-CEOs in this space a rare species. Mark Zuckerberg, founder and CEO of Facebook (now Meta), is a headline example. From the scrappy days of coding in his Harvard dorm to overseeing Meta’s $134.9 billion revenue machine, he hasn’t let go of the reins. His company now ranks 30th on the Fortune 1000 list, but it continues to operate under the umbrella of Zuckerberg’s vision.
Jensen Huang of NVIDIA is another powerhouse. He co-founded the company in 1993 and continues to lead it as CEO and President. NVIDIA is now a central player in the AI boom, raking in over $60.9 billion in 2024. The company landed at #65 on the Fortune list, and much of that momentum can be traced back to Huang’s technical savvy and leadership style.
Another founder-CEO of a big tech company is Michael Dell. After founding Dell Technologies in 1984, Dell stepped away briefly before returning to steer the company through its privatization and subsequent return to public markets. With $88.43 billion in revenue, it holds spot #48 on the list.
Long-Hauler Founders of the Biggest U.S. Companies
Wall Street can be brutal, yet some of the longest-tenured company founders make the ranks in this industry. Richard Fairbank has run Capital One since 1987, long before online banking was the norm. Under his leadership, the company pulled in $49.48 billion last year.
Larry Fink’s story is equally impressive. He co-founded BlackRock in 1988 and helped turn it into the world’s largest asset manager. It now generates $17.86 billion annually.
Then there’s Mark Millett, who co-founded Steel Dynamics in 1993. It might not make splashy headlines like tech and finance, but this steel manufacturer generated $18.8 billion last year, proving that innovation can lead to immense success in any space.
Is Elon Musk Actually the Founder of Tesla?
Elon Musk is arguably the most high-profile figure on the list, but his relationship with Tesla’s origins is less straightforward than the others on our list. Tesla was actually founded by Martin Eberhard and Marc Tarpenning in 2003. Musk joined shortly after as an investor and took a more active role over time. It wasn’t until a legal settlement in 2009 that Musk was “officially” determined to be a co-founder, along with four others. Today, he serves as the CEO and public face of Tesla, a company that posted $96.77 billion in revenue in 2024.
Why Are They Still Here?
While circumstances vary and some CEO-Founders stick around long after what’s best for the company, research seems to support that many of them remain the right person for the job. A Harvard Business Review study found that companies led by their founders outperformed others in market valuation by 10% over the long term. Especially in the early days when the potential rewards are higher, founders tend to prioritize innovation, take bigger strategic bets, and maintain a stronger emotional commitment to the company’s mission.
Additionally, founder-CEOs often make faster decisions, have deeper customer intuition, and are more adaptable when navigating new markets. These traits help fuel long-term growth and can serve as a stabilizing force in times of disruption. That said, success depends on their ability to scale alongside the business. The most effective founders seem to grow their leadership style as the company matures, surrounding themselves with experienced teams while staying grounded in the original vision.
In many cases, large companies will also adopt dual-class stock structures, which help founders maintain some control even as ownership becomes more distributed.
Out of the 1,000 biggest companies in America, only 59 are still run by their founders. Amounting to less than 6 percent, it’s both inspiring and daunting how successful many of their companies have become.
Along with shaping industries and building legacies, they’re keeping their original visions alive in a world that often trades the leadership of innovative founders for business-savvy executives. Their stories serve as a reminder that leadership is about commitment and conviction as much as it is about keeping a business running.
At The Chartistry, we know that there’s a great story behind every dataset. Explore more trends in executive leadership, company growth, and market innovation in America’s largest companies on our Business Visualization page. Or, if you’re looking for more inspiring stories of success, check out our Finance Visualizations.
Founders of Major Corporations Still Serving as CEO
The list of America’s largest companies that are still run by the person who founded them is based on data from Fortune’s list of the 1,000 biggest companies in the United States. Just 59 of the 1,000 biggest U.S. companies are still run by the person who founded them. The founder must be the current Chief Executive Officer (CEO) of the company, as of June 2025, to be included.
| Rank | Company | Forbes 1000 Rank (as of July 2024) |
Revenue in Billions (as of July 2024) |
CEO Name | Year Founded | Title (as of June 2025) |
| 1 | Meta Platforms | 30 | $134.90 | Mark Zuckerberg | 2004 | Co-Founder, CEO, Chairman |
| 2 | Tesla | 40 | $96.77 | Elon Musk | 2003 (Musk was designated as one of five co-founders in 2009 via a settlement.) |
Co-Founder, CEO |
| 3 | Dell Technologies | 48 | $88.43 | Michael Dell | 1984 | Founder, CEO, Chairman |
| 4 | NVIDIA | 65 | $60.92 | Jensen Huang | 1993 | Co-Founder, CEO, President |
| 5 | Capital One Financial | 91 | $49.48 | Richard Fairbank | 1987 | Co-Founder, CEO, Chairman |
| 6 | Salesforce | 123 | $34.86 | Marc Benioff | 1999 | Co-Founder, CEO, Chairman |
| 7 | Apollo Global Management | 136 | $32.64 | Marc Rowan | 1990 | Co-Founder, CEO, Chairman |
| 8 | Coupang | 168 | $24.38 | Bom Kim | 2010 | Founder, CEO, Chairman |
| 9 | Block | 186 | $21.92 | Jack Dorsey | 2009 | Co-Founder, CEO, Chairman |
| 10 | Steel Dynamics | 221 | $18.80 | Mark Millett | 1993 | Co-Founder, CEO, Chairman |
| 11 | BlackRock | 231 | $17.86 | Larry Fink | 1988 | Co-Founder, CEO, Chairman |
| 12 | Regeneron Pharmaceuticals | 311 | $13.12 | Leonard Schleifer | 1988 | Co-Founder, CEO, President, Co-Chairman |
| 13 | Wayfair | 346 | $12.00 | Niraj Shah | 2002 | Co-Founder, CEO, Co-Chairman |
| 14 | Carvana | 377 | $10.77 | Ernest Garcia III | 2012 | Co-Founder, CEO, President, Chairman |
| 15 | Airbnb | 396 | $9.92 | Brian Chesky | 2008 | Co-Founder, CEO |
| 16 | Intercontinental Exchange | 397 | $9.90 | Jeffrey Sprecher | 2000 | Founder, CEO, Chairman |
| 17 | Sanmina | 433 | $8.94 | Jure Sola | 1980 | Co-Founder, CEO, Chairman |
| 18 | DoorDash | 443 | $8.64 | Tony Xu | 2013 | Co-Founder, CEO |
| 19 | Prologis | 463 | $8.02 | Hamid Moghadam | 1983 | Co-Founder, CEO, Chairman |
| 20 | Blackstone | 464 | $8.02 | Stephen Schwarzman | 1985 | Co-Founder, CEO, Chairman |
| 21 | Skechers U.S.A. | 465 | $8.00 | Robert Greenberg | 1992 | Founder, CEO, Chairman |
| 22 | Super Micro Computer | 498 | $7.12 | Charles Liang | 1993 | Co-Founder, CEO, Chairman, President |
| 23 | Insperity | 541 | $6.49 | Paul Sarvadi | 1986 | Co-Founder, CEO, Chairman |
| 24 | Under Armour | 577 | $5.90 | Kevin Plank | 1995 | Founder, CEO, Chairman, President |
| 25 | SS&C Technologies Holdings | 600 | $5.50 | William Stone | 1986 | Founder, CEO, Chairman |
| 26 | Fortinet | 622 | $5.31 | Ken Xie | 2000 | Founder, CEO, Chairman |
| 27 | Urban Outfitters | 635 | $5.15 | Richard Hayne | 1970 | Co-Founder, CEO, Chairman |
| 28 | Ares Management | 644 | $4.99 | Michael Arougheti | 1997 | Co-Founder, CEO, Director |
| 29 | Nexstar Media Group | 648 | $4.93 | Perry Sook | 1996 | Founder, CEO, Chairman |
| 30 | Compass | 654 | $4.89 | Robert Reffkin | 2012 | Co-Founder, CEO |
| 31 | EPAM Systems | 669 | $4.69 | Arkadiy Dobkin | 1993 | Co-Founder, CEO, Chairman, President |
| 32 | Antero Resources | 670 | $4.68 | Paul Rady | 2002 | Co-Founder, CEO, Chairman, President |
| 33 | Snap | 679 | $4.61 | Evan Spiegel | 2011 | Co-Founder, CEO, Director |
| 34 | Zoom Video Communications | 683 | $4.53 | Eric Yuan | 2011 | Founder, CEO, Chairman, President |
| 35 | Rivian Automotive | 692 | $4.43 | RJ Scaringe | 2009 | Founder, CEO |
| 36 | PriceSmart | 697 | $4.41 | Robert Price | 1993 | Co-Founder, CEO (until Sept. ‘25), Chairman |
| 37 | eXp World Holdings | 708 | $4.28 | Glenn Sanford | 2008 | Founder, CEO, Chairman |
| 38 | Toast | 766 | $3.87 | Aman Narang | 2012 | Co-Founder, CEO, Director |
| 39 | Akamai Technologies | 771 | $3.81 | Dr. Tom Leighton | 1998 | Co-Founder, CEO |
| 40 | ScanSource | 776 | $3.79 | Michael Baur | 1992 | Co-Founder, CEO, Chairman |
| 41 | Dream Finders Homes | 784 | $3.75 | Patrick Zalupski | 2008 | Co-Founder, CEO, Chairman, President |
| 42 | Century Communities | 794 | $3.69 | Robert Francescon | 2002 | Co-Founder, CEO, President, Director |
| 43 | Euronet Worldwide | 796 | $3.69 | Michael Brown | 1994 | Co-Founder, CEO, Chairman, President |
| 44 | DraftKings | 798 | $3.67 | Jason Robins | 2011 | Co-Founder, CEO, Chairman |
| 45 | Atlassian | 811 | $3.54 | Mike Cannon-Brookes | 2002 | Co-Founder, CEO |
| 46 | Roku | 820 | $3.49 | Anthony Wood | 2002 | Founder, CEO, Chairman |
| 47 | Cheesecake Factory | 828 | $3.44 | David Overton | 1972 | Co-Founder, CEO, Chairman |
| 48 | Chefs’ Warehouse | 830 | $3.43 | Christopher Pappas | 1985 | Co-Founder, CEO, Chairman, President |
| 49 | AppLovin | 847 | $3.28 | Adam Foroughi | 2012 | Co-Founder, CEO, Chairman |
| 50 | PACS Group | 869 | $3.11 | Jason Murray | 2013 | Co-Founder, CEO, Chairman |
| 51 | Coinbase Global | 870 | $3.11 | Brian Armstrong | 2012 | Co-Founder, CEO, Chairman |
| 52 | CrowdStrike | 883 | $3.06 | George Kurtz | 2011 | Founder, CEO |
| 53 | Matador Resources | 930 | $2.81 | Joseph Wm. Foran | 2003 | Founder, CEO, Chairman |
| 54 | Viasat | 932 | $2.80 | Mark Dankberg | 1986 | Co-Founder, CEO, Chairman |
| 55 | Roblox | 935 | $2.80 | David Baszucki | 2004 | Co-Founder, CEO |
| 56 | ProFrac Holding | 971 | $2.63 | Ladd Wilks | 2016 | Co-Founder, CEO |
| 57 | Playtika Holding | 982 | $2.57 | Robert Antokol | 2010 | Co-Founder, CEO, Chairman |
| 58 | Stagwell | 993 | $2.53 | Mark Penn | 2021 | Founder, CEO, Chairman |
| 59 | Dropbox | 997 | $2.50 | Drew Houston | 2007 | Co-Founder, CEO |
Sources:
Corporate Websites


Student Choice has published the 2026 updated version of its study, ranking the most popular college degrees by return on investment after five years in the workforce. The team’s premise is timely as they examine a hot topic: the cost of higher education. The average cost of college now exceeds $43,000 per year, so entering the workforce with these student loans became a high-stakes game. The analysis pairs the top 25 majors in 2026, based on a previous Student Choice study, with earnings data from the U.S. Bureau of Labor Statistics to calculate how much a graduate earns in their first five years relative to their four-year tuition investment. They illustrated their findings by ranking 20 degree types compared to 40 common occupations.
Click below to zoom.
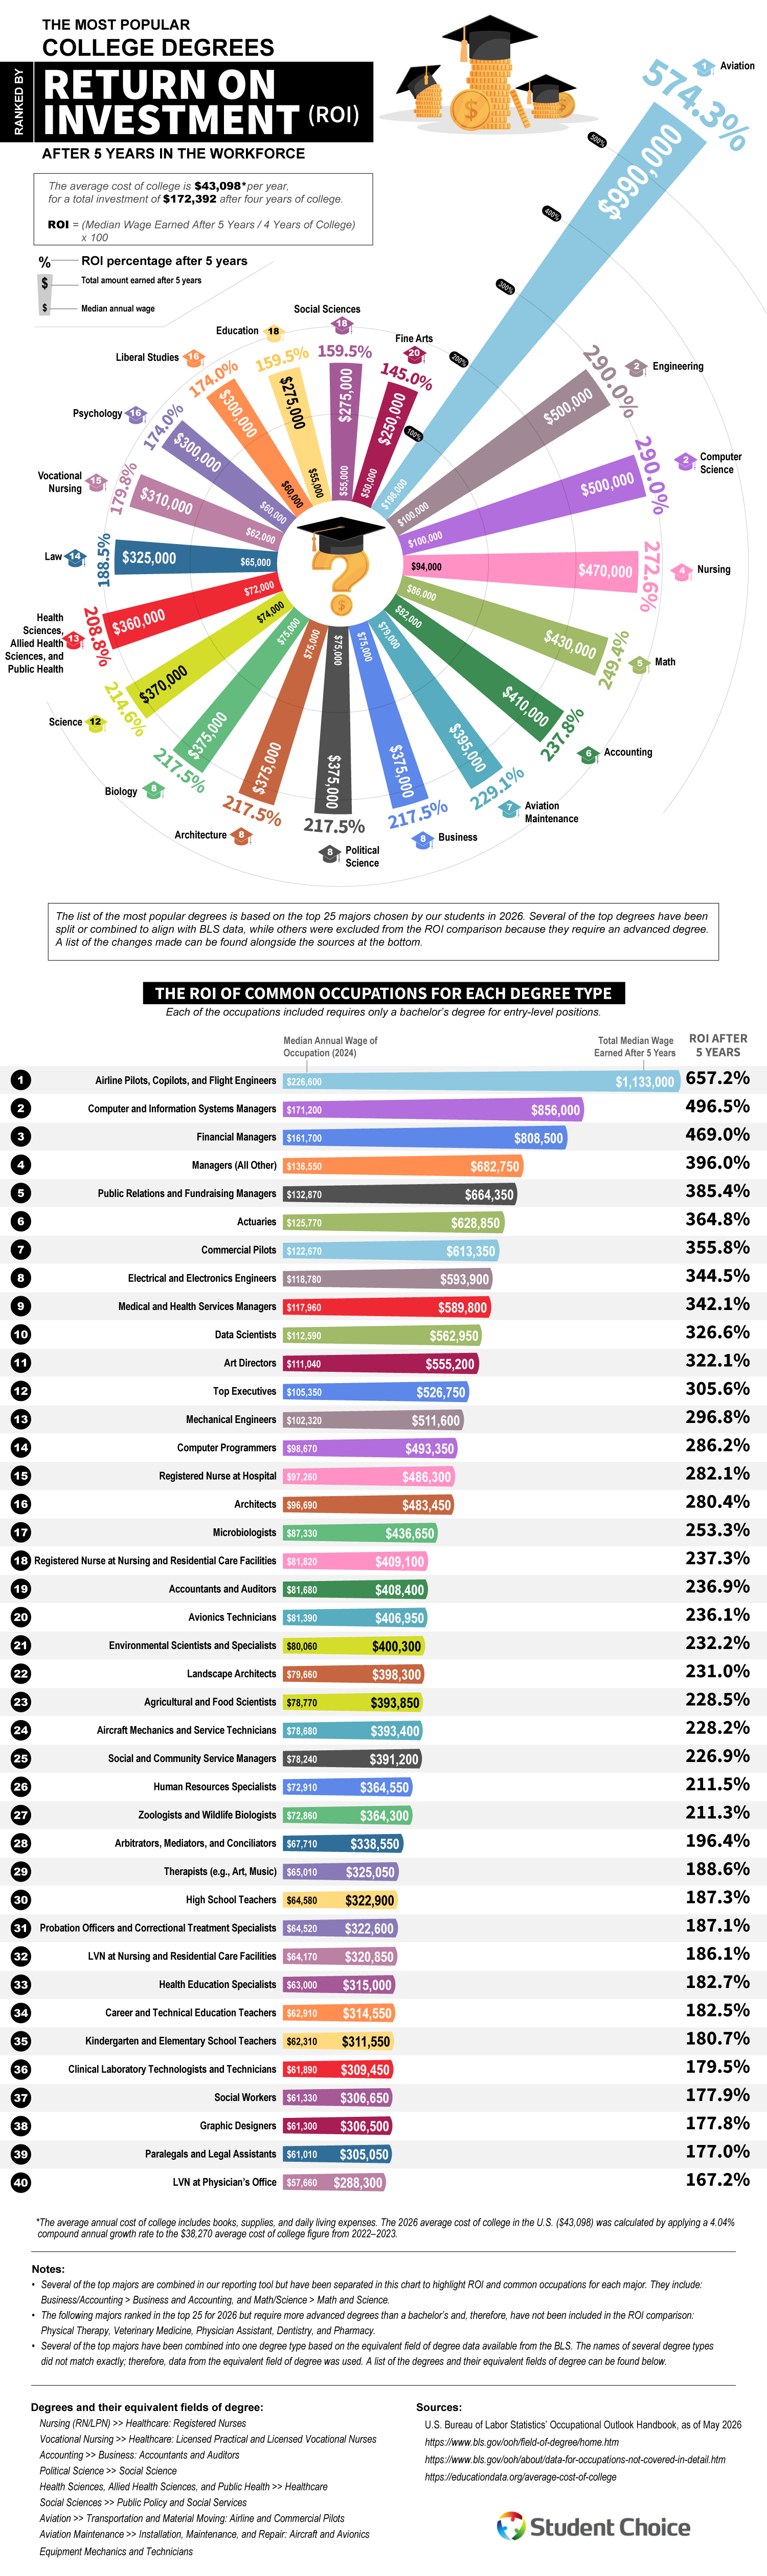
The team used a simple methodology. The average cost of college is $43,098 per year for a total investment of $172,392 for four years, with ROI calculated as median wages earned over five years divided by the four-year college cost. Majors that require advanced degrees like physical therapy, veterinary medicine, physician assistant, dentistry, and pharmacy were excluded from the ROI comparison even though these majors rank in the top 25.
Aviation tops the rankings chart, claiming the leading spot by a wide margin because of its astounding 574.3% ROI after five years, boosted by the median annual wage of $198,000. The field’s popularity is likely due to high pay and a looming pilot shortage as veteran airline workers retire. Engineering and computer science tied for second place at 290% each with median wages of $100,000 a year.
Healthcare and quantitative fields round out the upper tier. Nursing ranks fourth with an ROI of 272.6%, followed by math at 249.4% and accounting at 237.8%. Business, political science, architecture, and biology all tie for eighth at 217.5%, based on a $75,000 median wage. Education and social sciences sit near the bottom of the list at 159.5%, and fine arts at the bottom at 145%.
The study’s most helpful section might be the table that shows how career choice within a major can dramatically outperform the degree’s baseline. Aviation graduates who became airline pilots, copilots, or flight engineers reached a 652.7% return on a median wage of $226,600. Computer and information systems managers hit 496.5%, financial managers reached 469%, and public relations and fundraising managers reached 385.4%. Even lower-ranked majors can have exceptions. For example, fine arts majors who become art directors have a 322.1% return with a median salary of $111,040. Math majors working as actuaries earn 364.8%.
Overall, though, this study shows us that getting a degree pays off. Even accounting for student debt, the data suggests that degrees can double or triple the initial investment within five years. While most people will work for about four decades after student life, the returns will continue to compound. There is a growing preference for specialized, career-focused degrees with clear pathways into established professions so students can enjoy the ROIs we see here.
Student Choice has released the 206 updated version of its ongoing study tracking how America’s most popular college majors have changed over time. The analysis drew data from 105,623 student loan applications, using them as a proxy for where students are placing their bets on their future. The idea is that a student’s choice of major reveals more than their individual preferences. They can reflect labor shortages, salary expectations, emerging technologies, and shifting cultural attitudes about which degrees are most valuable. The team also supplied a graph comparing today’s top majors with those from four and eight years ago.
Click below to zoom.
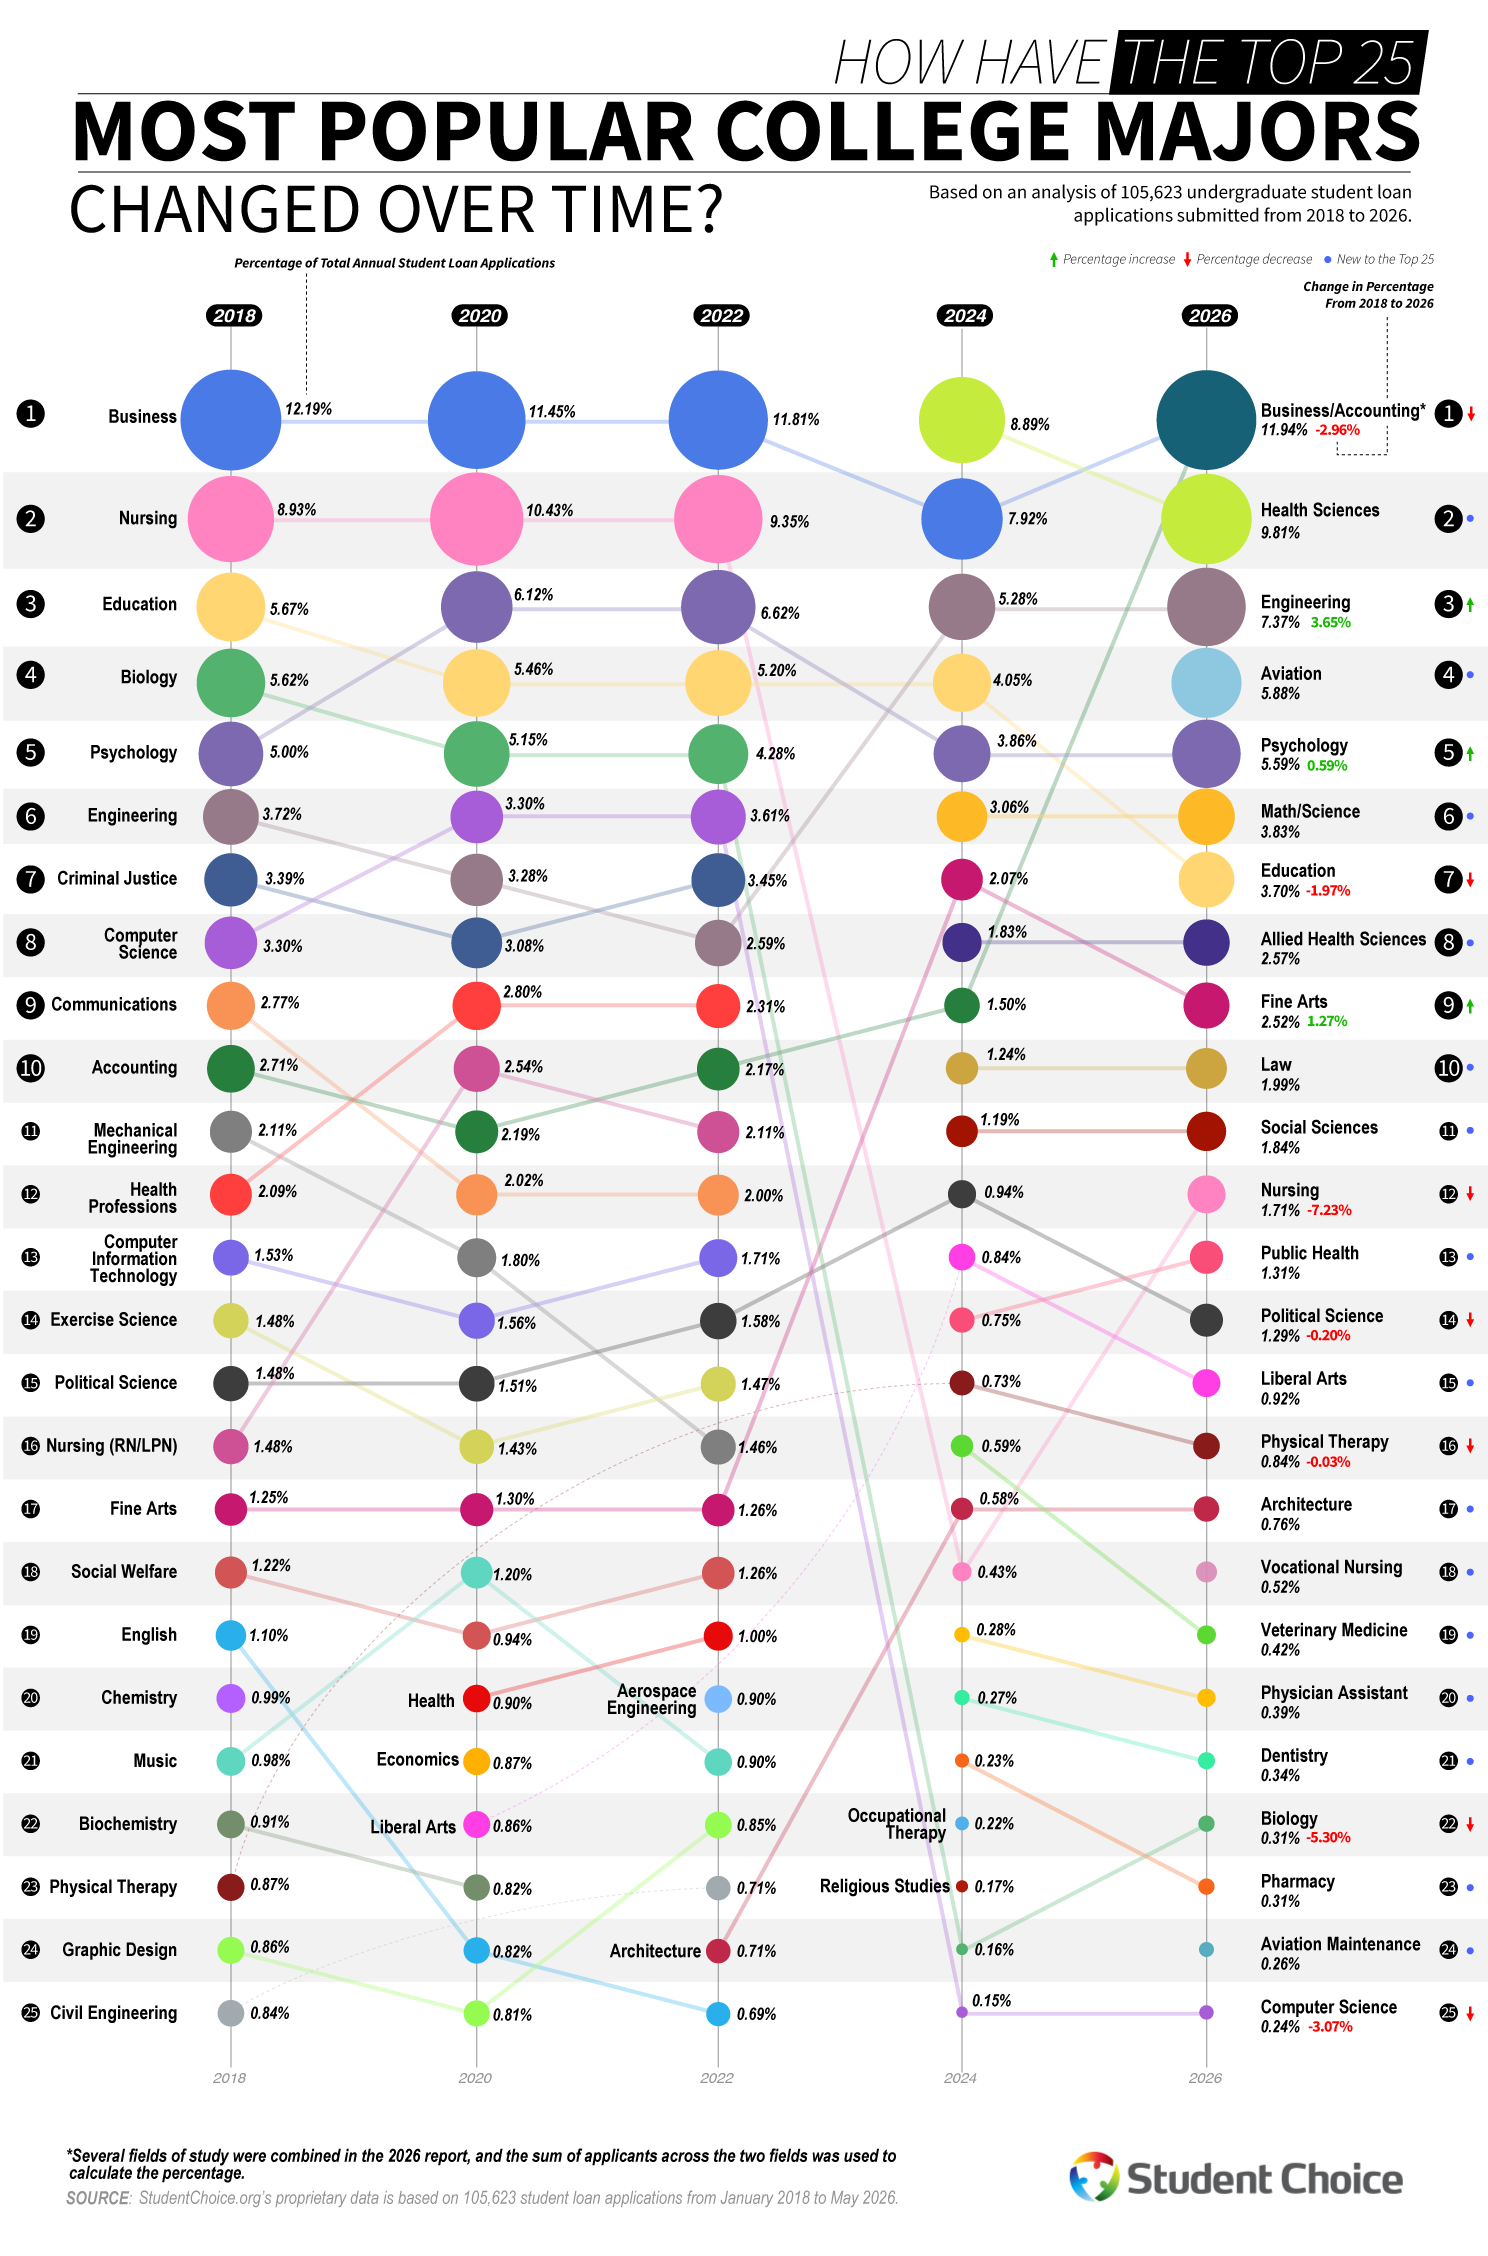
There has been a lot of disruption in recent years, but business majors have held steady. Business has been the leading major commanding between 11.45% and 12.81% of applications in 2017 and 2023. But that dominance has wobbled. In 2025, only 5.27% of applications were for a business major, but that percentage spiked back up in 2026 to 11.94%, still making it the most popular major.
Healthcare was consistently a top-two major for years, peaking in 2023 at 10.87% of applications. Now, nursing has tumbled to just 1.71% of applications in 2026. Health sciences replaced it to turn 9.81% with allied health sciences, public health, physical therapy, physician assistant studies, dentistry, and pharmacy, all landing in the top 25 of most popular majors.
The biggest growth seen in the study is in engineering and aviation. Engineering climbed from 3.91% to 7.37% in 2026. A 3.46-point gain is one of the biggest increases in this dataset. Aviation didn’t crack the top 25 of majors until 2025, when it had explosive growth, then settled into fourth place in 2026 at 5.88%. The surge in aviation maintenance rankings points to broader interest in the field, likely inspired by well-documented pilot shortages. When there’s a need, hungry young students will step up to fill it.
Psychology enjoyed modest and steady growth, inching from 4.99% in 2017 to 5.59% in 2026. Computer science took a surprising fall from a rising 3.61% to only .24% in 2026, ranking dead last in the top 25. Student Choice believes this could be due to some reporting category changes in 2025, but also speaks to the volatility of the tech job market.
Liberal arts and education lost ground, with education sliding from 5.99% of applications in 2017 to 3.70% in 2026. This decline is linked to teaching wages failing to keep up with other fields. Communications, English, and History all dropped off the top 25 entirely, yet Fine Arts bucked the trend, doubling in popularity from 1.35% to 2.25%, cracking the top ten most popular majors.
Overall, students are becoming more specialized and career-focused, drawn to healthcare, engineering, and aviation, while retreating from generalist majors and degrees that were once safe bets. The team at Student Choice cites finances as one of the biggest concerns central to a student’s decision on what major they choose
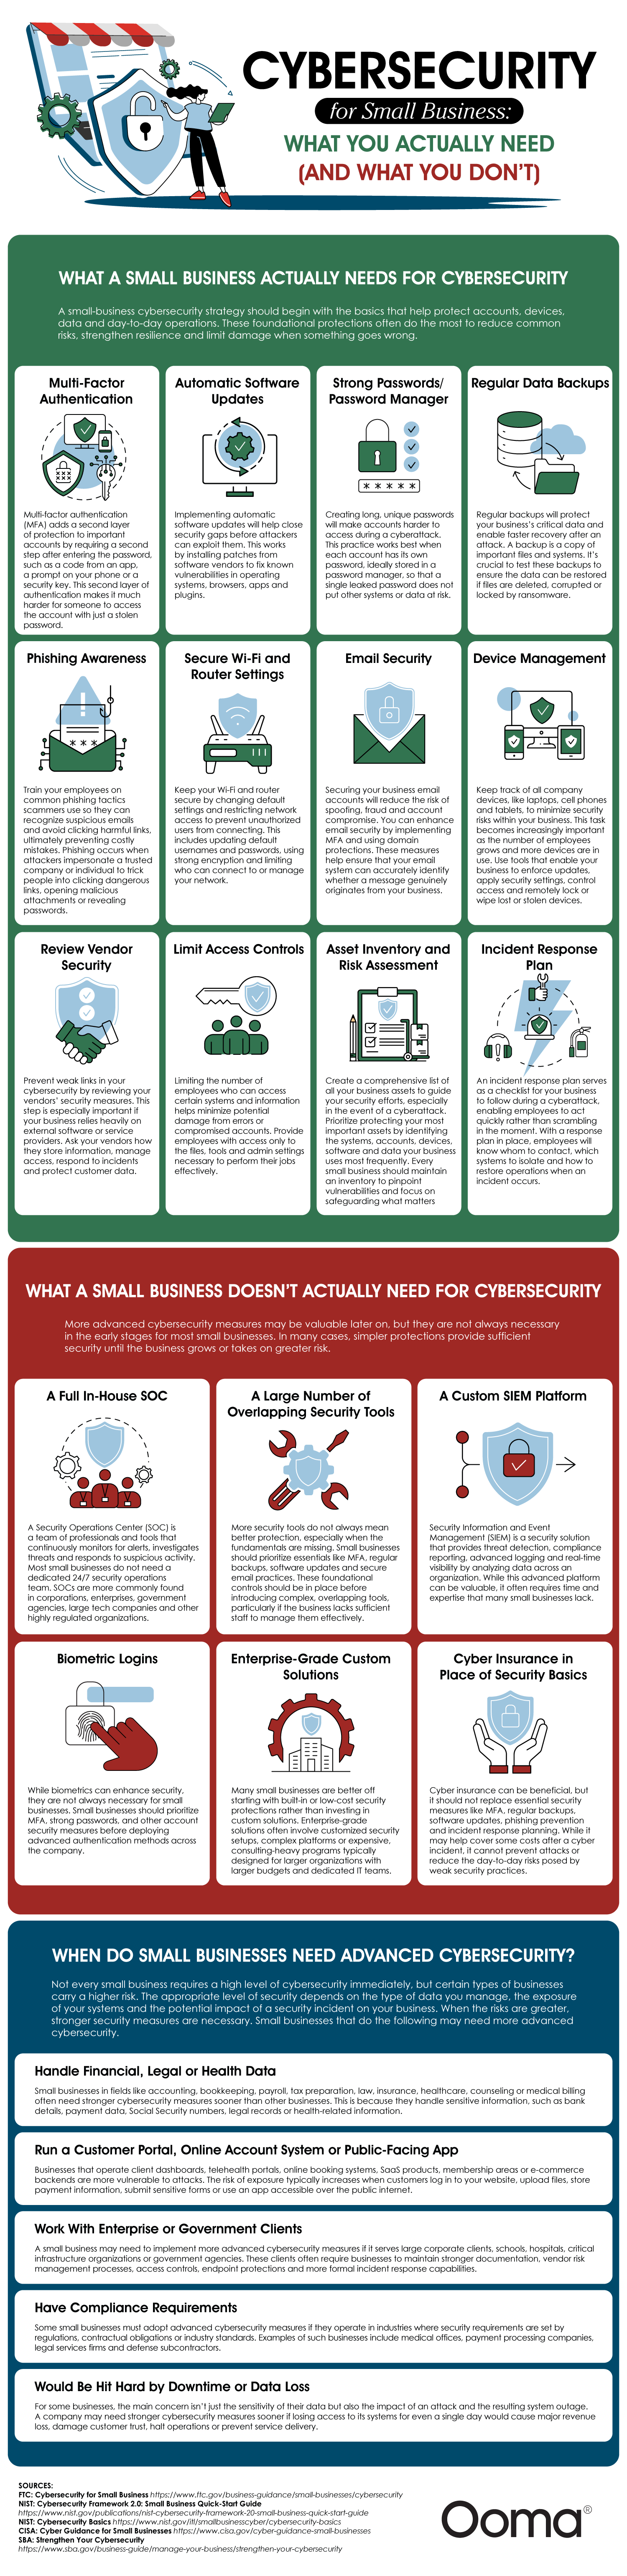
Small business owners wear many hats, but cybersecurity has slowly become one of the largest and flashiest hats. Ooma created a cybersecurity guide for small business owners, presented in a detailed chart that tackles a problem most owners face, but few know how to navigate. They struggle to figure out which protections really matter and which investments are simply expensive noise. The stakes are real. The team’s data show that 67% of businesses report more cyberattacks in 2024, and more than 40% of attacks target small businesses specifically. The team’s core message is one of hope: the basics of cybersecurity are far simpler than the security industry makes them seem.
Click below to zoom.
What Owners Really Need
The team’s suggestions are organized into a clear checklist. Multi-factor authentication tops the list as the single most effective tactic small businesses should use. It requires a second verification step after the typical password. From there, the list includes automatic software updates to patch security updates, strong passwords, and regular data backups that are tested so ransomware can’t hold operations hostage.
The human layer gets equal consideration. Training staff to spot phishing emails, limiting system access to only those who need it, and managing company devices with the ability to remotely lock them or wipe misplaced phones and laptops are all important guidelines. Rounding out the list are secure Wi-Fi and router settings, email protections, vendor security reviews, asset inventories, and a written incident response plan that guides employees on how to respond rather than scrambling during a cyberattack.
The Steps You Can Skip
The guide stands out from other security content in this section. It doesn’t shy away from naming the protections most small businesses are oversold. They name a full in-house Security Operations Center, custom SIEM platforms, and overlapping tools as the most unnecessary. Biometric logins and enterprise-grade custom solutions are labeled as answers to problems that don’t exist at the scale of a small business. Cyber insurance was a solid maybe that could be useful, but no substitute for backups and multi-factor authentication.
Situations That Call for Advanced Security
The article doesn’t label cybersecurity as one-size-fits-all. They list businesses in the financial, legal, and health data sectors as needing advanced cybersecurity, which could include customer portals, telehealth systems, and e-commerce backends. Not only are these data types subject to privacy laws, but when these systems go down, businesses can pay a heavy toll, so stronger defenses are worth the investment.
The team’s overall message is that cybersecurity isn’t all-or-nothing. Small businesses should build a solid foundation and scale up only when risk and growth push them to do so. Some of the guide’s authoritative sources include the FTC, NIST, CISA, and SBA. The guide makes cybersecurity feel manageable for small businesses by focusing on practical steps instead of expensive extras. Strong passwords, backups, training, and multi-factor authentication create a reliable foundation. As risks grow, businesses can add advanced protections, but the smartest first move is mastering the basics.
-

 Business Visualizations2 years ago
Everything Owned by Apple
-

 Business Visualizations2 years ago
America’s Most Valuable Companies Ranked by Profit per Employee
-

 Business Visualizations1 year ago
The Biggest Fortune 500 Company in Every State
-

 Business Visualizations1 year ago
The Biggest Employers by Industry
-

 Charts2 years ago
Map Uncovers Countries with Most Powerful Passports
-

 Timelines2 years ago
Timeline Charts the Development of Communications Technology
-

 Maps2 years ago
A Map to Gold and Silver
-
 Timelines2 years ago
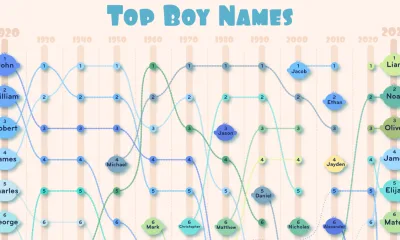
The Evolution of Baby Names: A Century of Trends