
Maps
The Places in the United States With the Worst Mental Health, Mapped

“Whether an illness affects your heart, your leg or your brain, it’s still an illness, and there should be no distinction. It’s time to tell everyone who’s dealing with a mental health issue that they’re not alone, and that getting support and treatment isn’t a sign of weakness, it’s a sign of strength.” ~ Michelle Obama
More than half of people with mental illness do not receive help for their struggles. This is greatly influenced by the stigma, prejudice, and discrimination that is prevalent in many societies and communities. A 2016 study on mental health stigma concluded that “there is no country, society or culture where people with mental illness have the same societal value as people without mental illness.” America is no exception, although the severity varies across regions. While stigma is not the sole cause of people struggling with mental illness, it certainly contributes to it. The team at Charlotte’s Web has created an insightful visualization of where people in the United States have the poorest mental health.
Click below to zoom
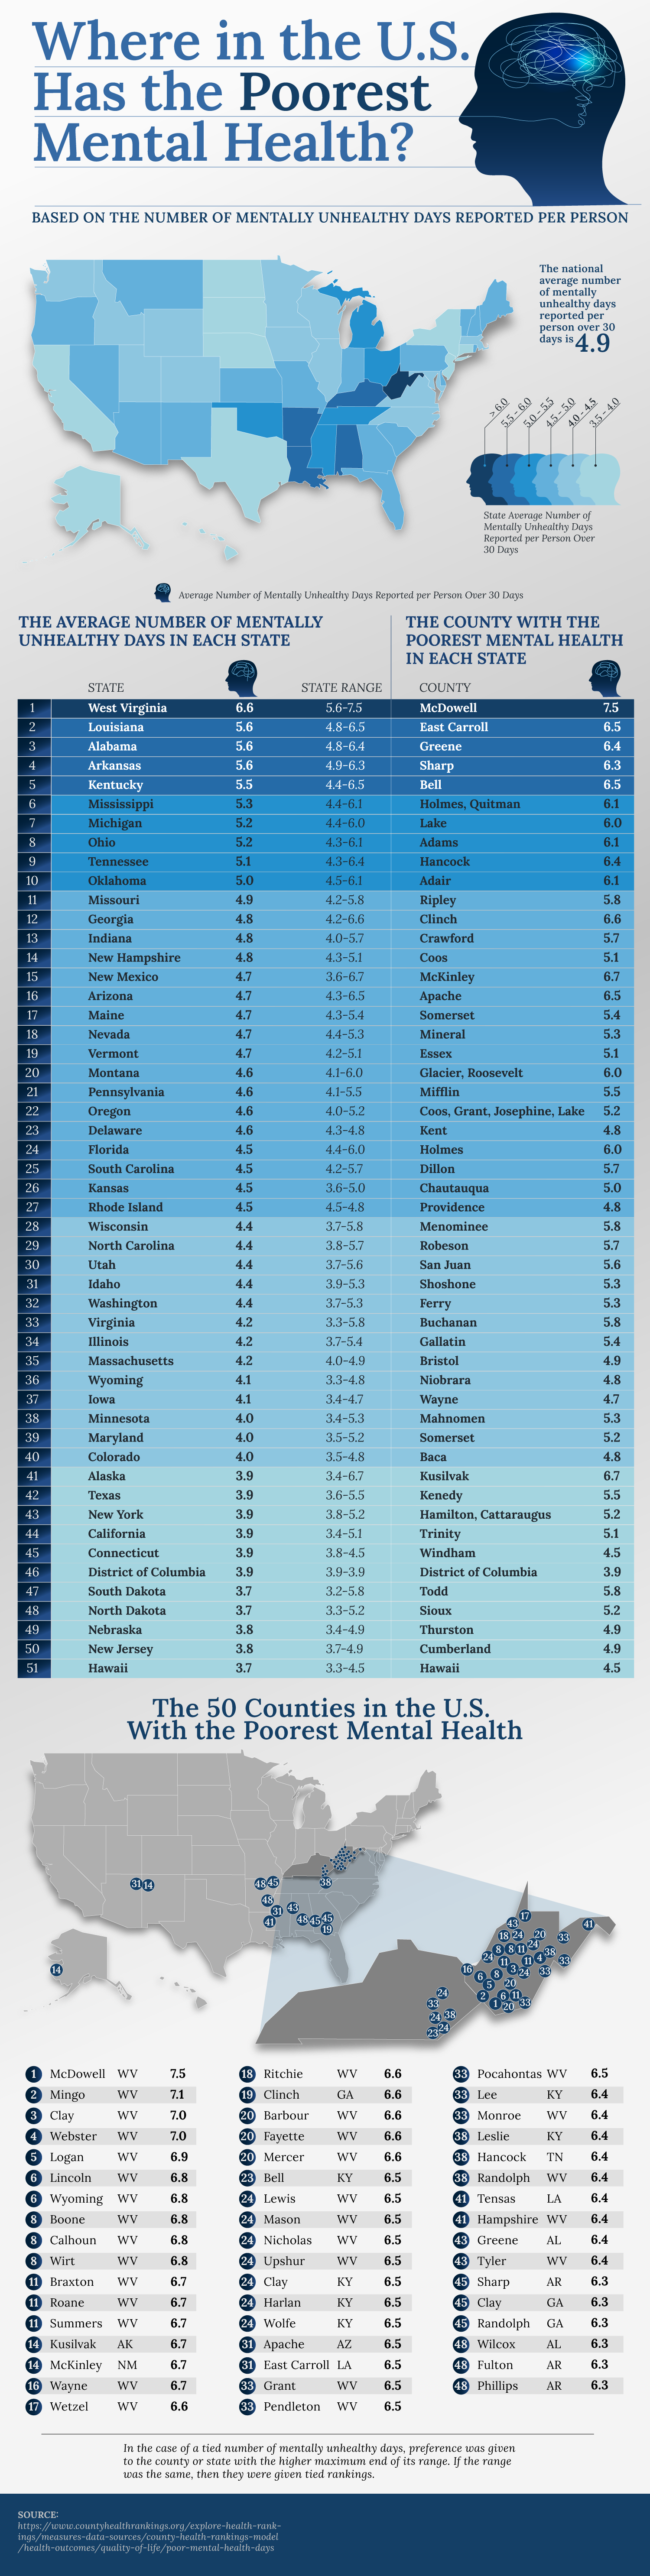
These numbers are self-reported, which is alarming because it makes you wonder how many people are slipping through the cracks due to stigma, lack of awareness, societal influences, and other factors. West Virginia is by far the most concerning – it tops the state chart and contains the majority of the counties with the poorest mental health. Depression, anxiety, bipolar disorder, and schizophrenia rates are among the highest in the nation. In the Healthiest Communities Ranking, the average score among West Virginia’s counties was around 28 out of 100. The five poorest-scoring counties for mental health were all in West Virginia. Another study found that 24.62% of adults in West Virginia are struggling with mental illness. What could be going on in West Virginia? A major contributor is stigma – West Virginia has a culture of independence and grit, so it is often frowned upon to seek help for mental illness. Lack of access to proper care is another factor; the rate of mental health providers per 100,000 people is 45% below average than the rest of America.
Charts like this give us an opportunity to fight stigma. No one should have to suffer in silence. If you are someone you know is struggling, there are options.

Moving into a first apartment is a rite of passage, but the math behind making it a reality is becoming a bigger obstacle. The metros with the strongest job markets also have the steepest living costs, and over the past few years, rent in these areas has climbed faster than paychecks. Cheap rent isn’t the only solution, though. Thin wages and flat hiring shut young people out of many cities.
Rove Lab’s new analysis identifies the cities in the middle ground with the most to offer young people establishing their lives. The study examined the 100 most populous U.S. metro areas and scored each one on 10 different metrics grouped into three weighted categories.
Click below to zoom.
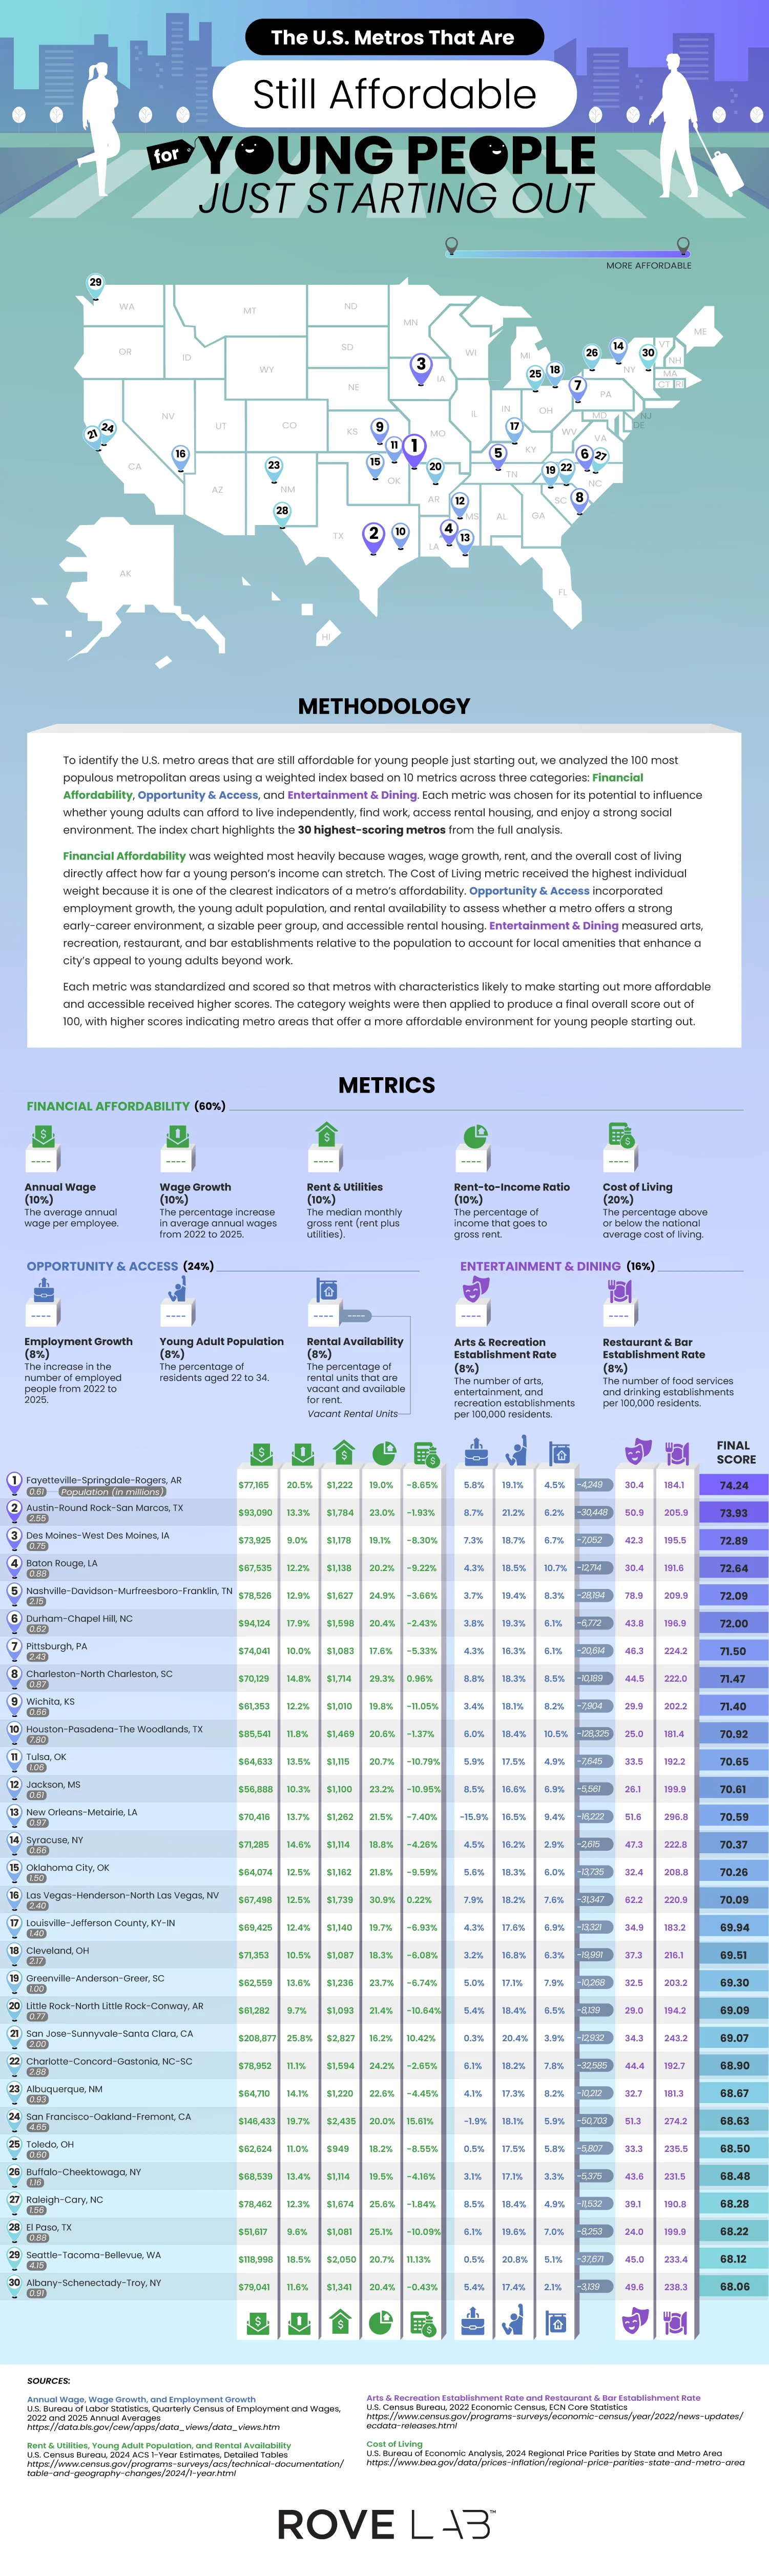
Financial affordability was the most important category, carrying 60% of the weight. This category covers average annual wage, wage growth, median rent and utility costs, rent-to-income ratio, and cost of living relative to the national average. Cost of living alone received 20% of the weight, the heaviest single metric in the study. Opportunity and access accounted for 24% and included employment growth, number of residents between 22 and 34, and amount of rental vacancy. The final 16% went to entertainment and dining, tracking the number of arts and recreation venues and restaurants and bars per 100,000 residents. Each metric was standardized, scored, and weighted into a final number out of 100.
The winning city was Fayetteville-Springdale-Rogers, Arkansas, with a score of 74.24. This isn’t an obvious winner until you look at the numbers. Wages increased by 20.5% from 2022 to 2025, with the average wage at $77,165 and a cost of living that’s 8.65% below the national average. This combination creates a rent-to-income ratio of 19%, leaving young people with money to save, potentially for the elusive dream of homeownership. Fortune 500 companies, Walmart, J.B. Hunt, and Tyson, have a home in the area and likely explain wage strength.
Austin-Round Rock-San Marcos followed with a 73.93 score, driven by a thriving tech sector that’s seen 8.7% employment growth, and the area offers 30,000 vacant rental units for newcomers. Des Moines, Baton Rouge, and Nashville round out the top five.
A few cities earned high rankings thanks to low housing costs. Pittsburgh was seventh overall with a rent-to-income ratio of 17.6%. Wichita, ranked ninth, has low rent and utilities and a low cost of living that’s 11.05% below average. Toledo, number 25 on the list, has the cheapest housing of all cities on the list, with an average of $949 a month.
The most surprising cities on the list are Californian. San Jose-Sunnyvale-Santa Clara ranks 21st, and San Francisco-Oakland-Fremont lands 24th, despite costs of living well above the national average. Salaries do the heavy lifting, averaging $208,877 and $146,433, respectively. This pulls down San Jose’s rent-to-income ratio to 16.2%, the lowest on the list.
Anyone who chats, texts, or scrolls social media will see text depicting laughter many times a day. A new map from Preply shows that the way laughter is portrayed changes dramatically depending on the language. In this “Laughing Around the World” map, Preply cataloged 26 different ways people express their mirth online, from familiar acronyms to creative onomatopoeia.
Click below to zoom.
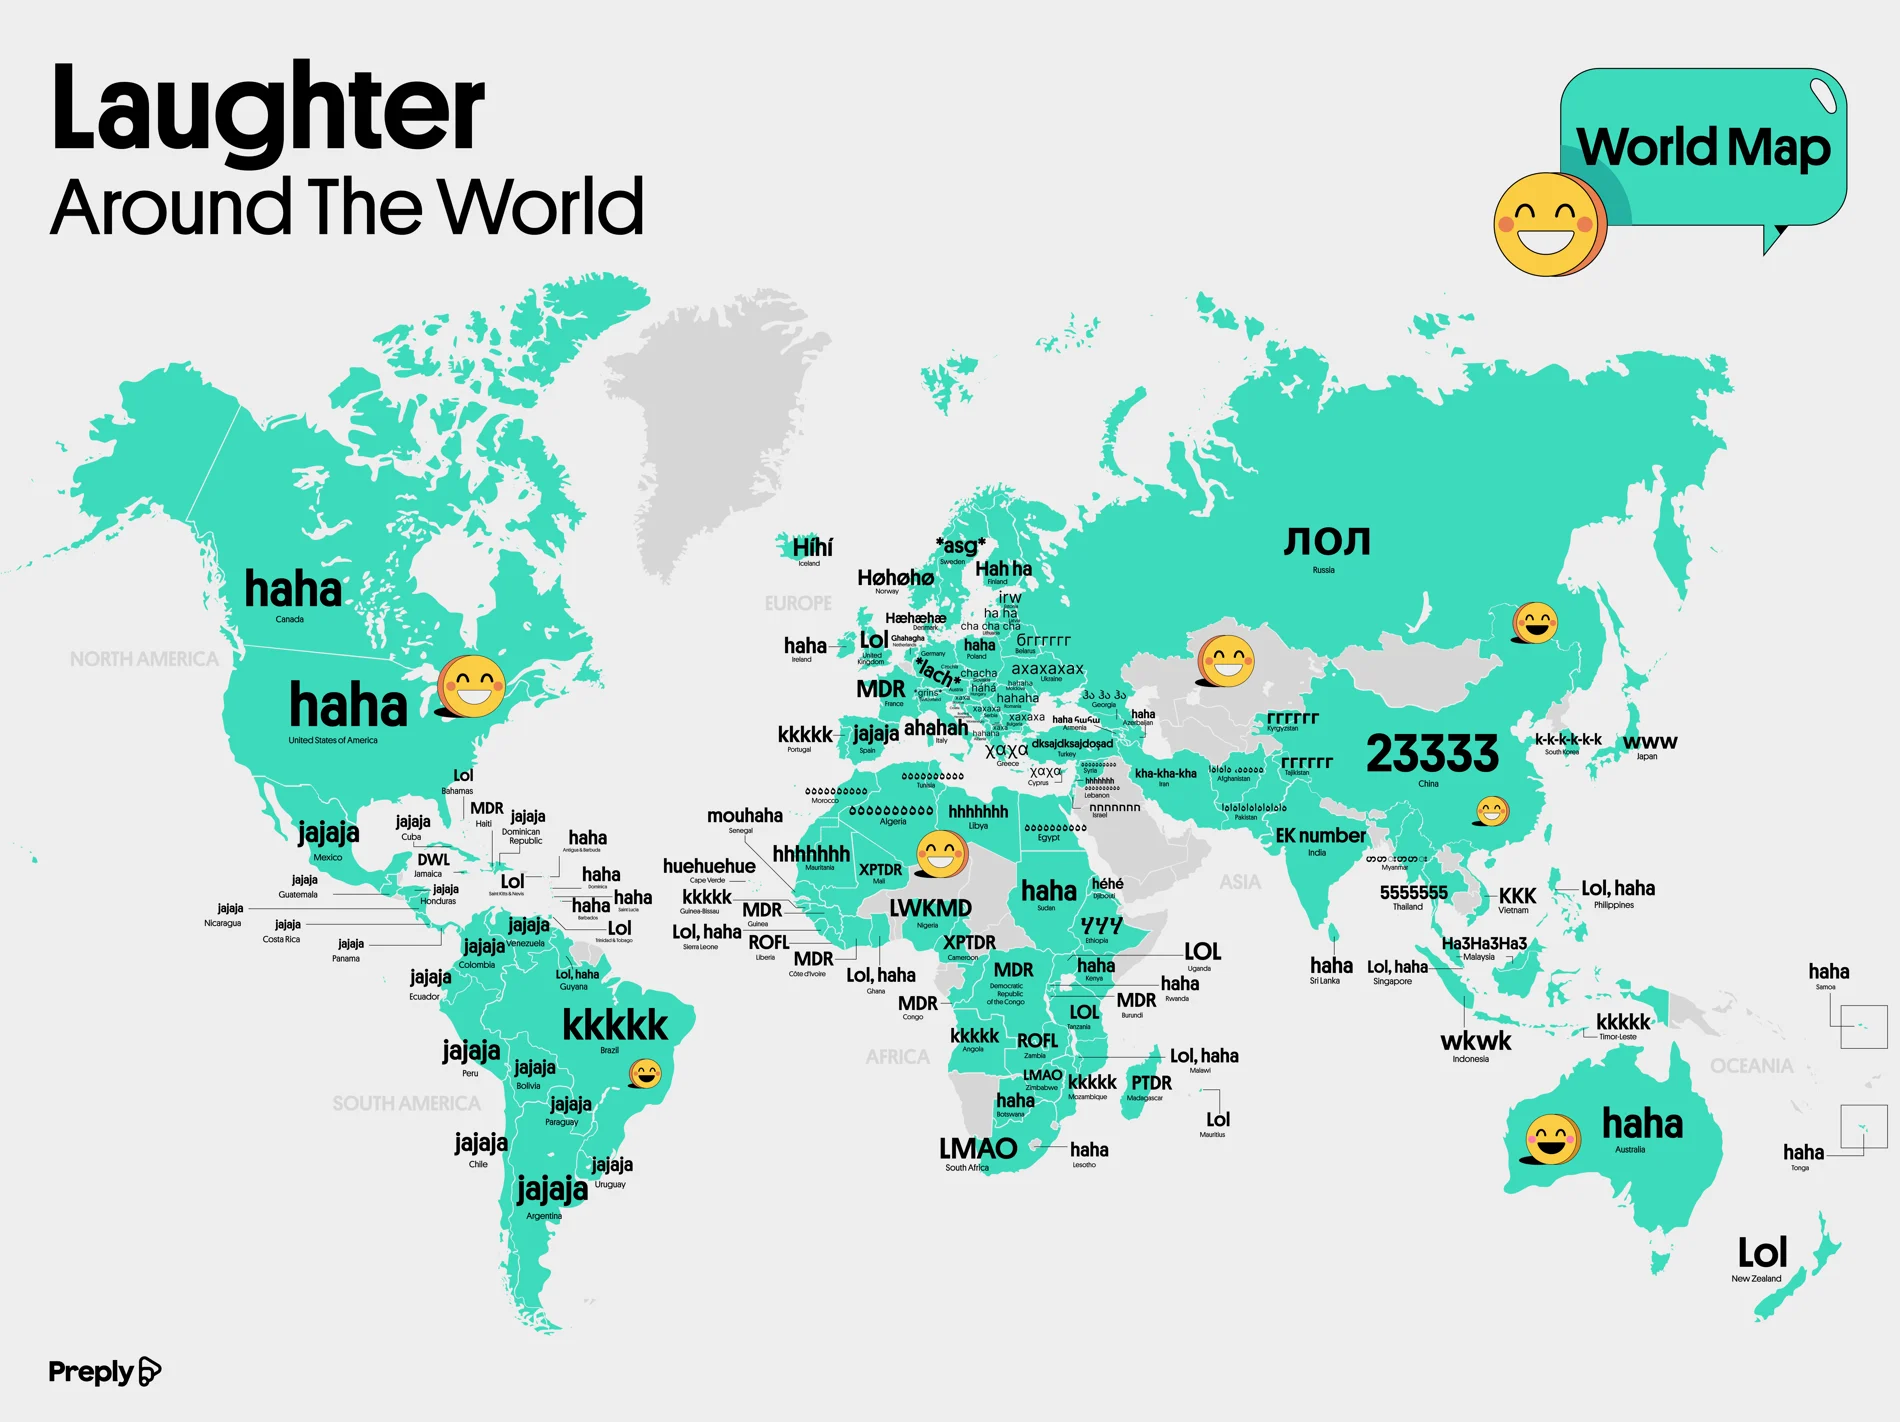
Some of the most distinct forms of laughter aren’t words at all. Thai speakers type out “55555” because the Thai word for that number sounds like “ha!” The more 5s Thai texters type, the bigger the laugh. Mandarin speakers type “23333,” while Japanese users type “www,” because the Japanese word for laughter is warau, and they think a “w” resembles a grinning face.
Other forms of laughter come straight from keyboard mechanics. Indonesians type “wkwkwk” mostly because “k” is easier to reach on a home-row keyboard than “h.” Brazilian and Portuguese speakers write out “kkkkkk” or “rsrsrsrs,” which derives from riso, the Portuguese word for laughter. The map also shows the Korean letters for laughter, which are romanized as “kkkk” or “hhhhh.”
English alone has spawned a range of laughter abbreviations, including LOL, LMAO, LMFAO, and ROFL. Other languages followed this lead. French speakers might type out “MDR” or mort de rire, which means “dead from laughing.” The French also use PTDR, or pete de rire, and XPTDR for even greater laughter. Nigerians type LWKM, which translates to “laugh wan kill me,” and LWKMD, or “laugh wan kill me, die.” In Jamaica, you’ll get a text reading DWL for “dead wild laugh.” And Estonians text “IRW,” shorthand for the word irvitamina, which describes a certain type of laugh.
In many languages, online laughter is phonetic based on whatever alphabet the speaker uses. Spanish type “jajaja,” which is the same as “hahaha,” with “jejejeje” indicating irony and “jijijiji” meaning mischief. Persian Farsi uses letters that spell out “kha-kha-kha.” Russian Cyrillic spells out “axaxaxa,” and Ukrainians have a version that indicates that their “axaxaxa” is sarcastic. Greek offers letters for basic laughter, sneaky laughter, giggling, and evil laughter.
Some options show the texture of a language. Italians write out “ahahaha” or “ehehehe” because their language lacks a strong aspirated “h” sound. Germans like to indicate stage direction with an asterisk, so they’ll text “*grins*” or “*lack*.” Polish teens spell out “heheszki,” which means something like “kicking and laughing.” Lithuanians send “cha cha cha,” but they mean laughter, not dancing.
The takeaway from this joyful map is that laughter is universal, but remarkably local in how it’s expressed through a keyboard. Our text-based laughter is shaped by phonetics, slang, alphabet, and the quirks of the keyboard style we use. In a world connected by social media, it’s helpful to recognize the symbols used by our international neighbors to better understand them and communicate clearly. Laughter text also offers a unique look at various languages and their shapes and textures.
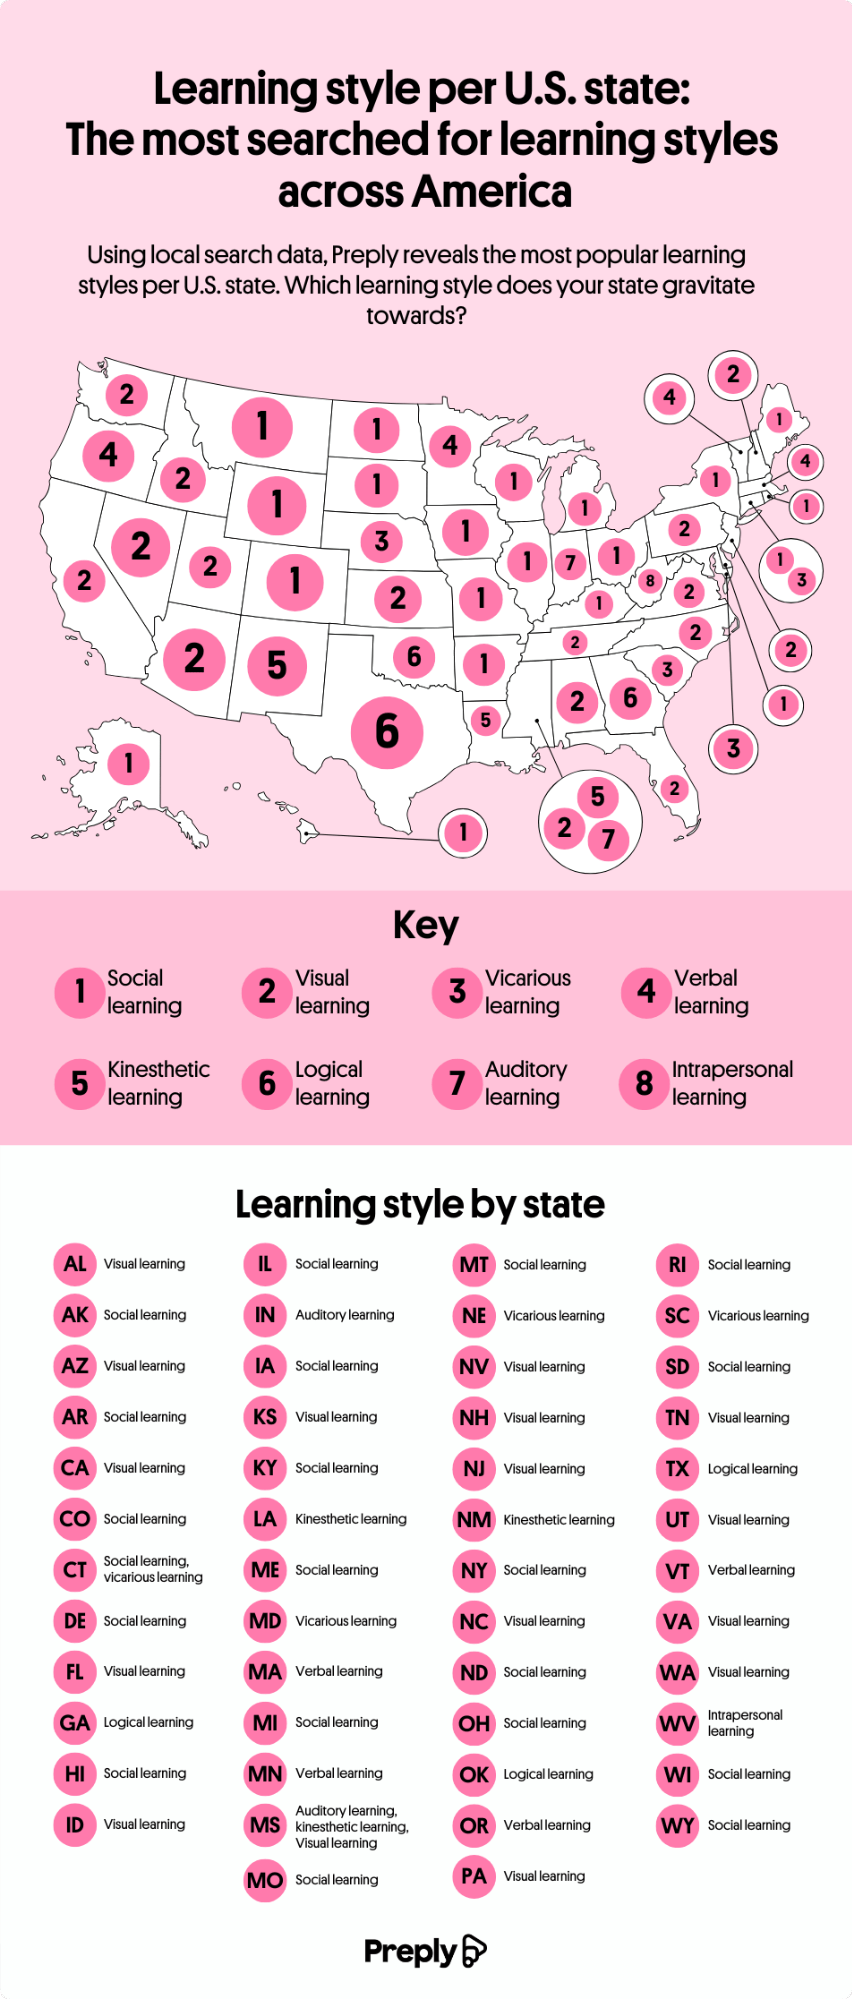
Why do some people absorb new information like a sponge while others labor for hours over a textbook? According to a study by Preply, the answer lies in their learning style. The team set out to map which styles dominate across the United States. Preply emphasizes the importance of its study by citing research showing that more than half of Americans spend under two hours a day studying, with teenagers reporting feeling distracted. At the same time, the majority of Americans believe that different learning styles exist. To identify which styles are most common and where, Preply analyzed a year of Google Trends data across 50 states to map the dominant learning style in each.
Click below to zoom.
A Nation of Social Learners
The study’s standout finding is that 40% of Americans are social learners, making it the single most common learning style in the country. Social learners take in information through interaction and conversation. According to the map, 20 states favor the study-buddy approach, including Connecticut and New York.
Visual learning came in second place. These learners thrive on aids like flowcharts, maps, doodles, and color-coded notes. Preply found that visual learners are concentrated in California, Florida, and Washington. Together, social and visual learners account for more than 70% of Americans.
The Less Common Learning Styles
The remaining six styles in Preply’s study, verbal, vicarious, kinesthetic, logical, auditory, and intrapersonal, are much less prevalent, making up just 34% of preferences combined. Verbal and vicarious learning tie as the third most popular style, but together account for only about 8%. The map reveals some notable patterns. While the West skews heavily toward visual learners, the eastern half of the country shows more variance. Massachusetts and Vermont residents lean toward verbal learning, while Connecticut and New Yorkers favor social learning.
A few individual states stand out as outliers. Auditory learning, which is learning through hearing information, leads in only two states: Mississippi and Indiana. West Virginia is the only state in the country that favors intrapersonal, solitary learning. This is the least preferred learning style nationwide.
What We Can Learn from These Findings
Preply began their study with a seed list of widely recognized learning styles drawn from educational resources, then measured popularity using Google Trends data from 12 months across 50 states. Where multiple styles ranked equally in a state, the team treated them as equally popular. The point Preply drew from this data is the recognition that how you learn is a useful step toward more effective studying, particularly in a country where study time is short and distractions are plentiful.
What emerges from the team’s map is a portrait of a country that isn’t uniform. No single learning style dominates everywhere, and neighboring states can be quite different from one another. This study serves as a reminder that study habits are shaped by geography, culture, and personal preference. The Preply study is another in a long line of ideas about how people learn, drawing on theories from Aristotle to Howard Gardner, to Neil Fleming.
-
 Business Visualizations2 years ago
Everything Owned by Apple
-
 Business Visualizations2 years ago
America’s Most Valuable Companies Ranked by Profit per Employee
-
 Business Visualizations2 years ago
The Biggest Fortune 500 Company in Every State
-

 Business Visualizations1 year ago
The Biggest Employers by Industry
-
 Charts2 years ago
Map Uncovers Countries with Most Powerful Passports
-
 Business Visualizations12 months ago
The Largest Companies in America That Are Still Run by the Person Who Founded Them
-
 Timelines2 years ago
Timeline Charts the Development of Communications Technology
-
 Timelines2 years ago
The Evolution of Baby Names: A Century of Trends