
Maps
Map Shows 26 Ways to Say “Haha”

Anyone who chats, texts, or scrolls social media will see text depicting laughter many times a day. A new map from Preply shows that the way laughter is portrayed changes dramatically depending on the language. In this “Laughing Around the World” map, Preply cataloged 26 different ways people express their mirth online, from familiar acronyms to creative onomatopoeia.
Click below to zoom.
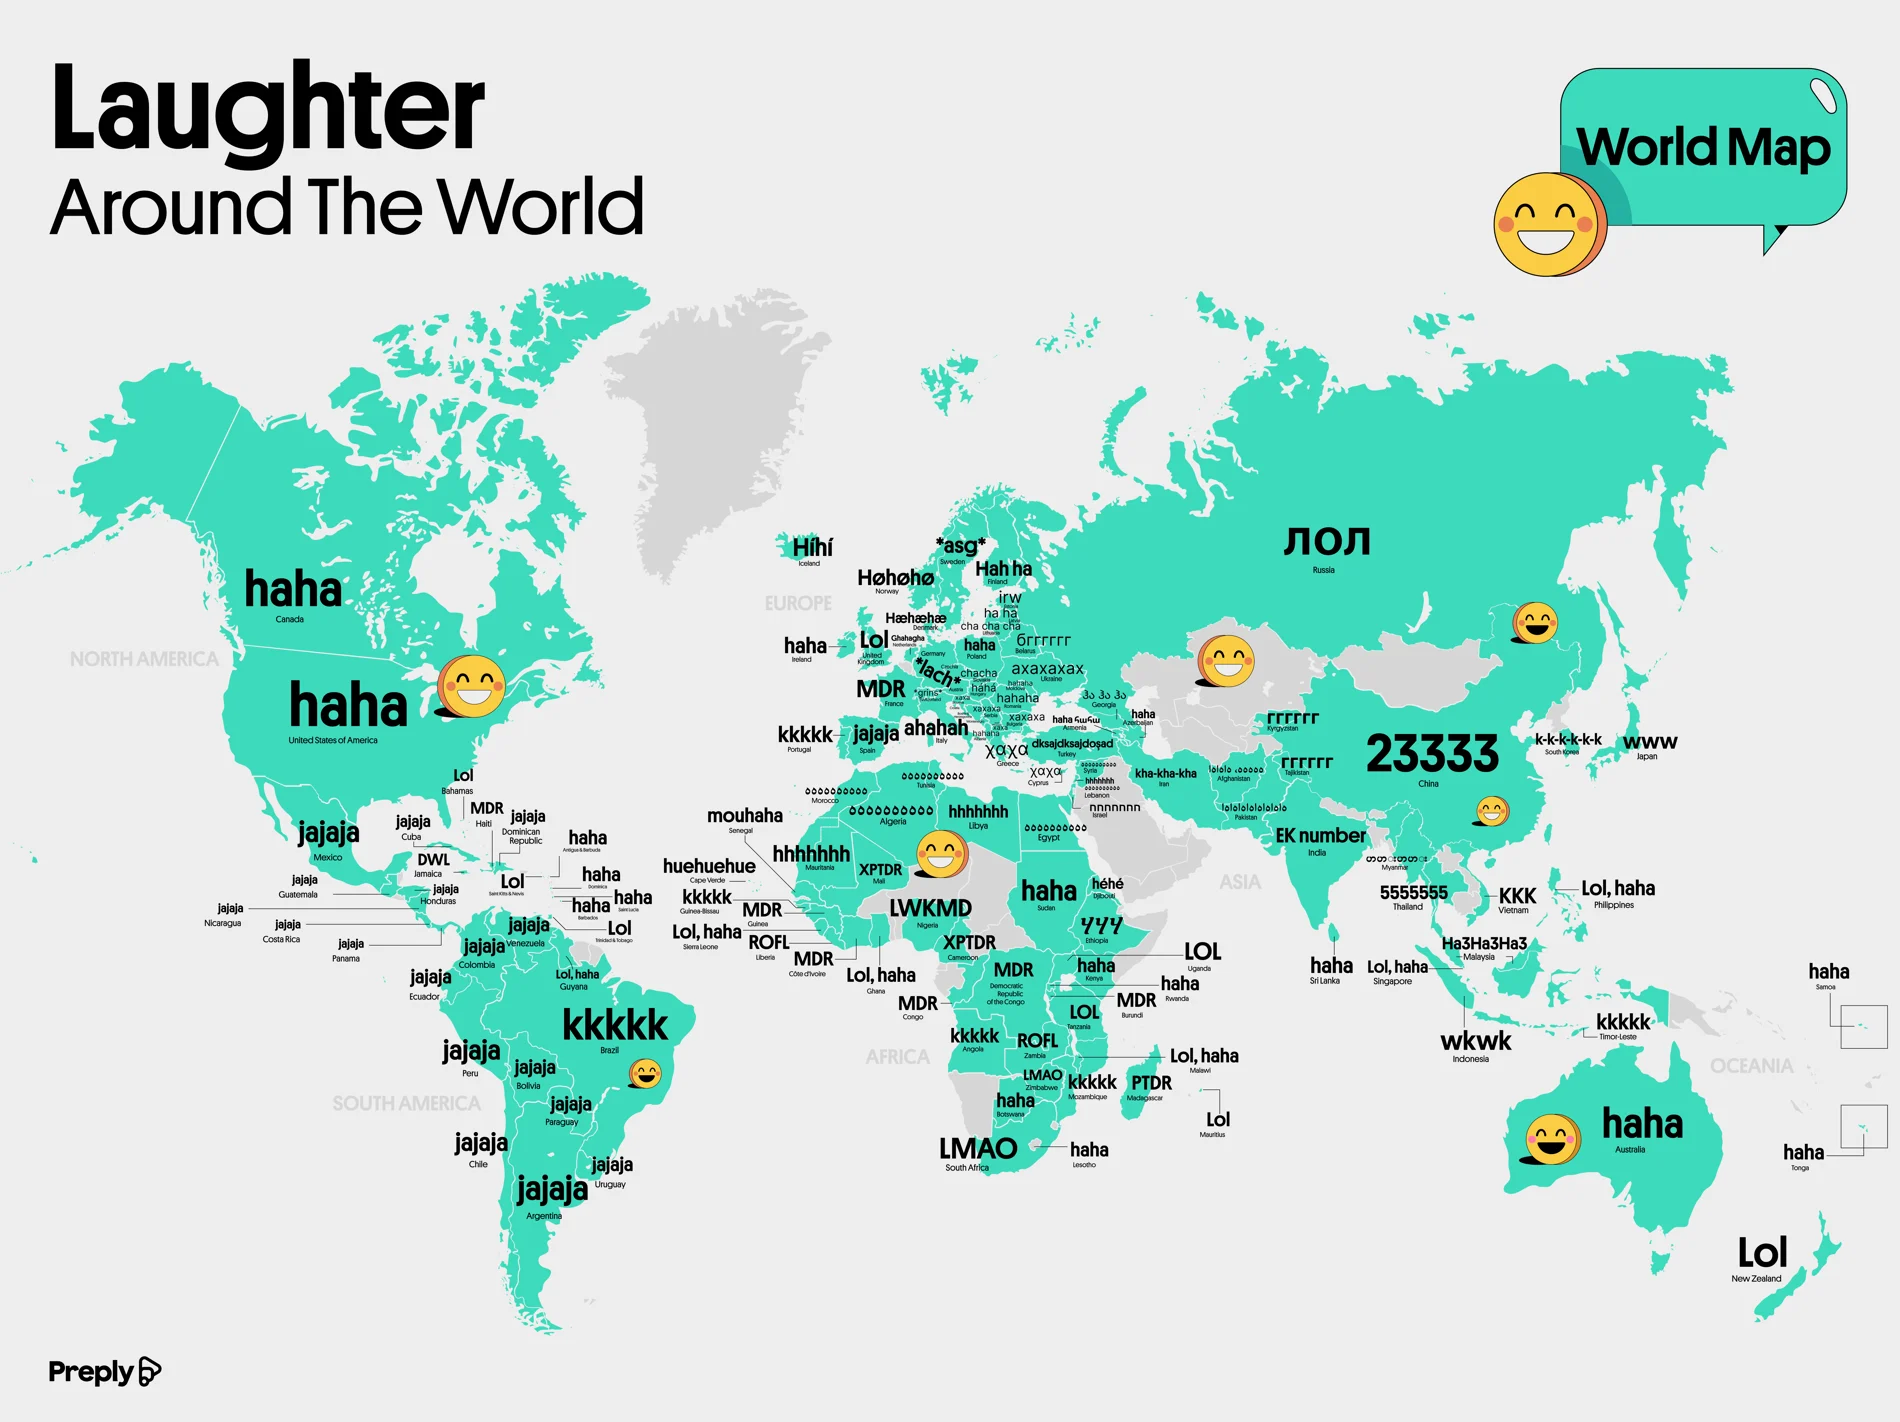
Some of the most distinct forms of laughter aren’t words at all. Thai speakers type out “55555” because the Thai word for that number sounds like “ha!” The more 5s Thai texters type, the bigger the laugh. Mandarin speakers type “23333,” while Japanese users type “www,” because the Japanese word for laughter is warau, and they think a “w” resembles a grinning face.
Other forms of laughter come straight from keyboard mechanics. Indonesians type “wkwkwk” mostly because “k” is easier to reach on a home-row keyboard than “h.” Brazilian and Portuguese speakers write out “kkkkkk” or “rsrsrsrs,” which derives from riso, the Portuguese word for laughter. The map also shows the Korean letters for laughter, which are romanized as “kkkk” or “hhhhh.”
English alone has spawned a range of laughter abbreviations, including LOL, LMAO, LMFAO, and ROFL. Other languages followed this lead. French speakers might type out “MDR” or mort de rire, which means “dead from laughing.” The French also use PTDR, or pete de rire, and XPTDR for even greater laughter. Nigerians type LWKM, which translates to “laugh wan kill me,” and LWKMD, or “laugh wan kill me, die.” In Jamaica, you’ll get a text reading DWL for “dead wild laugh.” And Estonians text “IRW,” shorthand for the word irvitamina, which describes a certain type of laugh.
In many languages, online laughter is phonetic based on whatever alphabet the speaker uses. Spanish type “jajaja,” which is the same as “hahaha,” with “jejejeje” indicating irony and “jijijiji” meaning mischief. Persian Farsi uses letters that spell out “kha-kha-kha.” Russian Cyrillic spells out “axaxaxa,” and Ukrainians have a version that indicates that their “axaxaxa” is sarcastic. Greek offers letters for basic laughter, sneaky laughter, giggling, and evil laughter.
Some options show the texture of a language. Italians write out “ahahaha” or “ehehehe” because their language lacks a strong aspirated “h” sound. Germans like to indicate stage direction with an asterisk, so they’ll text “*grins*” or “*lack*.” Polish teens spell out “heheszki,” which means something like “kicking and laughing.” Lithuanians send “cha cha cha,” but they mean laughter, not dancing.
The takeaway from this joyful map is that laughter is universal, but remarkably local in how it’s expressed through a keyboard. Our text-based laughter is shaped by phonetics, slang, alphabet, and the quirks of the keyboard style we use. In a world connected by social media, it’s helpful to recognize the symbols used by our international neighbors to better understand them and communicate clearly. Laughter text also offers a unique look at various languages and their shapes and textures.
Americans collectively owe $1.863 trillion in student loans spread across roughly 43 million borrowers. A new analysis from Student Choice examines whether a $400 monthly payment is as affordable in every state. The gap between the most and least affordable states paints a picture of the complexities of debt, living expenses, and wages.
Student Choice scored 50 states on five metrics weighted by how directly living there affects student loan affordability. The heaviest metric is the student-loan-to-income ratio (40%), followed by delinquency rate (20%), rent-to-income ratio (15%), household debt-to-income ratio (15%), and cost of living (10%). Each state gets a final score, and a higher score means loans are harder to afford. Monthly payments are estimated from Department of Education data, assuming a 5.99% interest rate and a standard 10-year repayment plan.
Click below to zoom.
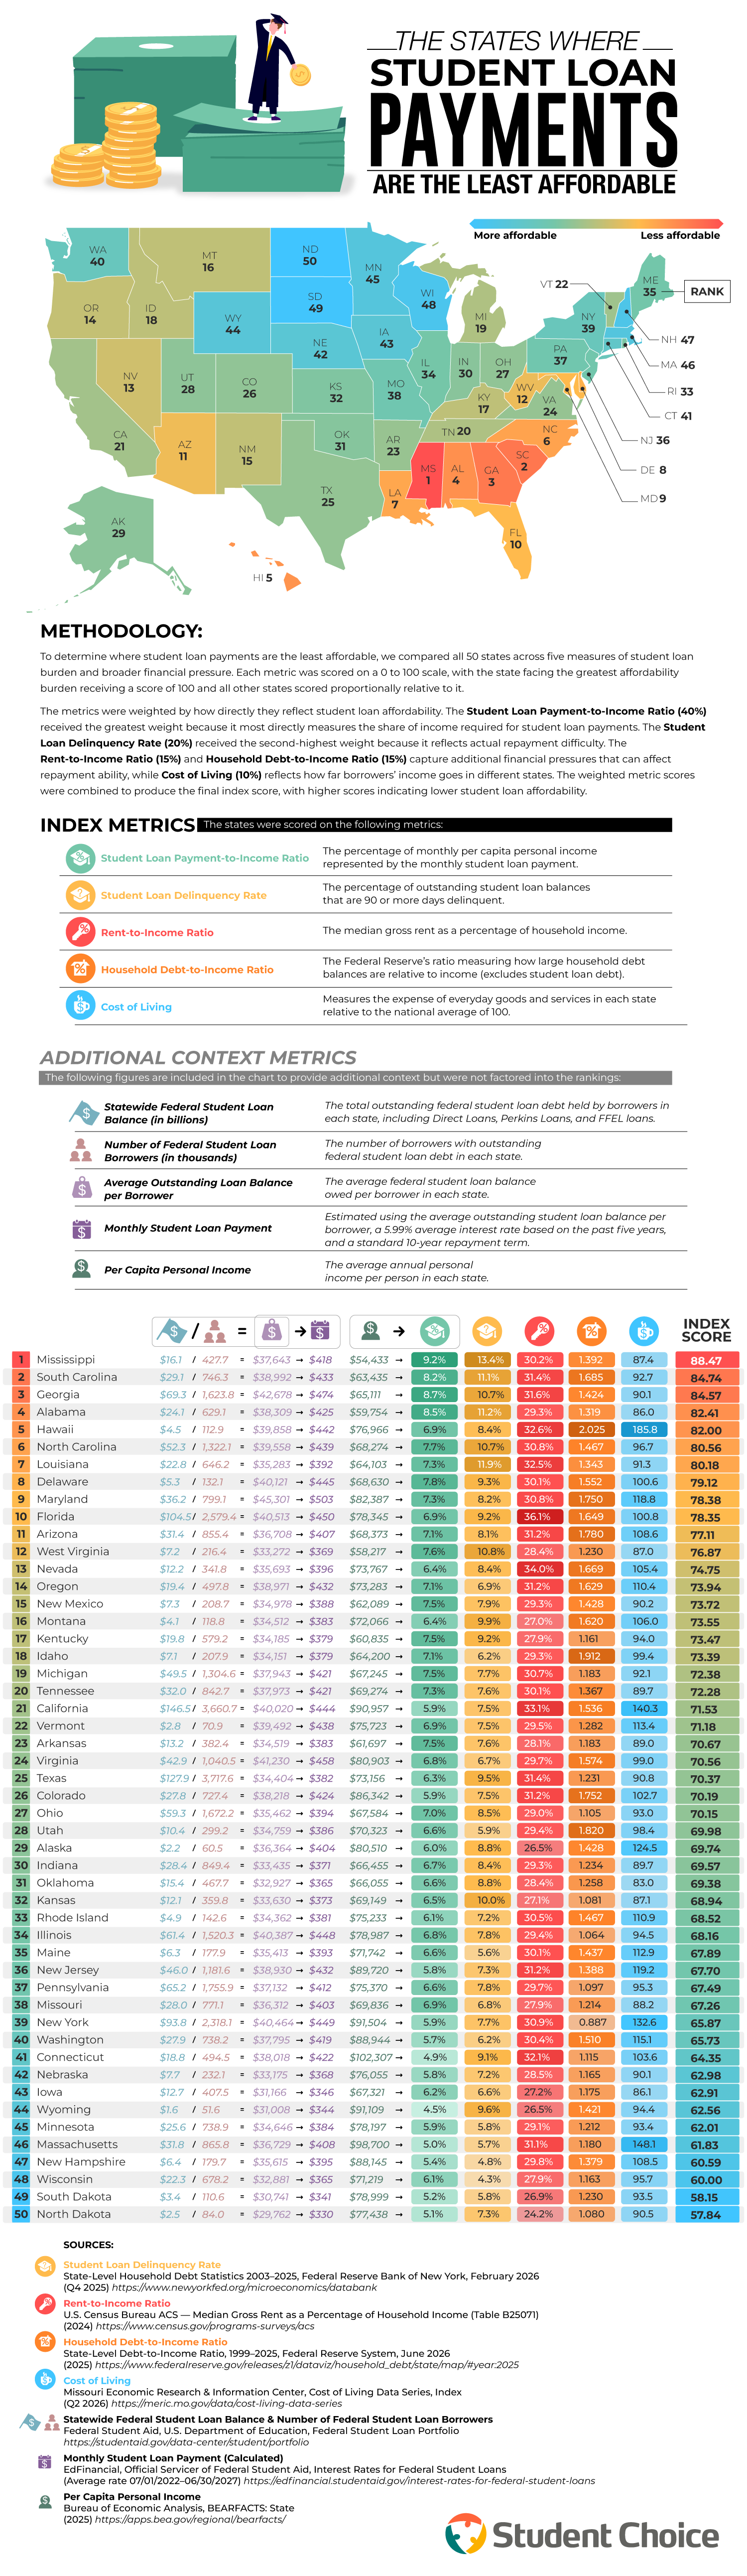
Mississippi is the least affordable state, largely because of low incomes. The per capita personal income in this state is $54,433, the lowest in the country. That means an average loan payment of $418 a month takes up 9.2% of income. Mississippi also has the nation’s highest delinquency rate, with 13.4% of student loan balances at 90 days or more past due.
The article makes a stark comparison with Connecticut borrowers who pay about the same amount each month at $422 but earn twice as much, so that payments take up just 4.9% of their income.
South Carolina, Georgia, and Alabama follow Mississippi, with much of the South clustered at the top of the ranking. Hawaii is the biggest outlier in the top 10. Its cost-of-living index of 185.8 is nearly double the national average, pushing the state to fifth place.
North Dakota is the most affordable state, with the lowest average loan balance at $29,762, the lowest average monthly payment at $330, and the lowest rent-to-income ratio in the nation at 24.2%. South Dakota trails by .31 points and has a lower delinquency rate than its neighbor. The rest of the top 10 most affordable states are Wisconsin, New Hampshire, Minnesota, and, believe it or not, Massachusetts and Connecticut. High incomes in those last two states offset their high costs.
The national average estimated student loan payment is $419 a month. Maryland borrowers pay the most on average at $503, followed by Georgia, Virginia, Florida, and New York. The article offers practical guidance, advising borrowers to keep loans under 10% of their income and to use the 50/30/20 budgeting rule. It also suggests borrowers refinance their loans if payments become unmanageable.
The article includes a detailed table with all the findings and data from all 50 states. You’ll find each state’s rank, federal loan balance, number of borrowers, average balance, estimated monthly payment, and per capita income. Borrowers comparing where to live or wondering whether their location is affecting the affordability of their loan payments can see exactly where their state lands, along with the details in this helpful study.

In some U.S. cities, a night out costs over twice as much as a night in, and in some locations, up to three times as much! A study from Rove Lab gathered data and compared doing the same date-night activity at home versus out across the 50 most populous U.S. cities.
Rove Lab compared the cost of two fixed dates. A night out included dinner for two at a restaurant, four beers at a pub, two five-mile taxi rides, and two movie tickets. A night in included ingredients for a home-cooked steak dinner, four store-bought beers, and a $5.99 stream rental. They used local prices from LivingCost.org and calculated a “premium for going out” in each city, which represents how much more a night out costs than a night in.
Click below to zoom.
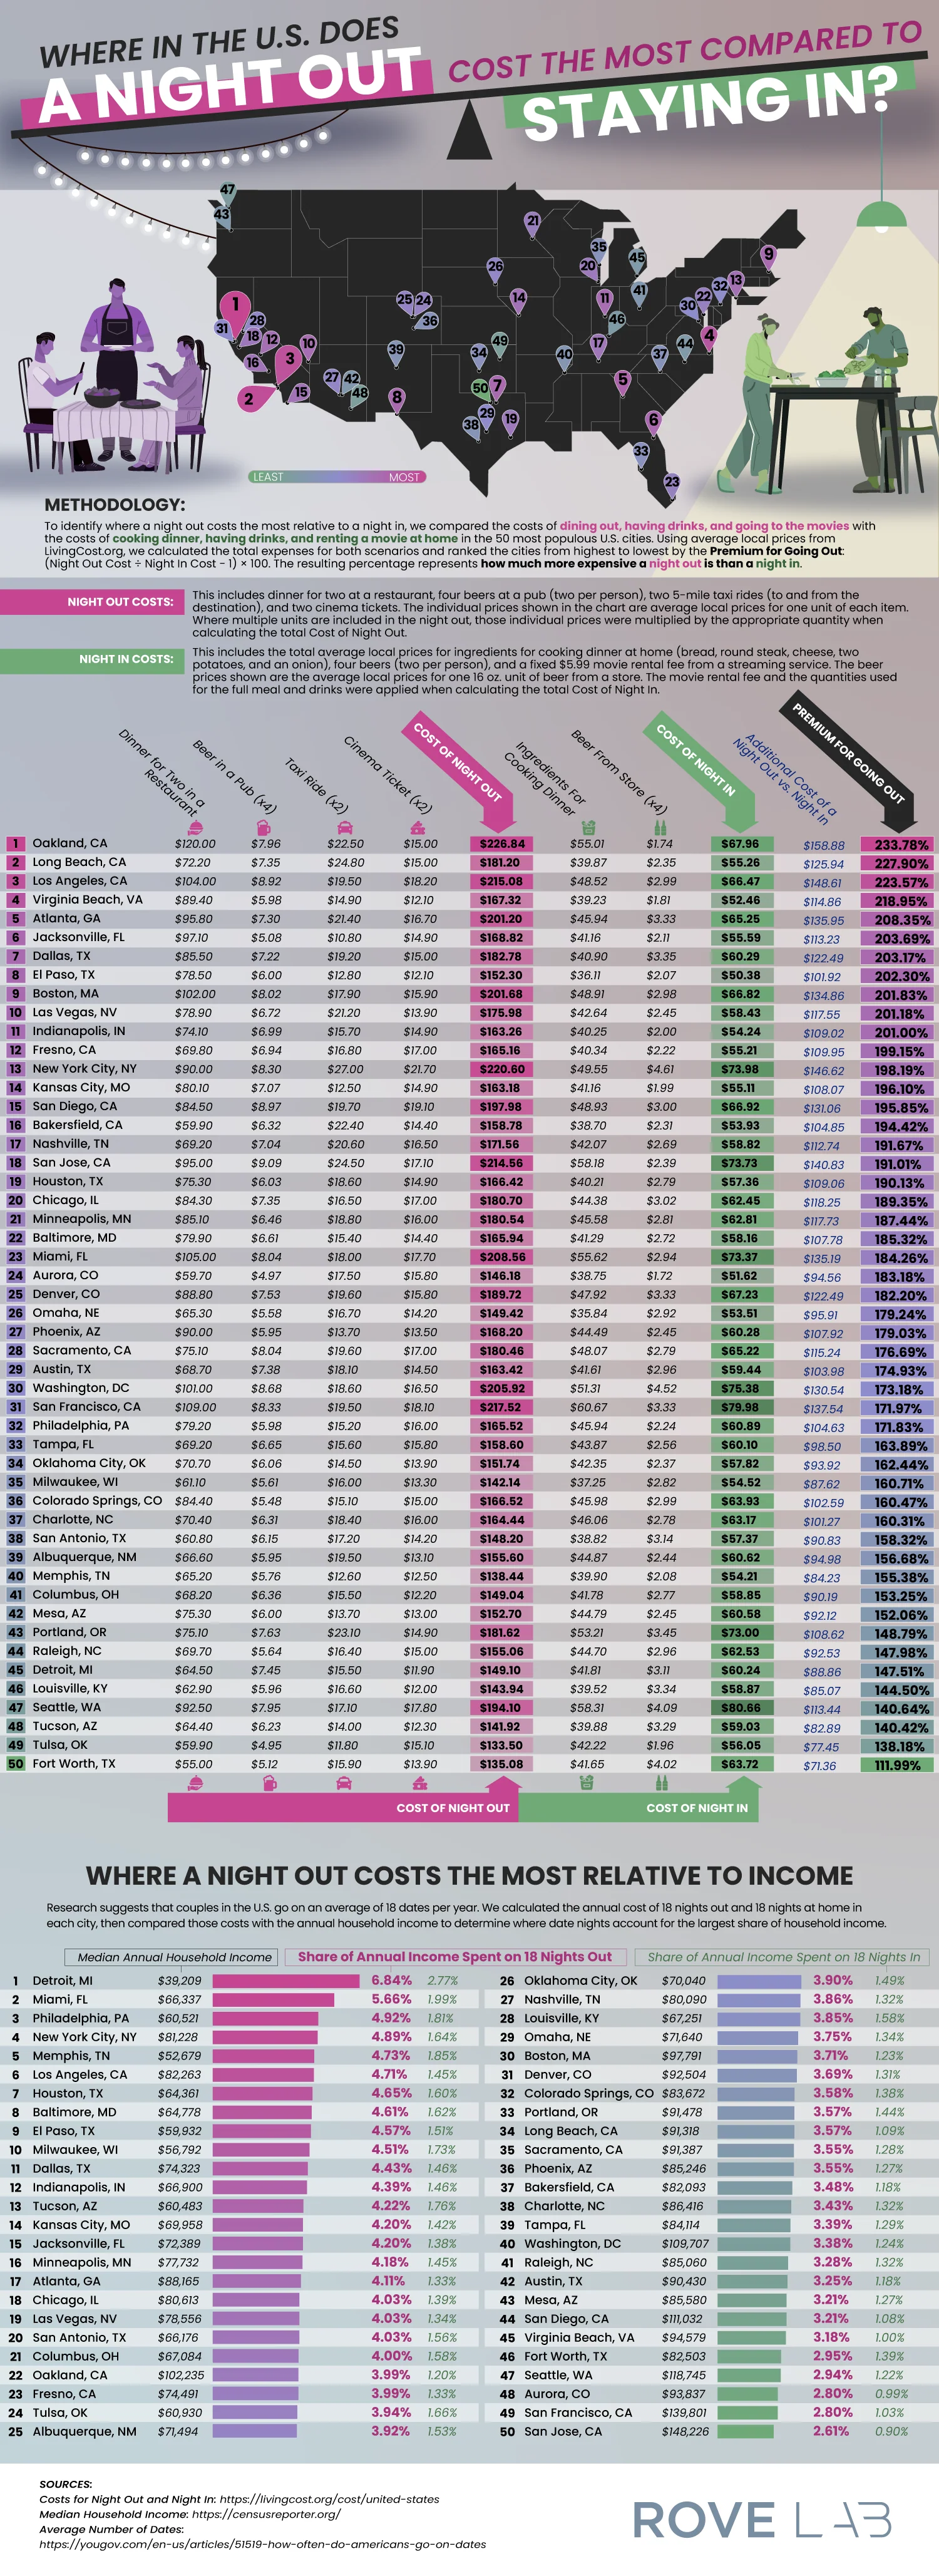
Oakland, California tops the list as the most expensive location for a date night. Dinner, drinks, a movie, and a taxi will cost $226.84 there compared to the $67.96 you’d spend on a night in. That’s a 234% premium for going out. Long Beach and Los Angeles were followed behind with premiums over 220%. Virginia Beach and Atlanta round out the top 5, and Jacksonville, Dallas, El Paso, Boston, and Las Vegas complete the top 10.
Some of the results are a little surprising. You might expect New York City to breach the top ten, and it does have the second-most expensive night out at $220.60, but it ranks only 13th because staying in is expensive there as well, so it has a lower premium. San Francisco and San Jose dropped in ranking for the same reason. At the other end of the list, Fort Worth offers the most affordable night out at a 112% premium.
Another ranking in the study might be even more revealing. Research shows U.S. couples have about 18 dates per year, so Rove Lab calculated what share of each city’s median household income goes to these dates. Detroit residents take the hardest hit. 18 nights out cost about $2,684, or 6.84% of a median income, compared with 2.77% for 18 nights in. Miami, Philadelphia, and New York City also rank highly on this metric.
San Jose is at the opposite end of the spectrum. It has one of the most expensive nights out, but high median incomes mean 18 dates take up only 2.61% of a typical household’s earnings. Local prices and incomes vary dramatically, so a city that looks expensive by one metric can look affordable based on another.
The team’s article included two full tables of data. The first lists all 50 cities with item-by-item prices, totals, the dollar difference, and the premium percentage. The second table shows each city’s median income compared to nights out vs. nights in. A summary of findings includes tips for making the most of an affordable night at home. This data might make couples think twice about how they spend their date nights and whether or not they want to adjust their budgets.
Most travelers pack a few assumptions about other cultures alongside their passport. They might believe everyone in Europe greets each other with a kiss on the cheek, or that showing up a little late is chic, or that warmer languages and climates mean warm, touchy greetings. Preply surveyed 1,600 people across 27 countries, suggesting that many traveler instincts are wrong.
The Root of Assumptions
Preply first examined how people judge cultures before they arrive and participate in them. 3,608 adults in six countries rated how different languages sound. French won for sounding romantic (54%), and Italian was close behind at 43%. Portuguese and Spanish led for warmth, while English came in last at just 7%. The article argues that these impressions of language often shape a visitor’s real-world expectations, even if it doesn’t match etiquette, or indeed, reality.
Greetings: Let the Other Person Lead
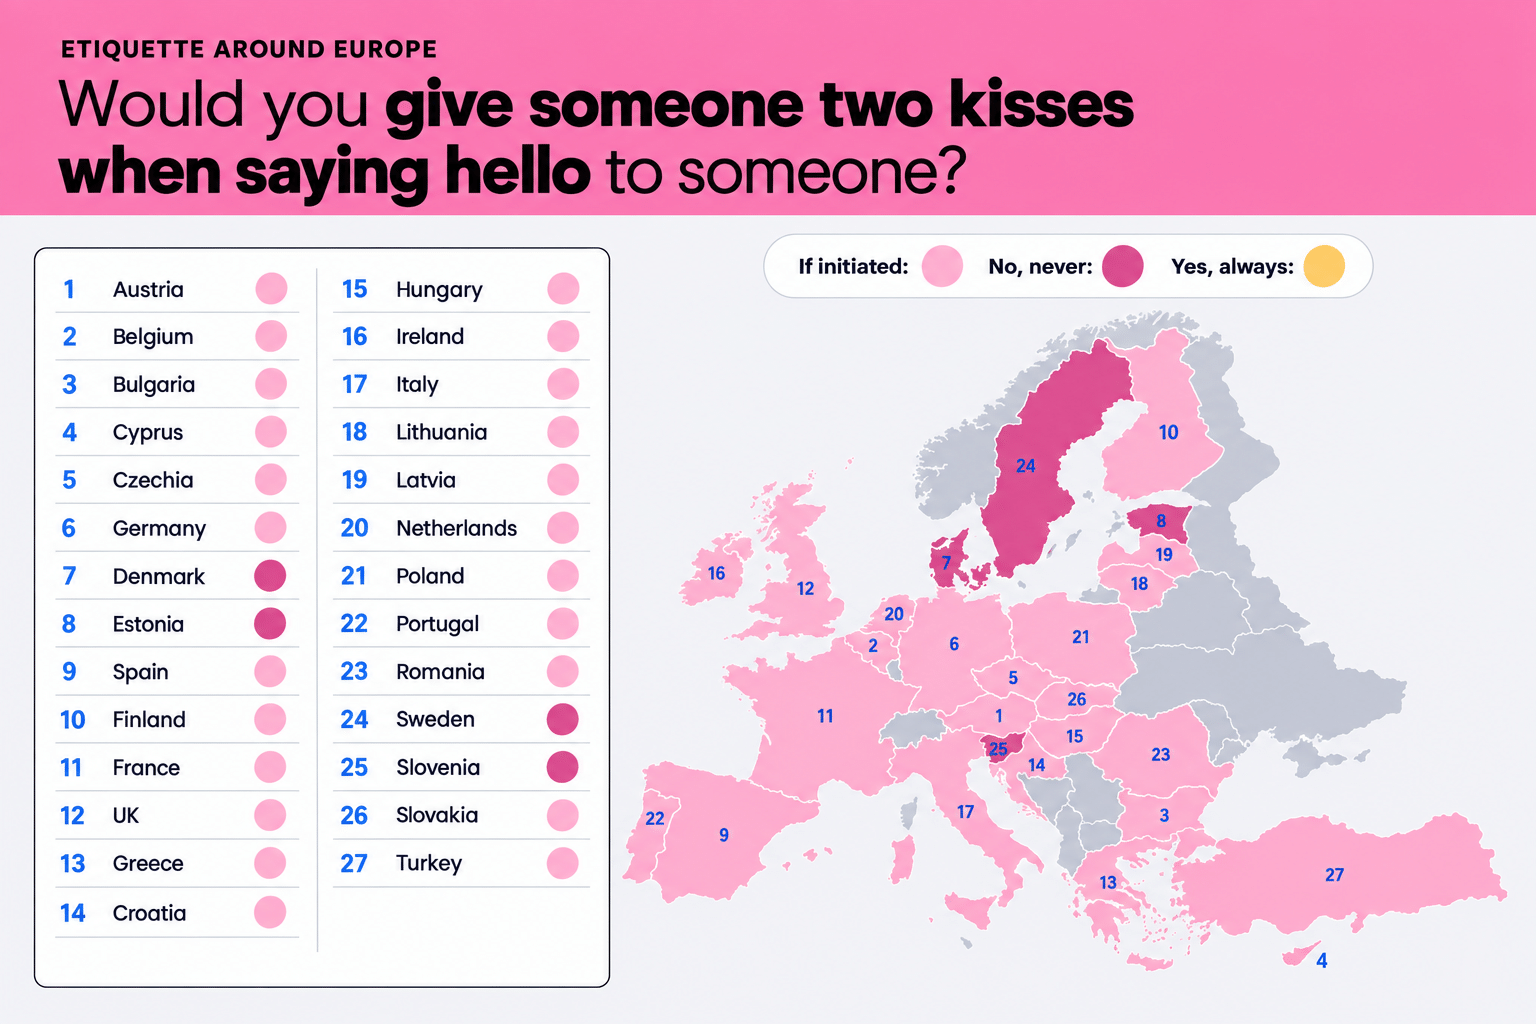
The double cheek kiss is Europe’s most famous greeting, but no one appears comfortable initiating it. In 23 out of 27 countries, most respondents said they’d only go in for it if the other person did first. Not a single country had a majority willing to initiate the double-cheek kiss. In Estonia, Denmark, Slovenia, and Sweden, people never do the cheek kiss. The article’s map shows exactly how each country lines up.
Click below to zoom.
Shoes: Leave them at the Door
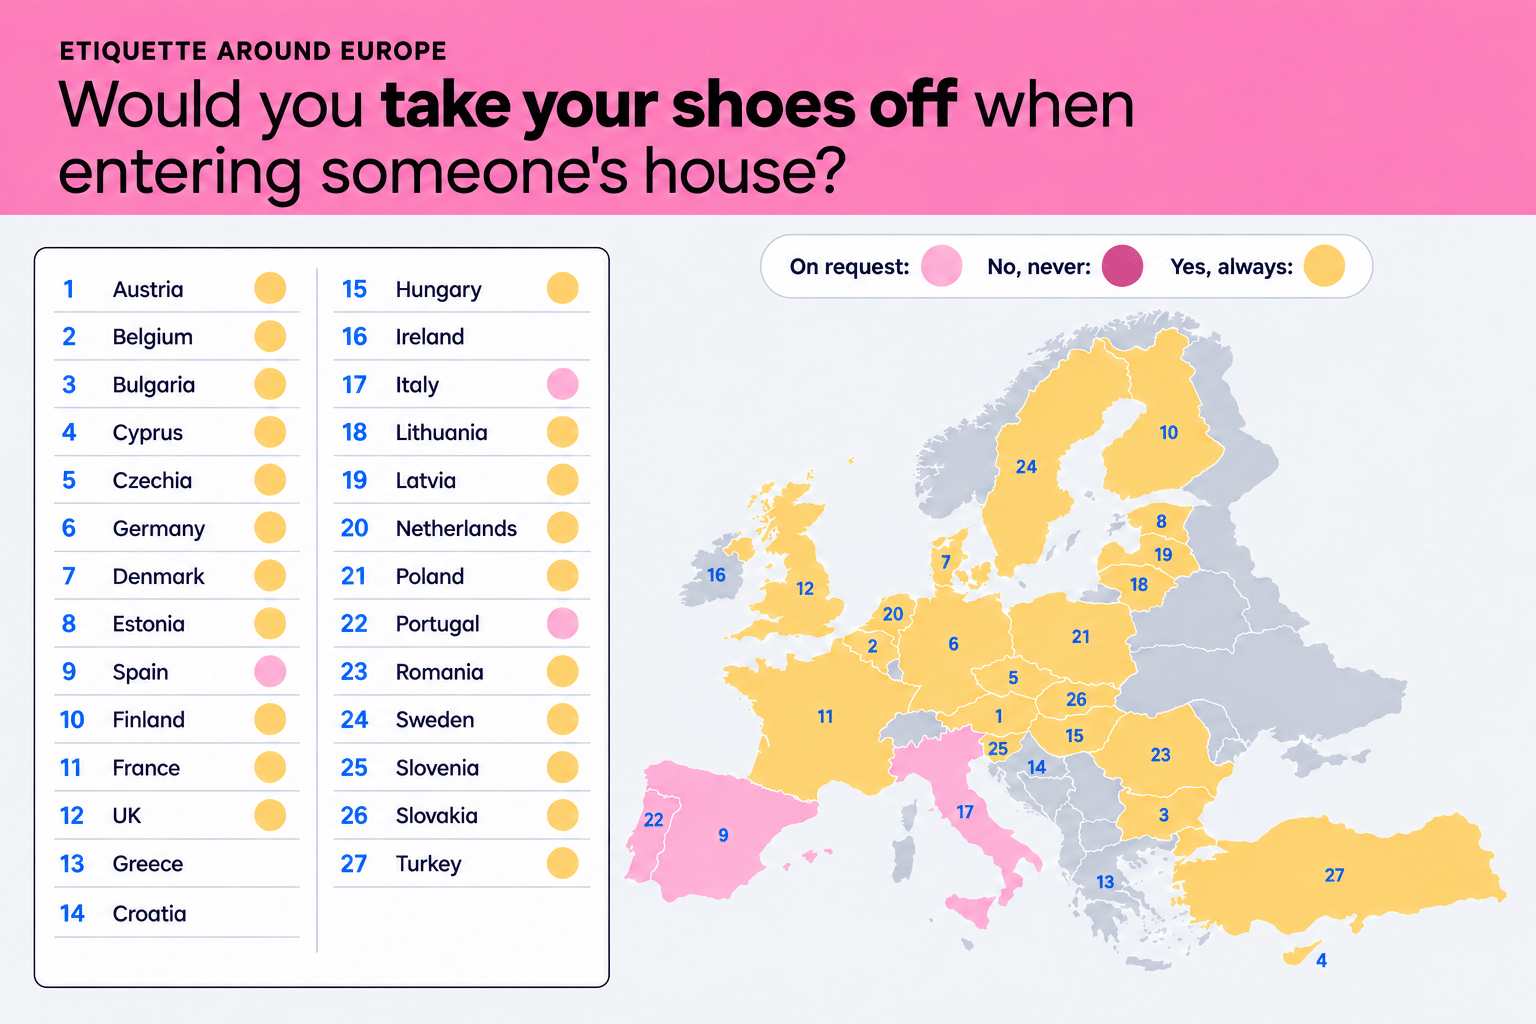
In 24 of 27 countries, the majority of people remove their shoes in someone else’s home. This was unanimous in Sweden, where 100% of respondents said they do this. Poland was close behind at 82%. Spain, Italy, and Portugal are outliers, but the Preply team had a theory about why. There’s a generational split. Under-35s take their shoes off automatically, and people aged 35 to 54 wait for their host to ask them to remove their shoes. Another map shows these preferences across continents.
Click below to zoom.
Gifts: Bring Them in Most Cases
Over half of European respondents treat bringing a small gift to a gathering as standard, and a third save this for special occasions. Finland is the only country where people said they’d never bring a gift to any social gatherings. Married respondents were 12% more likely than single people to show up with something in hand.
Food: Rules Here Are Unanimous
The survey’s only unanimous result centered on food etiquette when eating someone else’s cooking. All 27 countries saw it as a sign of respect to eat all the food on your plate. Men were a little more likely (82%) to clear their plates than women (75%).
Punctuality: Fashionably Late Doesn’t Exist
In 23 countries, the clear preference was for guests to arrive on time. Greece is the most emphatic on this point at 78%. Four countries leaned toward arriving a bit early: Czechia, Germany, Poland, and, believe it or not, France. Single people were more likely to run late, and men were more likely than women to arrive at events early.
Why Etiquette Matters
People care about etiquette and pay attention to it. The #etiquette hashtag on TikTok has 4.4 billion views, and searches on how to have good etiquette are up 373%. While etiquette is important, it does vary among countries and cultures, so maps like Preply’s creations are a helpful guide for travelers.*
-
 Charts6 months ago
Survey Finds the Most Misheard Song Lyrics
-
 Charts6 months ago
Study Shows Where Americans Are Most Open to Age-Gap Dating
-
 Maps6 months ago
New Study Presents a State-by-State Look at Learning Styles
-
 Business Visualizations4 months ago
How the Top 25 College Majors Have Shifted: Student Choice’s 2026 Update
-

 Business Visualizations6 months ago
Study Examines Where People Think AI Will Improve Their Work Lives
-
 Maps6 months ago
Study Examines the Power of Phone Calls on Lonely Seniors
-
 Charts6 months ago
The U.S. Cities Where Renting Means Bracing for a Move
-

 Business Visualizations5 months ago
Which Countries Are Winning the Digital Infrastructure Race?