
Maps
Study Examines How Much Travelers Really Know About European Etiquette

Most travelers pack a few assumptions about other cultures alongside their passport. They might believe everyone in Europe greets each other with a kiss on the cheek, or that showing up a little late is chic, or that warmer languages and climates mean warm, touchy greetings. Preply surveyed 1,600 people across 27 countries, suggesting that many traveler instincts are wrong.
The Root of Assumptions
Preply first examined how people judge cultures before they arrive and participate in them. 3,608 adults in six countries rated how different languages sound. French won for sounding romantic (54%), and Italian was close behind at 43%. Portuguese and Spanish led for warmth, while English came in last at just 7%. The article argues that these impressions of language often shape a visitor’s real-world expectations, even if it doesn’t match etiquette, or indeed, reality.
Greetings: Let the Other Person Lead
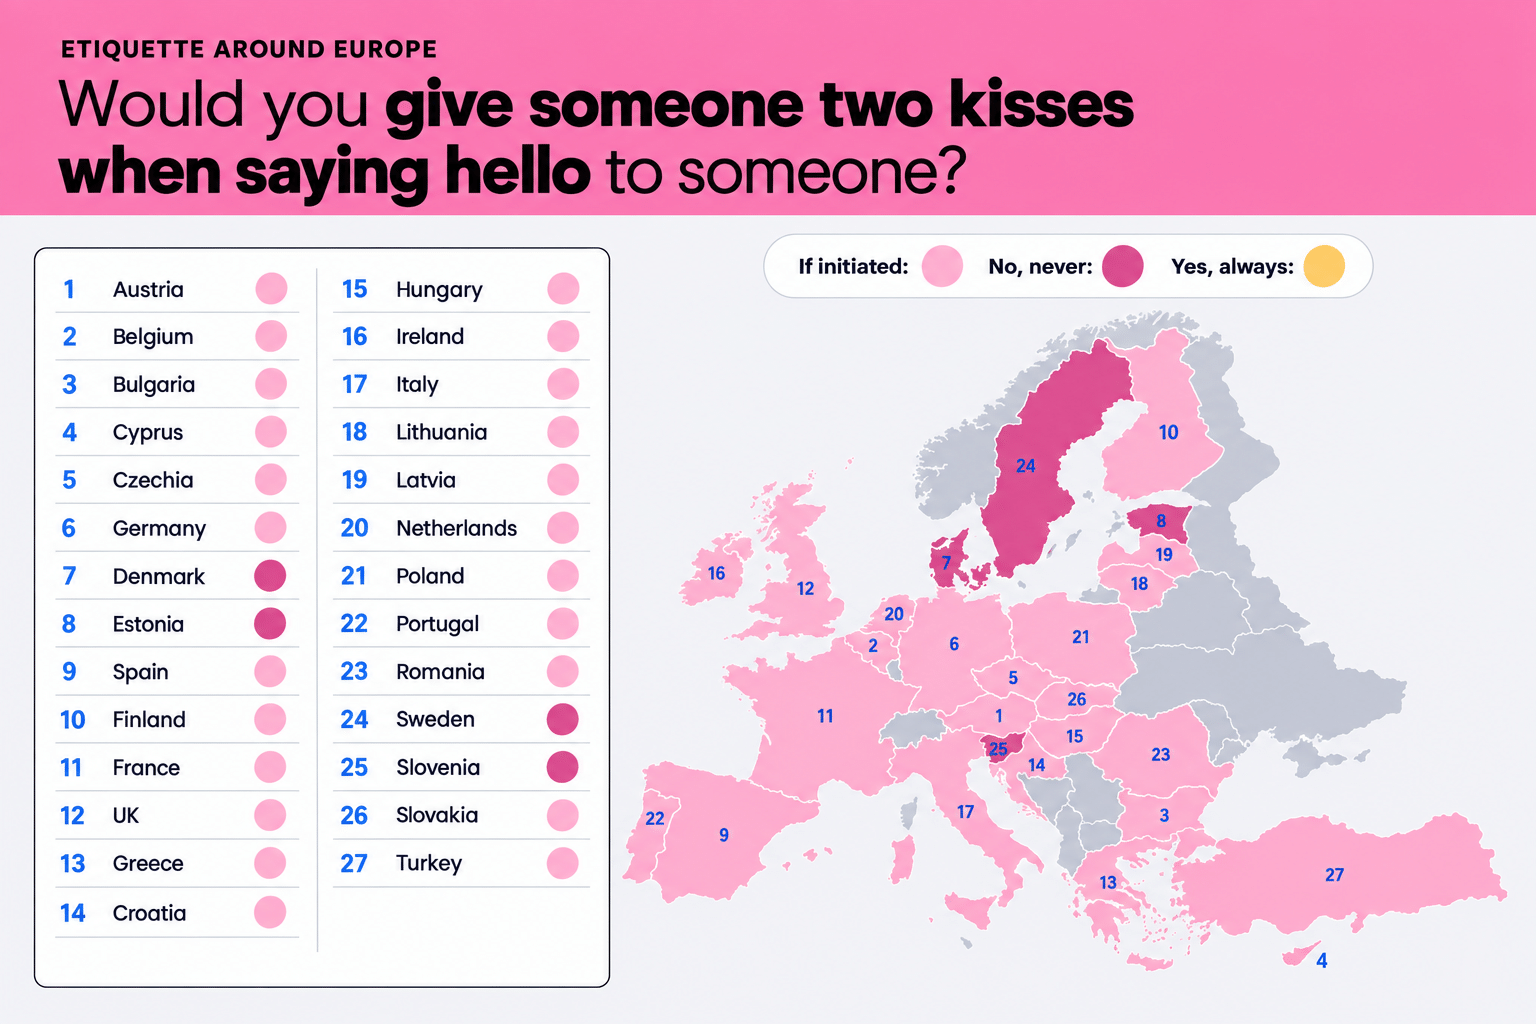
The double cheek kiss is Europe’s most famous greeting, but no one appears comfortable initiating it. In 23 out of 27 countries, most respondents said they’d only go in for it if the other person did first. Not a single country had a majority willing to initiate the double-cheek kiss. In Estonia, Denmark, Slovenia, and Sweden, people never do the cheek kiss. The article’s map shows exactly how each country lines up.
Click below to zoom.
Shoes: Leave them at the Door
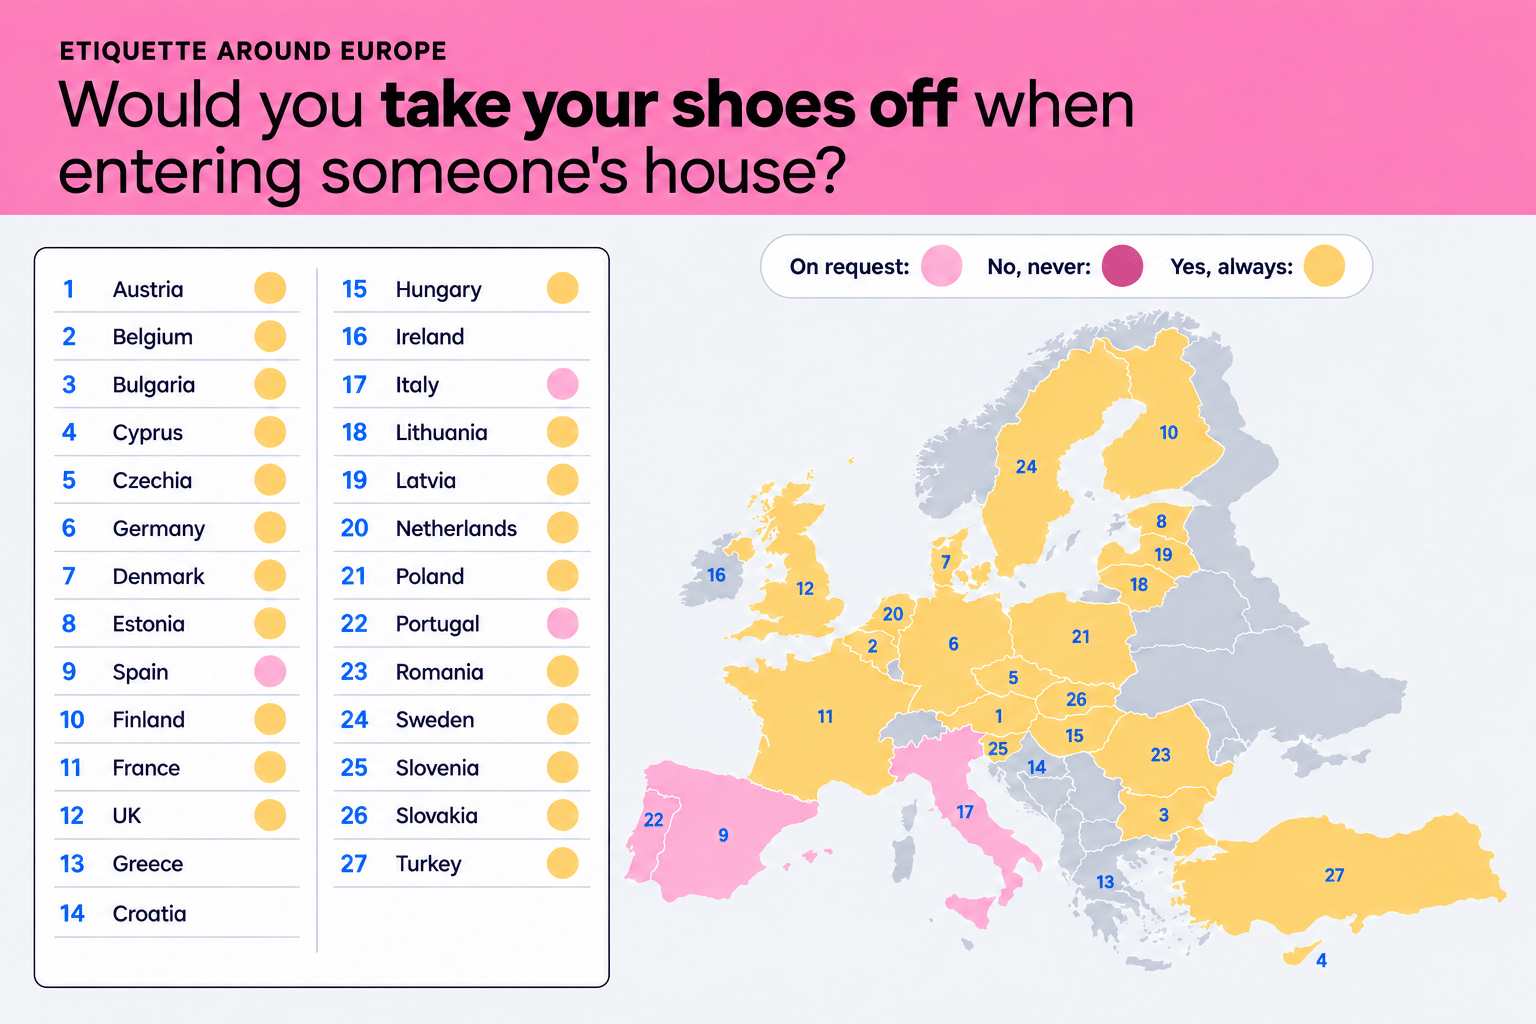
In 24 of 27 countries, the majority of people remove their shoes in someone else’s home. This was unanimous in Sweden, where 100% of respondents said they do this. Poland was close behind at 82%. Spain, Italy, and Portugal are outliers, but the Preply team had a theory about why. There’s a generational split. Under-35s take their shoes off automatically, and people aged 35 to 54 wait for their host to ask them to remove their shoes. Another map shows these preferences across continents.
Click below to zoom.
Gifts: Bring Them in Most Cases
Over half of European respondents treat bringing a small gift to a gathering as standard, and a third save this for special occasions. Finland is the only country where people said they’d never bring a gift to any social gatherings. Married respondents were 12% more likely than single people to show up with something in hand.
Food: Rules Here Are Unanimous
The survey’s only unanimous result centered on food etiquette when eating someone else’s cooking. All 27 countries saw it as a sign of respect to eat all the food on your plate. Men were a little more likely (82%) to clear their plates than women (75%).
Punctuality: Fashionably Late Doesn’t Exist
In 23 countries, the clear preference was for guests to arrive on time. Greece is the most emphatic on this point at 78%. Four countries leaned toward arriving a bit early: Czechia, Germany, Poland, and, believe it or not, France. Single people were more likely to run late, and men were more likely than women to arrive at events early.
Why Etiquette Matters
People care about etiquette and pay attention to it. The #etiquette hashtag on TikTok has 4.4 billion views, and searches on how to have good etiquette are up 373%. While etiquette is important, it does vary among countries and cultures, so maps like Preply’s creations are a helpful guide for travelers.*

As new technologies transform industries and create new skills demand, this analysis from Altium ranks states by how well their workforces are positioned to meet the future and a changing economy. The article, graphs, and maps show that tech readiness doesn’t always match a high-tech reputation.
Click below to zoom.
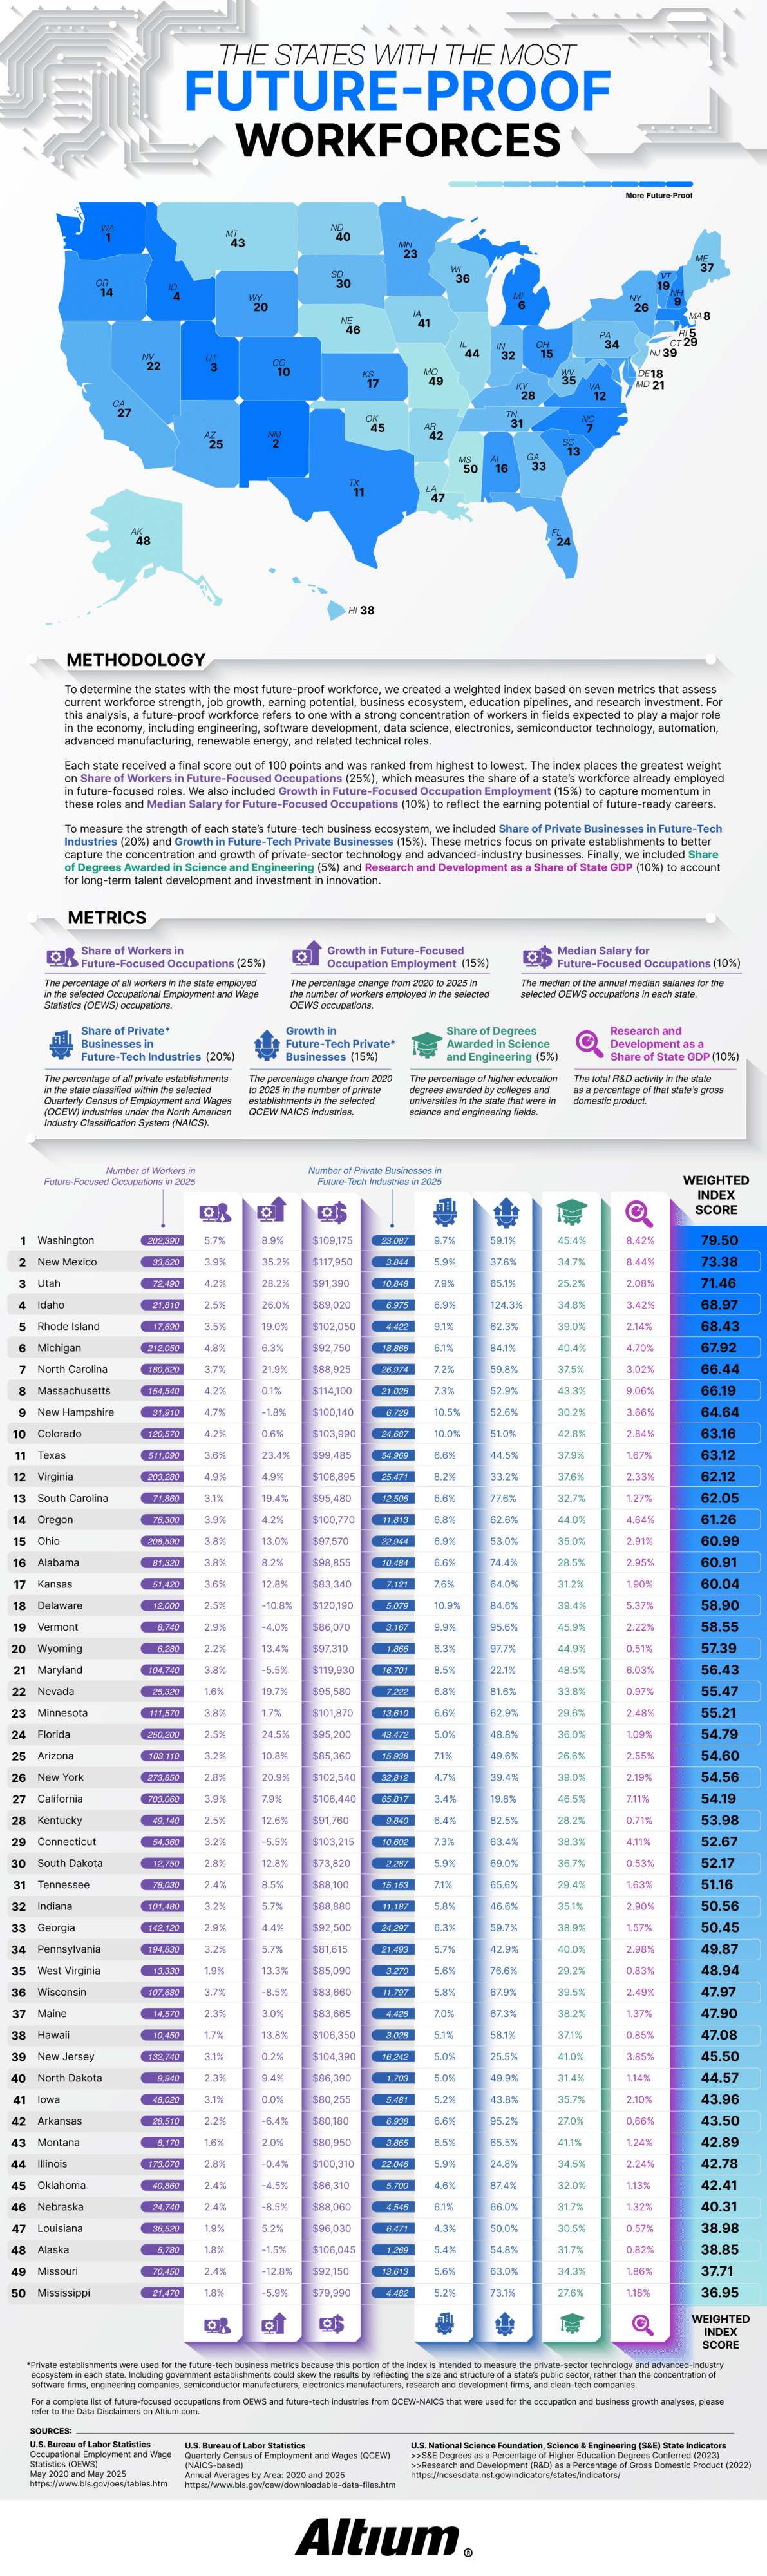
Altium defined a future-proof workforce as one with a large share of workers in fields expected to drive economic growth over the next few decades. The study tracked 30 occupations using data from the Bureau of Labor Statistics, including electrical and computer hardware engineers, software developers, data scientists, solar installers, semiconductor processing technicians, CNC programmers, and wind turbine technicians. The team considered 27 “future-tech” industries from aerospace to renewable energy to semiconductor manufacturing and R&D services.
Each state received a score out of 100 based on seven weighted metrics. The largest factor at 25% was the share of workers already employed in future-focused positions. The share of private businesses in future-tech industries was worth 20%. Employment growth and business growth from 2020 to 2025 counted for 15%. Median salary and research and development as a share of state GDP each accounted for 10%, and the share of science and engineering degrees made up the final 5%.
Washington took first place with a score of 79.50. Nearly 6% of the workforce there holds future-focused jobs and earns a median salary of $109,175. Washington’s future-tech businesses grew 59.1% over five years. The article credits the state’s concentration of software and aerospace employers, noting that Washington leads the nation in aerospace sales, exports, and employment.
The runner-up is more surprising! New Mexico ranked second, thanks to its 35.2% growth in future-focused employment. That’s the fastest growth rate in the country. Thanks to national laboratories and an expanding aerospace sector, it has one of the highest median salaries in the study at $117,950. Utah, Idaho, and Rhode Island round out the top five rankings. Idaho stood out for business expansion, with future-tech businesses growing by an eyebrow-raising 124.3%.
The study’s most confusing findings relate to California. The state employs 703,060 people in future-focused occupations, more than any other state, yet it only ranks at #27. Although California is strong in engineering education and R$D investment, future-tech industries make up only 3.4% of its private businesses. Its five-year business growth rate of 19.8% is the lowest in the nation.
Smaller states benefited when technology made up a larger slice of their economies. Rhode Island’s future-tech businesses represent 9.1% of its private sector and grew 62.3%. New Hampshire ranked ninth with the highest future-tech business share in the top ten at 10.5%. Rounding out the top ten were Michigan, North Carolina, Massachusetts, and Colorado.
Mississippi finished last with a score of 36.95, followed by Missouri, Alaska, Louisiana, and Nebraska. Several of these states saw a decline in future-focused occupations. The key takeaway is that a state’s headcount or Silicon Valley reputation alone doesn’t define its readiness for the future. A growing technical workforce and a dense base of tech businesses best position a state for the future.
Around 80% of Americans believe that learning a few words of the local language matters before they travel abroad. Only 58% of those Americans actually go so far as to learn some words. That twenty-two-point gap is the basis of Preply’s report on language anxiety and travel, supplemented by visuals to support the data on this anxiety.
The report opens on this contradiction between belief and action and sharpens the data. It shows that 40% of travelers admit to cramming language lessons at the airport or on the plane. Only 25% begin practicing the language of their destination months ahead of time. 32% side-step the problem entirely by choosing destinations where English is the dominant language or prevalent enough to carry travelers through.
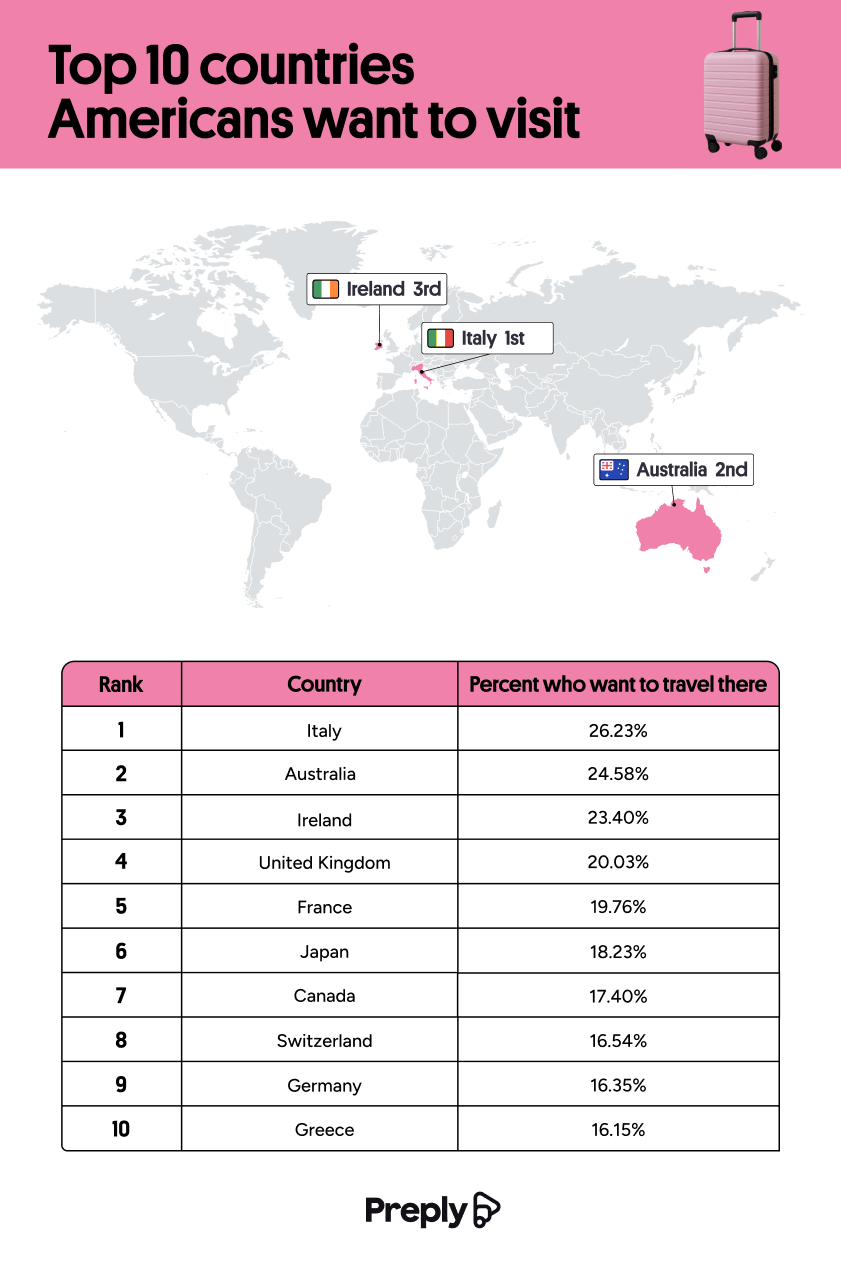
Two ranked charts are the center of the report and comparing their results offers eye-opening details. The first chart shows that in 2026, Italy topped the wish list of American travel destinations. Australia, Ireland, the UK, and France followed.
Click below to zoom.
 The second chart ranked where Americans would consider living. Australia and the UK tie at 20% of the answers, and Canada follows closely at 19%. Three of the top five travel destinations are largely English-speaking, and the relocation list you’ll note was entirely English-speaking.
Japan demonstrates this split dramatically. 18% of Americans would like to visit Japan, but only 10% would consider living there. Comfort clearly wins out over desire when it comes to relocation.
The demographic section shows even more interesting trends. Gen Z is nearly three times as likely as Boomers to want to visit Japan (24.4% versus 8.6%). They’re also more than twice as likely to consider living there (13.4% versus 5.3%). Ireland runs the opposite direction, with 26.2% of Boomers wishing to visit and only 9.8% of Gen Z. This is the biggest generational gap in the survey.
The pattern suggests that Boomers gravitate toward English-speaking destinations, while Gen Z showed stronger interest in places like Japan, Korea, Brazil, Colombia, and Thailand. Gender splits emerged too, with women favoring Italy, Ireland, and Greece, and men dreaming of Japan at 24% versus women’s 14%.
A horizontal bar graph ranks the barriers to visiting non-English-speaking destinations. 37% of Americans assume the native language is too difficult to learn. 35% believe English is understood well enough to get by without learning. 33% of respondents said they’re bad at learning languages, 32% cite lacking the time to learn, and 31% fear offending a native speaker by mistake. When ranking language intimidation by country, China led at 37%, Japan followed at 34%, then Korea at 24%, and Thailand at 13%.
A graphic on language faux pas showed that 35% of Americans point to menu items rather than attempting pronunciation, 23% speak louder and slower, and 17% buy American fast food for familiarity—only 15% attempt to mimic the local accent, which the Preply team gently discouraged.
The big takeaway seems to be that 45% of Americans would travel more if they spoke another language.

Moving into a first apartment is a rite of passage, but the math behind making it a reality is becoming a bigger obstacle. The metros with the strongest job markets also have the steepest living costs, and over the past few years, rent in these areas has climbed faster than paychecks. Cheap rent isn’t the only solution, though. Thin wages and flat hiring shut young people out of many cities.
Rove Lab’s new analysis identifies the cities in the middle ground with the most to offer young people establishing their lives. The study examined the 100 most populous U.S. metro areas and scored each one on 10 different metrics grouped into three weighted categories.
Click below to zoom.
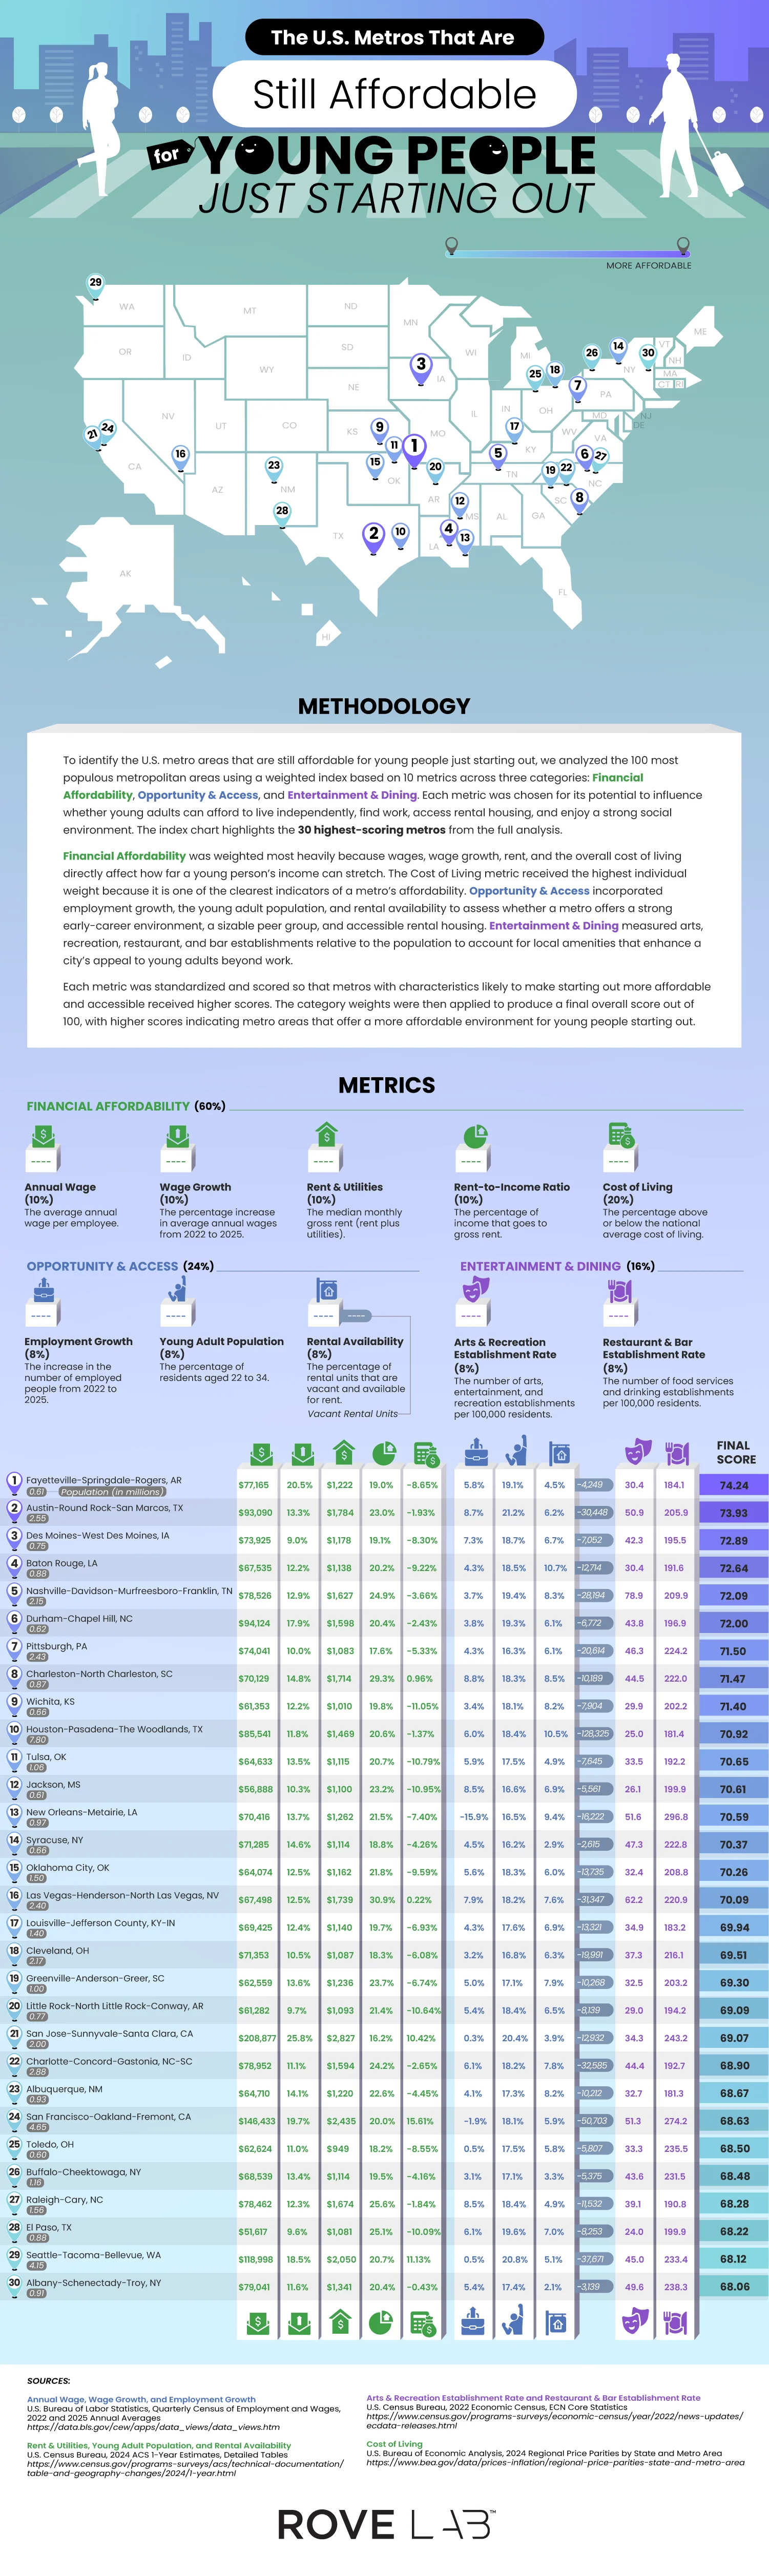
Financial affordability was the most important category, carrying 60% of the weight. This category covers average annual wage, wage growth, median rent and utility costs, rent-to-income ratio, and cost of living relative to the national average. Cost of living alone received 20% of the weight, the heaviest single metric in the study. Opportunity and access accounted for 24% and included employment growth, number of residents between 22 and 34, and amount of rental vacancy. The final 16% went to entertainment and dining, tracking the number of arts and recreation venues and restaurants and bars per 100,000 residents. Each metric was standardized, scored, and weighted into a final number out of 100.
The winning city was Fayetteville-Springdale-Rogers, Arkansas, with a score of 74.24. This isn’t an obvious winner until you look at the numbers. Wages increased by 20.5% from 2022 to 2025, with the average wage at $77,165 and a cost of living that’s 8.65% below the national average. This combination creates a rent-to-income ratio of 19%, leaving young people with money to save, potentially for the elusive dream of homeownership. Fortune 500 companies, Walmart, J.B. Hunt, and Tyson, have a home in the area and likely explain wage strength.
Austin-Round Rock-San Marcos followed with a 73.93 score, driven by a thriving tech sector that’s seen 8.7% employment growth, and the area offers 30,000 vacant rental units for newcomers. Des Moines, Baton Rouge, and Nashville round out the top five.
A few cities earned high rankings thanks to low housing costs. Pittsburgh was seventh overall with a rent-to-income ratio of 17.6%. Wichita, ranked ninth, has low rent and utilities and a low cost of living that’s 11.05% below average. Toledo, number 25 on the list, has the cheapest housing of all cities on the list, with an average of $949 a month.
The most surprising cities on the list are Californian. San Jose-Sunnyvale-Santa Clara ranks 21st, and San Francisco-Oakland-Fremont lands 24th, despite costs of living well above the national average. Salaries do the heavy lifting, averaging $208,877 and $146,433, respectively. This pulls down San Jose’s rent-to-income ratio to 16.2%, the lowest on the list.
-
 Charts2 years ago
Map Uncovers Countries with Most Powerful Passports
-
 Business Visualizations2 years ago
The Biggest Fortune 500 Company in Every State
-

 Business Visualizations1 year ago
The Biggest Employers by Industry
-
 Business Visualizations1 year ago
The Largest Companies in America That Are Still Run by the Person Who Founded Them
-
 Charts2 years ago
Study Highlights Disparity Between Homelessness Rates and Empty Housing
-

 Misc Visuals2 years ago
Exploring Science Fiction Technology That Became a Reality
-

 Charts1 year ago
New Study Reveals Details About American Intimacy
-
 Charts2 years ago
Study Determines Cities with Biggest Home Price Increases After COVID-19