
Business Visualizations
The Cities Where Young People Can Still Afford to Start Out

Moving into a first apartment is a rite of passage, but the math behind making it a reality is becoming a bigger obstacle. The metros with the strongest job markets also have the steepest living costs, and over the past few years, rent in these areas has climbed faster than paychecks. Cheap rent isn’t the only solution, though. Thin wages and flat hiring shut young people out of many cities.
Rove Lab’s new analysis identifies the cities in the middle ground with the most to offer young people establishing their lives. The study examined the 100 most populous U.S. metro areas and scored each one on 10 different metrics grouped into three weighted categories.
Click below to zoom.
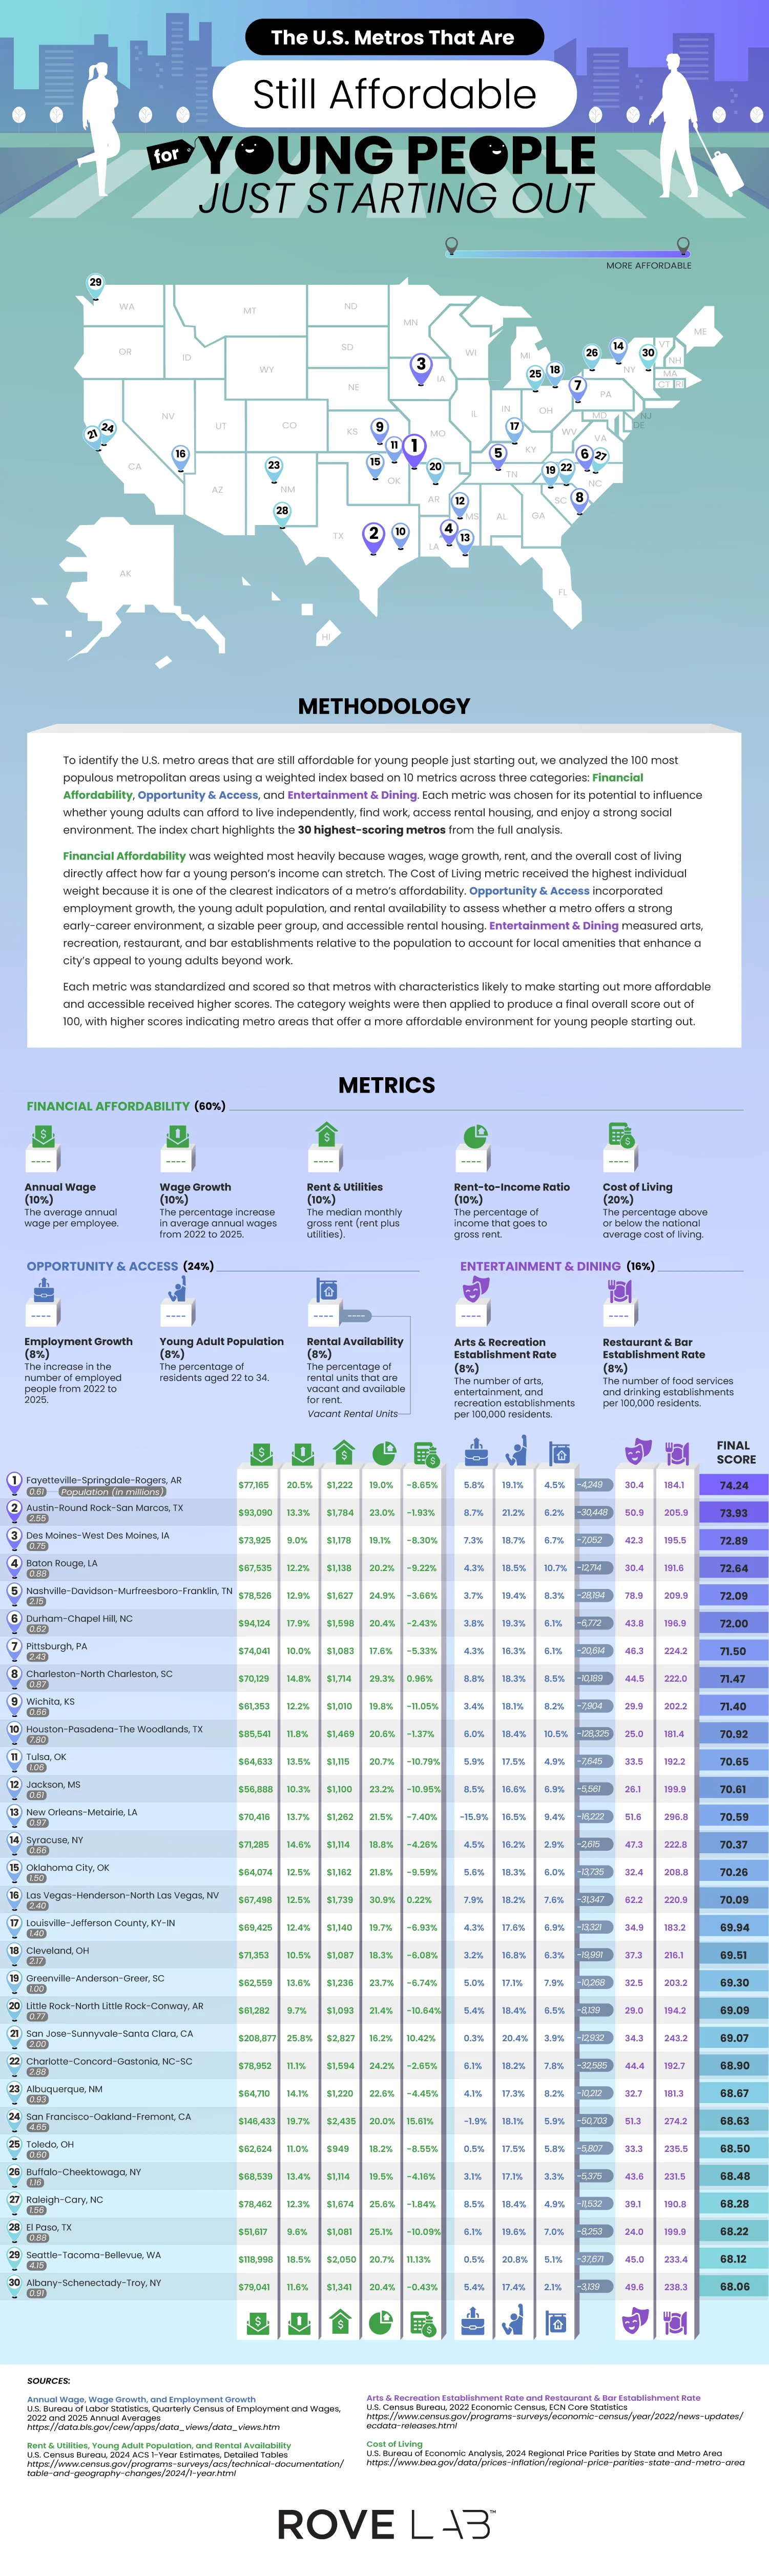
Financial affordability was the most important category, carrying 60% of the weight. This category covers average annual wage, wage growth, median rent and utility costs, rent-to-income ratio, and cost of living relative to the national average. Cost of living alone received 20% of the weight, the heaviest single metric in the study. Opportunity and access accounted for 24% and included employment growth, number of residents between 22 and 34, and amount of rental vacancy. The final 16% went to entertainment and dining, tracking the number of arts and recreation venues and restaurants and bars per 100,000 residents. Each metric was standardized, scored, and weighted into a final number out of 100.
The winning city was Fayetteville-Springdale-Rogers, Arkansas, with a score of 74.24. This isn’t an obvious winner until you look at the numbers. Wages increased by 20.5% from 2022 to 2025, with the average wage at $77,165 and a cost of living that’s 8.65% below the national average. This combination creates a rent-to-income ratio of 19%, leaving young people with money to save, potentially for the elusive dream of homeownership. Fortune 500 companies, Walmart, J.B. Hunt, and Tyson, have a home in the area and likely explain wage strength.
Austin-Round Rock-San Marcos followed with a 73.93 score, driven by a thriving tech sector that’s seen 8.7% employment growth, and the area offers 30,000 vacant rental units for newcomers. Des Moines, Baton Rouge, and Nashville round out the top five.
A few cities earned high rankings thanks to low housing costs. Pittsburgh was seventh overall with a rent-to-income ratio of 17.6%. Wichita, ranked ninth, has low rent and utilities and a low cost of living that’s 11.05% below average. Toledo, number 25 on the list, has the cheapest housing of all cities on the list, with an average of $949 a month.
The most surprising cities on the list are Californian. San Jose-Sunnyvale-Santa Clara ranks 21st, and San Francisco-Oakland-Fremont lands 24th, despite costs of living well above the national average. Salaries do the heavy lifting, averaging $208,877 and $146,433, respectively. This pulls down San Jose’s rent-to-income ratio to 16.2%, the lowest on the list.
If you were to ask the average American on the street to name the industries that power the national economy, they’ll likely reply “manufacturing” or “tech.” But the Bureau of Economic Analysis says otherwise. As Ooma’s study shows, real estate, rental, and leasing hold the biggest slice of the U.S. economy.
In 2024, the U.S. produced more than $29 trillion in economic output, which outstripped Germany, China, and Japan combined. Looking at how gross domestic product (GDP) breaks down by industry shows the value added by sector after subtracting the costs of the inputs that industry consumed. For example, a carmaker buys steel, rubber, and semiconductors. The value added is the difference between those purchases and the selling price of the finished car. Add up that gap, the value added across every industry in the country, and you arrive at the GDP.
Click below to zoom.
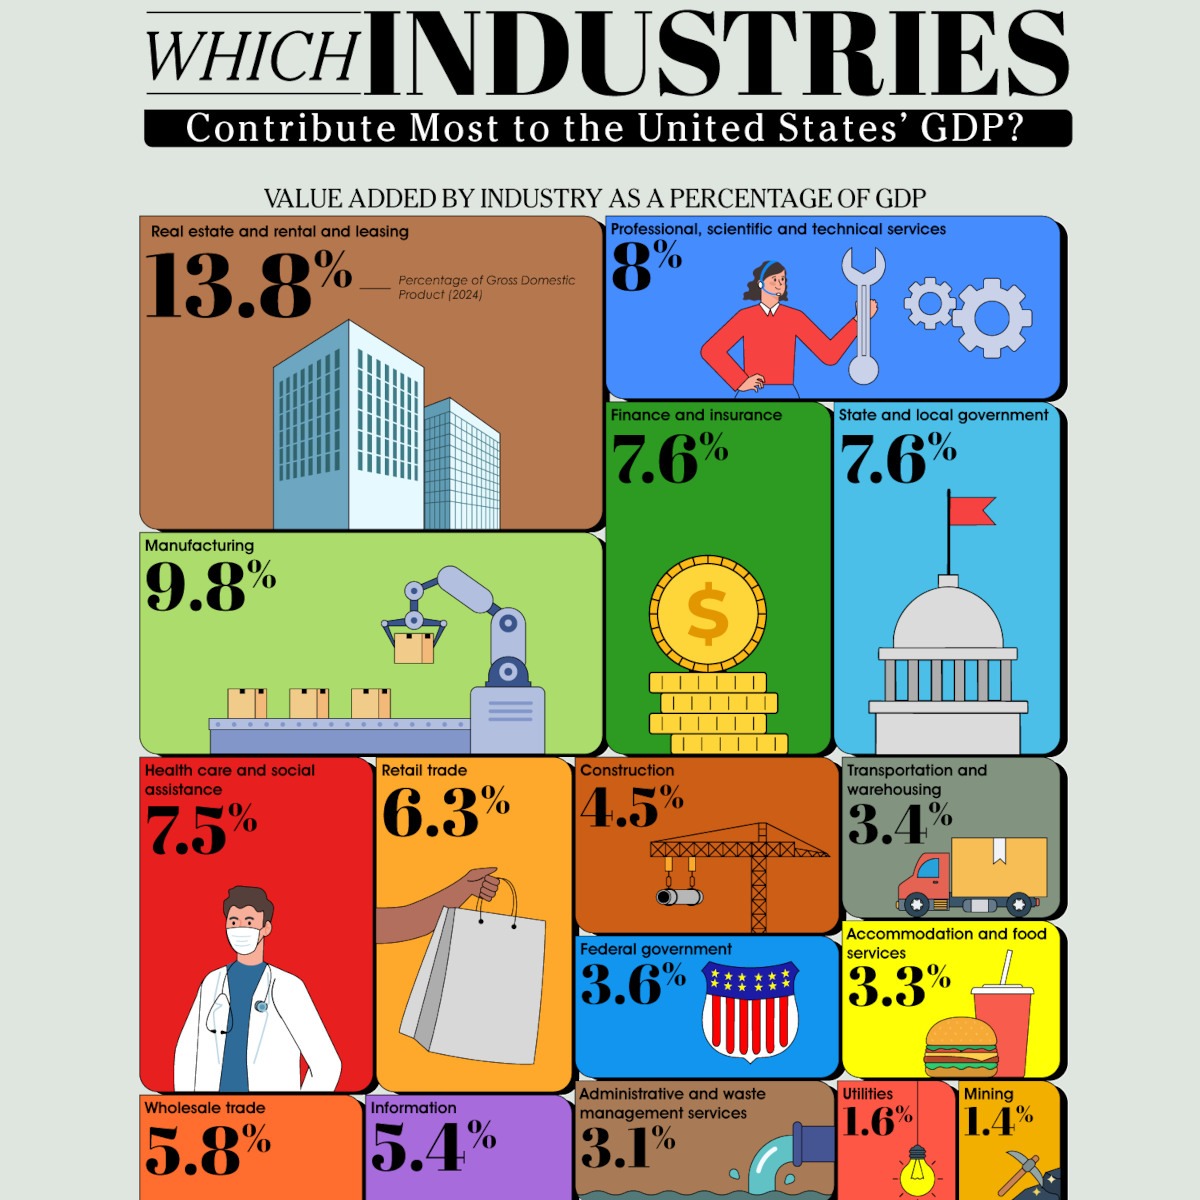
When Ooma ranked industries by their GDP, they found out that the money is concentrated in these industries:
Real estate, rental, and leasing – 13.8%: Real estate alone accounted for $3.68 trillion, the biggest of any sub-industry in the economy. Every mortgage payment, property tax bill, apartment lease, and commercial rent check pours into this sector. Rising home ownership costs over the past decade have pushed more citizens into renting, which has only inflated this industry.
Manufacturing – 9.8%: Factory employment has fallen for forty years due to automation and offshoring, but output hasn’t fallen. Chemical products created $554 billion, and computer and electronic products contributed $299.8 billion to the U.S. economy, helping keep the nation among the world’s top manufacturing nations despite a smaller workforce.
Professional, scientific, and technical services – 8.0%: This industry is made up of law firms, consultancies, engineering firms, and software developers. Legal services alone created $387.7 billion, and computer systems design added $552.2 billion to the American economy. This strongly shows how the American economy leans toward knowledge work.
Finance and insurance – 7.6%: Credit intermediation and Federal Reserve banks generated $1.01 trillion, insurance carriers contributed $791.8 billion, and securities and commodity contracts brought in $396.1 billion.
State and local government – 7.6%: Many rankings leave out these sectors, but government at the state and local level added $2.07 trillion, second only to real estate among all the sub-industries.
Health care and social assistance – 7.5%: Ambulatory care brought in $1.08 trillion and hospitals contributed $691.5 billion. This reflects genuine demand from an aging population and the fact that the U.S. spends more per capita on healthcare than any other developed nation.
Below these top-tier industries, retail trade, wholesale trade, information (Google, Meta, cloud providers, telecom), data processing, and internet publishing followed. Construction closed out the top ten industries at 4.5%, rising and falling in contributions with the real estate sector.
The largest components of American GDP aren’t the ones that produce a physical product. They’re the industries that manage property, deliver care, sell expertise, and move money.
Student Choice has published the 2026 updated version of its study, ranking the most popular college degrees by return on investment after five years in the workforce. The team’s premise is timely as they examine a hot topic: the cost of higher education. The average cost of college now exceeds $43,000 per year, so entering the workforce with these student loans became a high-stakes game. The analysis pairs the top 25 majors in 2026, based on a previous Student Choice study, with earnings data from the U.S. Bureau of Labor Statistics to calculate how much a graduate earns in their first five years relative to their four-year tuition investment. They illustrated their findings by ranking 20 degree types compared to 40 common occupations.
Click below to zoom.
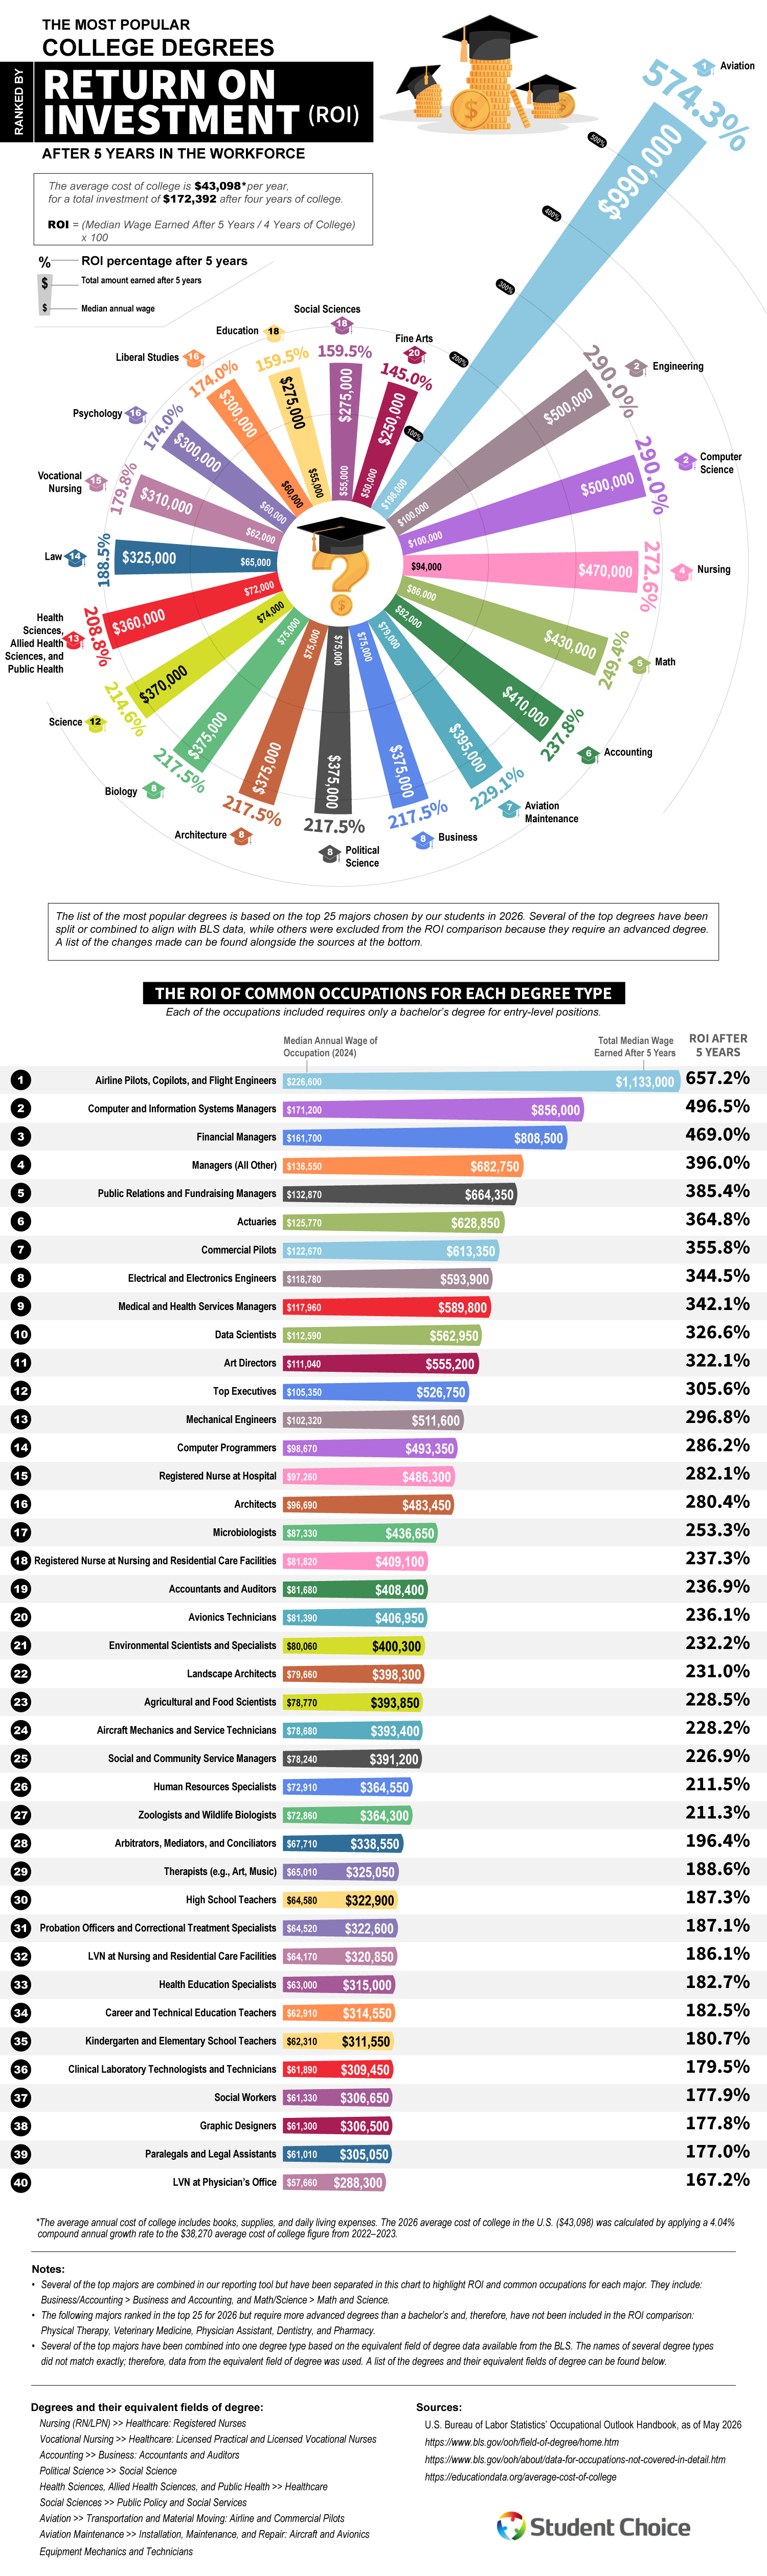
The team used a simple methodology. The average cost of college is $43,098 per year for a total investment of $172,392 for four years, with ROI calculated as median wages earned over five years divided by the four-year college cost. Majors that require advanced degrees like physical therapy, veterinary medicine, physician assistant, dentistry, and pharmacy were excluded from the ROI comparison even though these majors rank in the top 25.
Aviation tops the rankings chart, claiming the leading spot by a wide margin because of its astounding 574.3% ROI after five years, boosted by the median annual wage of $198,000. The field’s popularity is likely due to high pay and a looming pilot shortage as veteran airline workers retire. Engineering and computer science tied for second place at 290% each with median wages of $100,000 a year.
Healthcare and quantitative fields round out the upper tier. Nursing ranks fourth with an ROI of 272.6%, followed by math at 249.4% and accounting at 237.8%. Business, political science, architecture, and biology all tie for eighth at 217.5%, based on a $75,000 median wage. Education and social sciences sit near the bottom of the list at 159.5%, and fine arts at the bottom at 145%.
The study’s most helpful section might be the table that shows how career choice within a major can dramatically outperform the degree’s baseline. Aviation graduates who became airline pilots, copilots, or flight engineers reached a 652.7% return on a median wage of $226,600. Computer and information systems managers hit 496.5%, financial managers reached 469%, and public relations and fundraising managers reached 385.4%. Even lower-ranked majors can have exceptions. For example, fine arts majors who become art directors have a 322.1% return with a median salary of $111,040. Math majors working as actuaries earn 364.8%.
Overall, though, this study shows us that getting a degree pays off. Even accounting for student debt, the data suggests that degrees can double or triple the initial investment within five years. While most people will work for about four decades after student life, the returns will continue to compound. There is a growing preference for specialized, career-focused degrees with clear pathways into established professions so students can enjoy the ROIs we see here.
Student Choice has released the 206 updated version of its ongoing study tracking how America’s most popular college majors have changed over time. The analysis drew data from 105,623 student loan applications, using them as a proxy for where students are placing their bets on their future. The idea is that a student’s choice of major reveals more than their individual preferences. They can reflect labor shortages, salary expectations, emerging technologies, and shifting cultural attitudes about which degrees are most valuable. The team also supplied a graph comparing today’s top majors with those from four and eight years ago.
Click below to zoom.
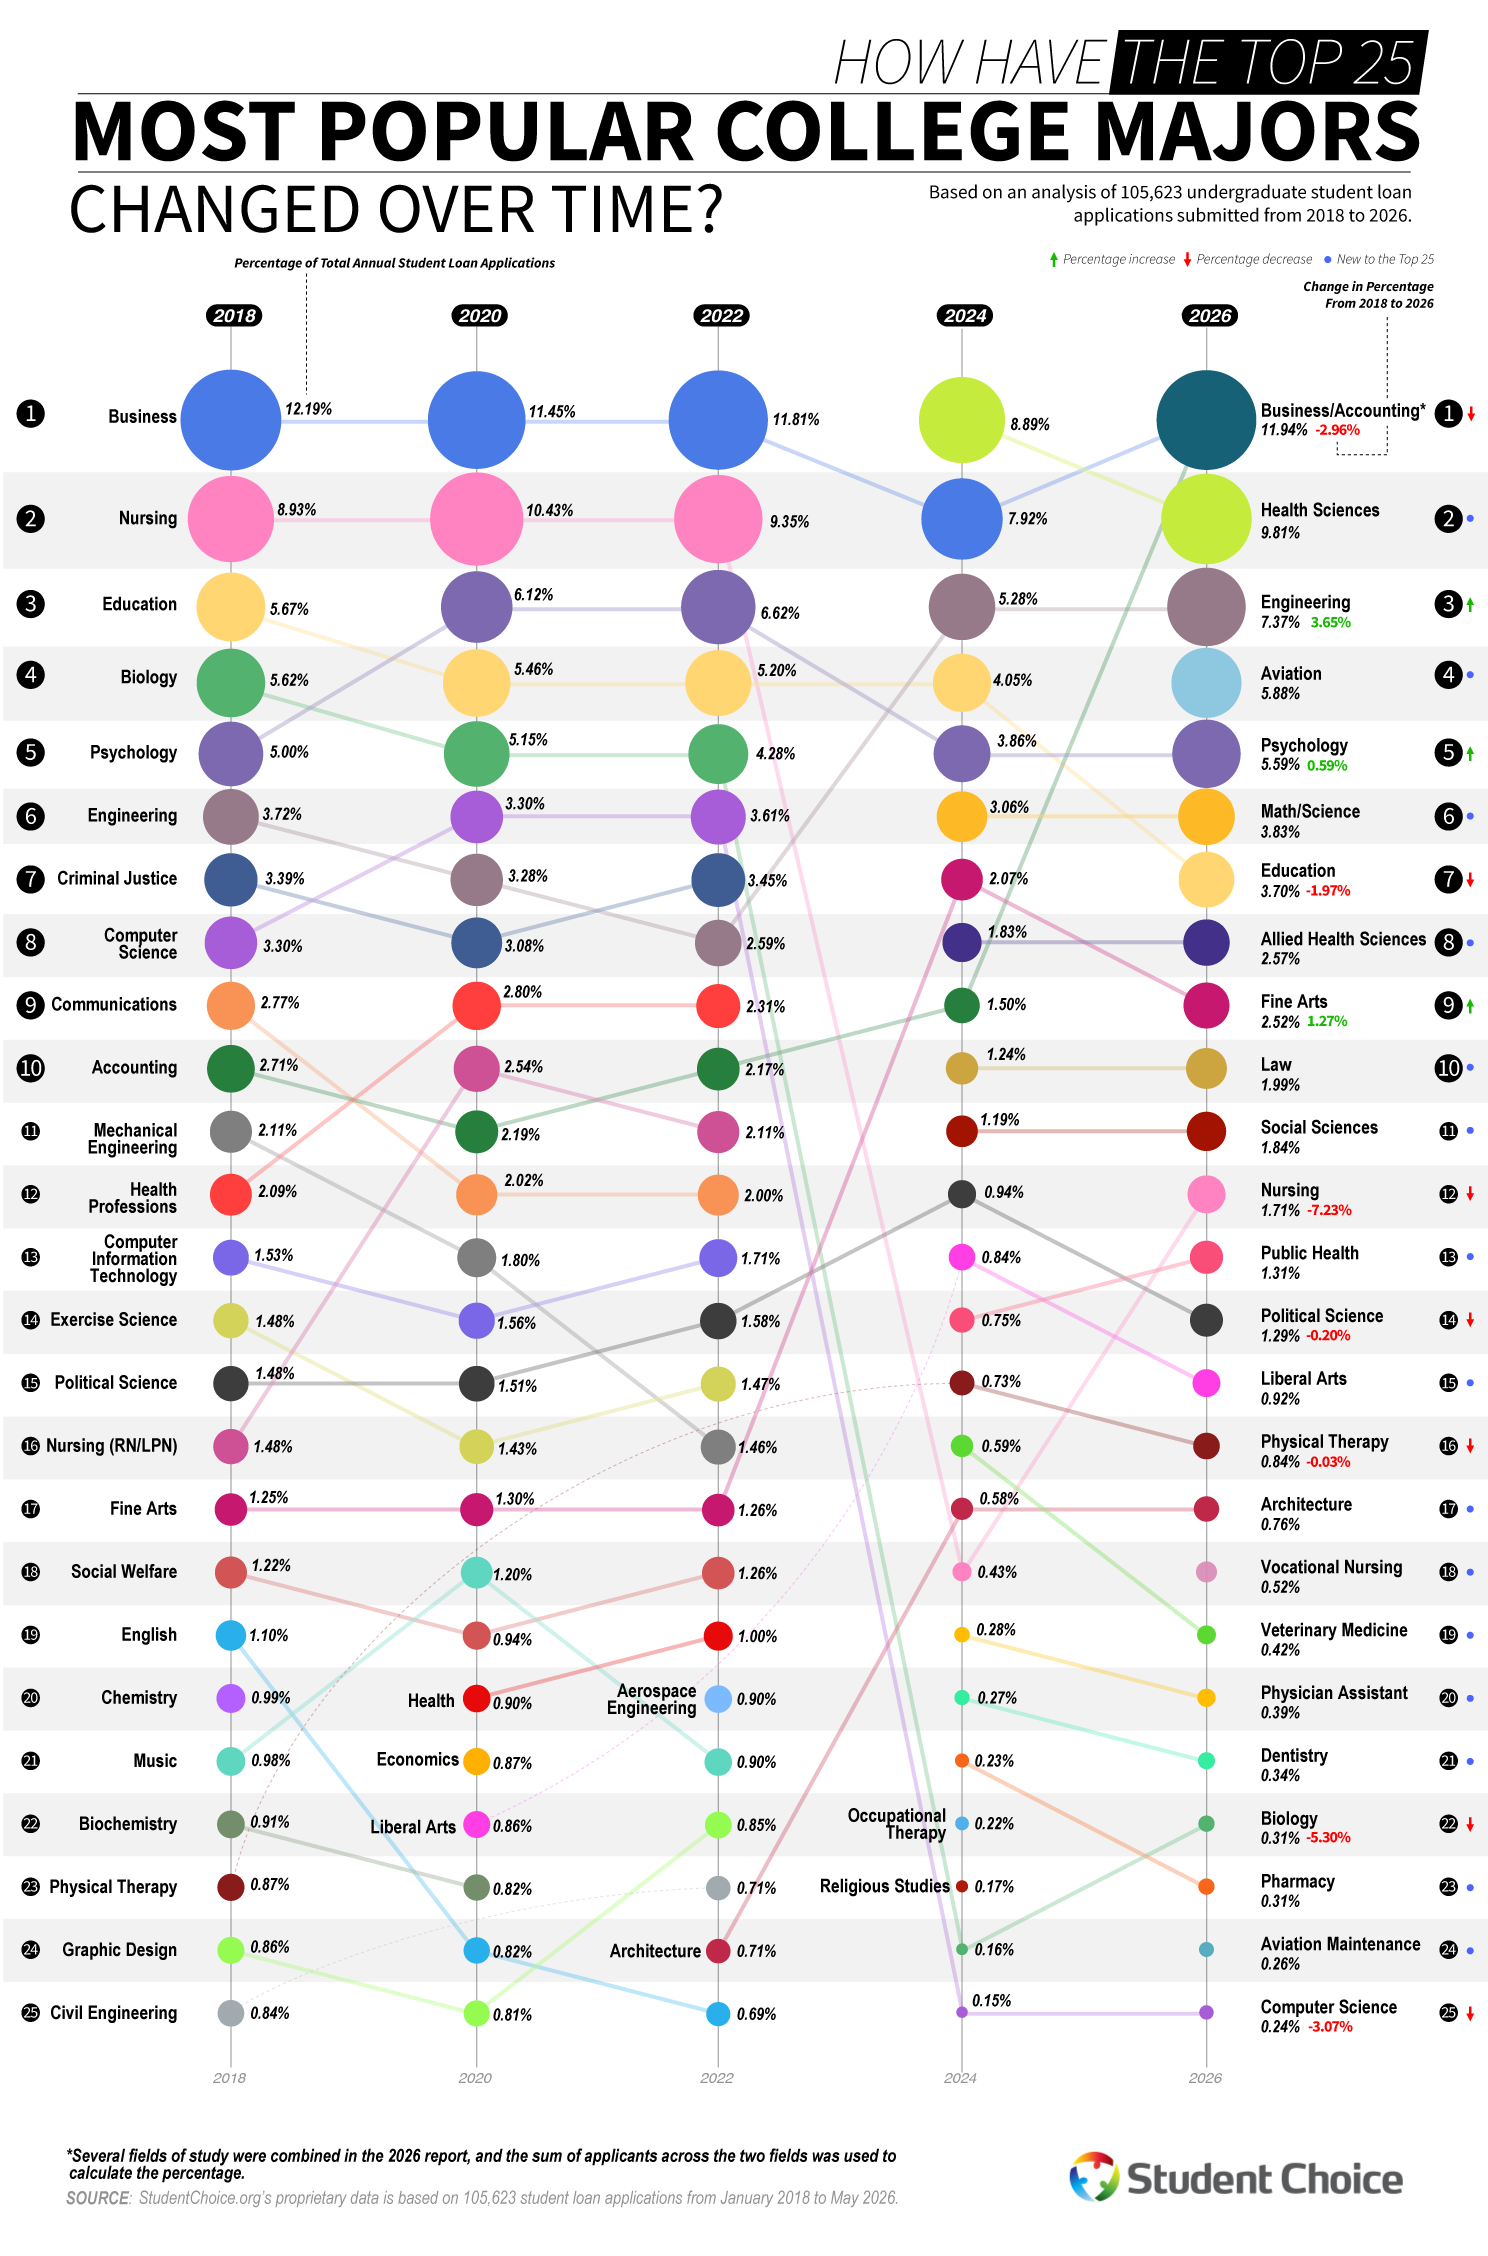
There has been a lot of disruption in recent years, but business majors have held steady. Business has been the leading major commanding between 11.45% and 12.81% of applications in 2017 and 2023. But that dominance has wobbled. In 2025, only 5.27% of applications were for a business major, but that percentage spiked back up in 2026 to 11.94%, still making it the most popular major.
Healthcare was consistently a top-two major for years, peaking in 2023 at 10.87% of applications. Now, nursing has tumbled to just 1.71% of applications in 2026. Health sciences replaced it to turn 9.81% with allied health sciences, public health, physical therapy, physician assistant studies, dentistry, and pharmacy, all landing in the top 25 of most popular majors.
The biggest growth seen in the study is in engineering and aviation. Engineering climbed from 3.91% to 7.37% in 2026. A 3.46-point gain is one of the biggest increases in this dataset. Aviation didn’t crack the top 25 of majors until 2025, when it had explosive growth, then settled into fourth place in 2026 at 5.88%. The surge in aviation maintenance rankings points to broader interest in the field, likely inspired by well-documented pilot shortages. When there’s a need, hungry young students will step up to fill it.
Psychology enjoyed modest and steady growth, inching from 4.99% in 2017 to 5.59% in 2026. Computer science took a surprising fall from a rising 3.61% to only .24% in 2026, ranking dead last in the top 25. Student Choice believes this could be due to some reporting category changes in 2025, but also speaks to the volatility of the tech job market.
Liberal arts and education lost ground, with education sliding from 5.99% of applications in 2017 to 3.70% in 2026. This decline is linked to teaching wages failing to keep up with other fields. Communications, English, and History all dropped off the top 25 entirely, yet Fine Arts bucked the trend, doubling in popularity from 1.35% to 2.25%, cracking the top ten most popular majors.
Overall, students are becoming more specialized and career-focused, drawn to healthcare, engineering, and aviation, while retreating from generalist majors and degrees that were once safe bets. The team at Student Choice cites finances as one of the biggest concerns central to a student’s decision on what major they choose
-
 Business Visualizations2 years ago
Everything Owned by Apple
-
 Business Visualizations2 years ago
America’s Most Valuable Companies Ranked by Profit per Employee
-
 Business Visualizations2 years ago
The Biggest Fortune 500 Company in Every State
-
 Business Visualizations1 year ago
The Biggest Employers by Industry
-

 Charts2 years ago
Map Uncovers Countries with Most Powerful Passports
-
 Business Visualizations12 months ago
The Largest Companies in America That Are Still Run by the Person Who Founded Them
-

 Timelines2 years ago
Timeline Charts the Development of Communications Technology
-

 Timelines2 years ago
The Evolution of Baby Names: A Century of Trends