Charts
Charting Brett Favre’s 508 Career Touchdown Passes
From 1992 through his retirement in 2010, there were very few Quarterbacks who were better than Brett Favre in the NFL. Over the course of his legendary career, the Pro Football Hall of Fame inductee and Green Bay Packers legend registered 71,838 passing yards and 508 touchdown passes. Not only that, but he was the NFL’s MVP three consecutive years in a row (1995-1997) and was elected to eleven Pro Bowls.
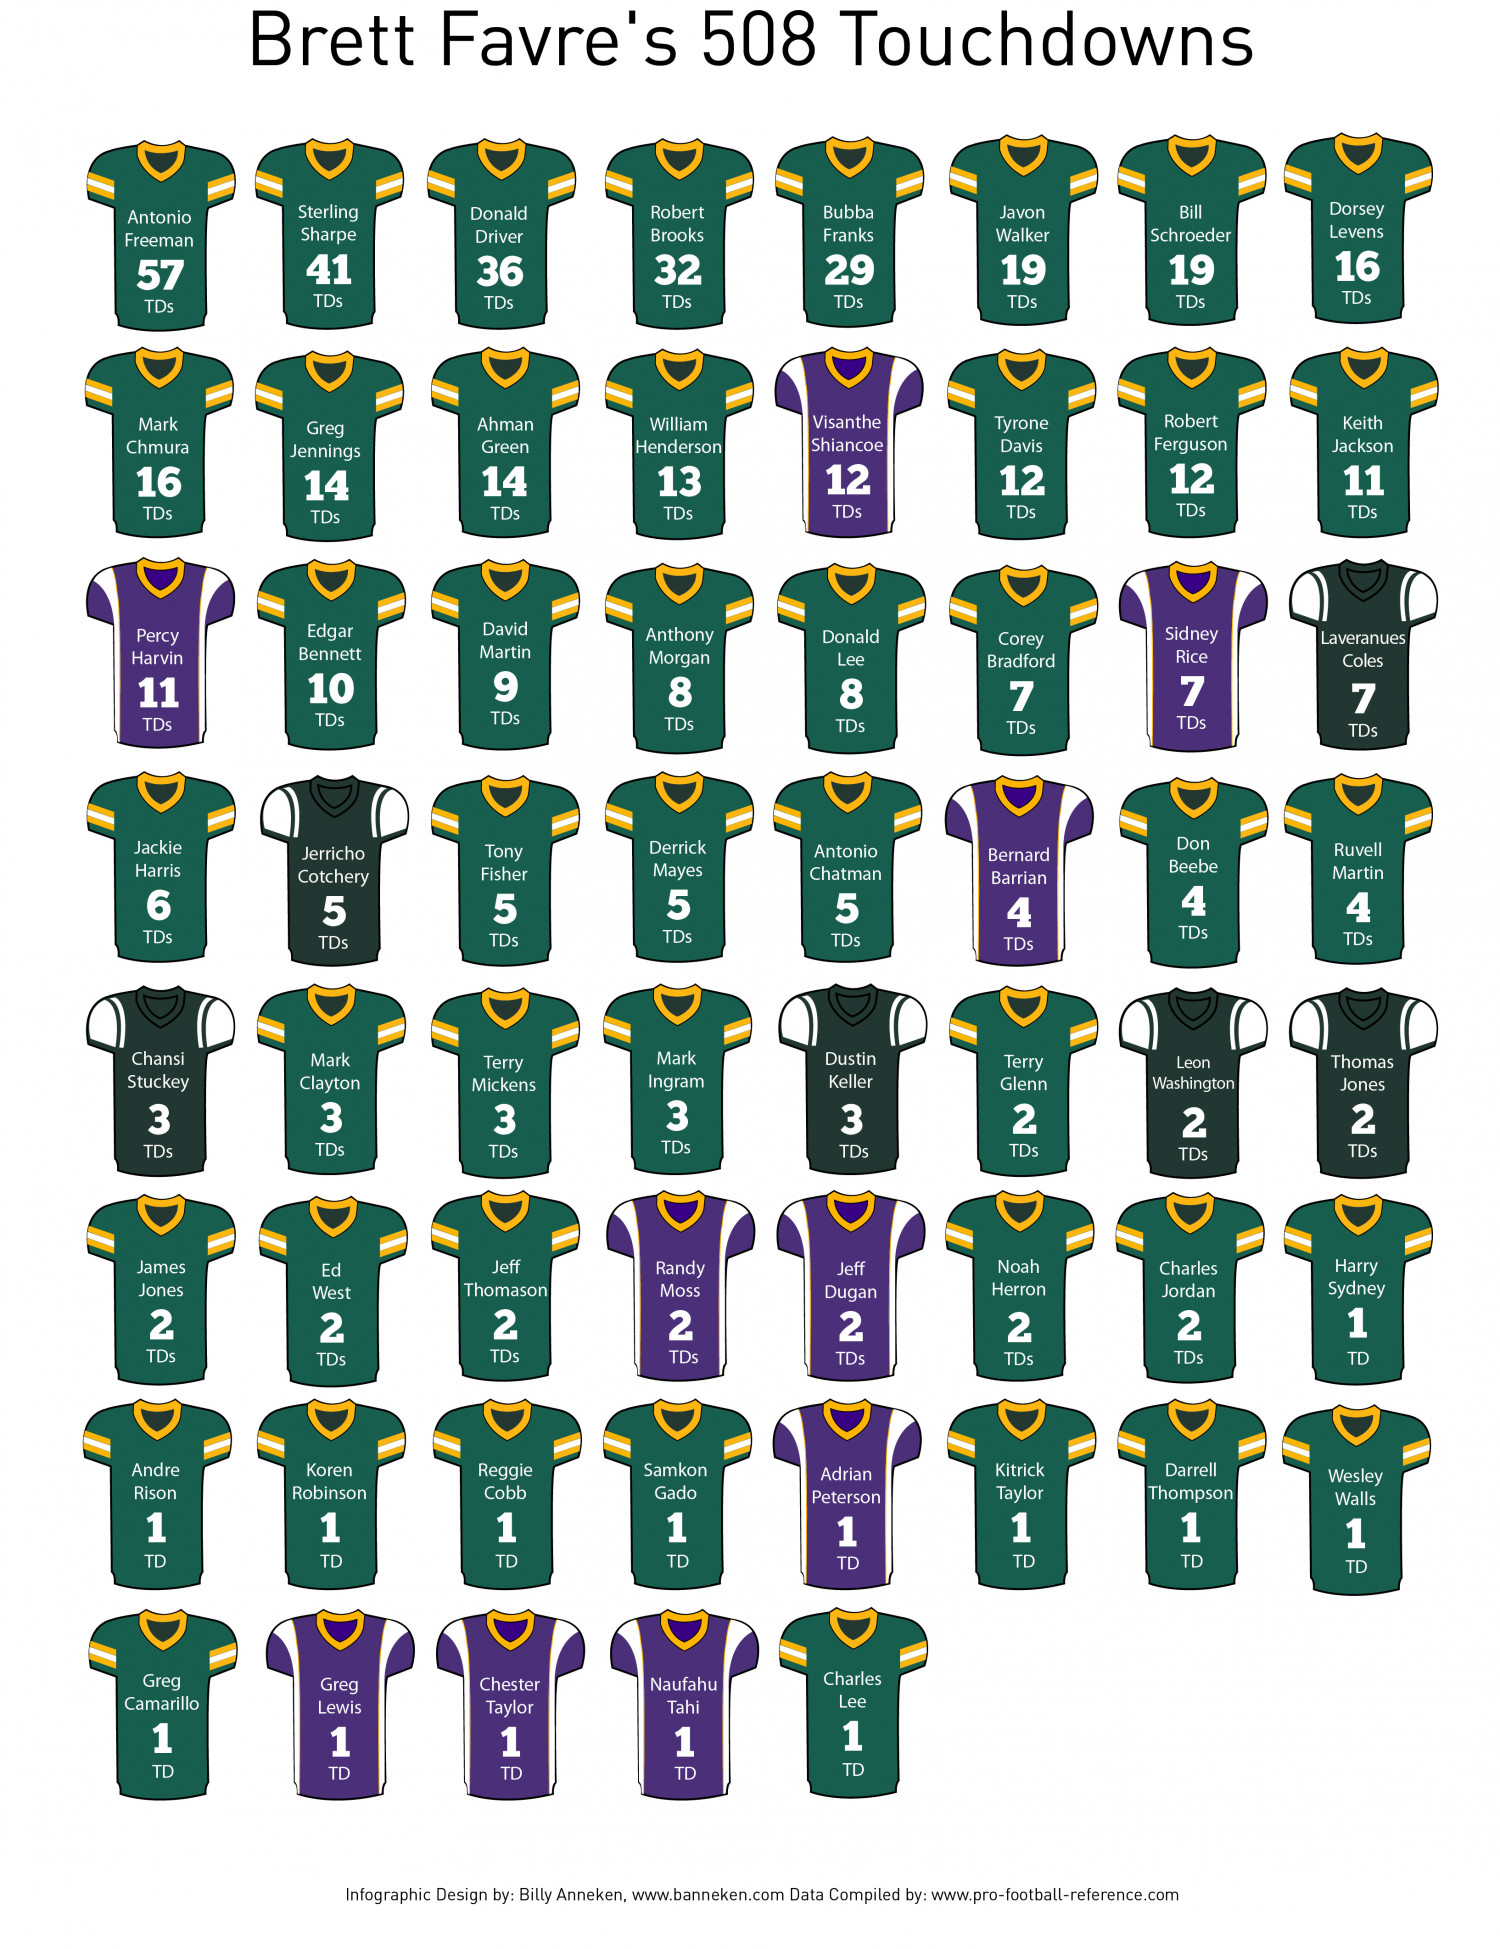
From Billy Anneken, this visual shows who caught touchdown passes from Brett Favre over #4’s career, which spanned 20 seasons in the National Football League.
Click below to zoom
Over the course of his storied NFL career, Brett Favre threw for 508 touchdown passes. Of these 508 scores through the air, a total of 61 players caught them across Favre’s stints with three different teams — the Green Bay Packers, the New York Jets and the Minnesota Vikings. His scores were spread across to six different Jets players, ten different Vikings players, and 45 different Packers players.
The player with the most touchdown receptions from Brett Favre was Antonio Freeman, who found the end zone on 57 occasions. Freeman was originally drafted by the Green Bay Packers in the third round of the 1995 NFL Draft, and would spend time with the Packers from 1995 – 2001. He would later have stints with both the Philadelphia Eagles and the Miami Dolphins. Today, Antonio Freeman is a member of the Green Bay Packers Hall of Fame.
Here are the receivers who caught touchdowns from the legendary Brett Favre, along with how many scores from the Hall of Famer.
- Antonio Freeman: 57 touchdowns
- Sterling Sharpe: 41 touchdowns
- Donald Driver: 36 touchdowns
- Robert Brooks: 32 touchdowns
- Bubba Franks: 29 touchdowns
- Jason Walker: 19 touchdowns
- Bill Schroeder: 19 touchdowns
- Dosey Levens: 16 touchdowns
- Mark Chmura: 16 touchdowns
- Greg Jennings: 14 touchdowns
- Ahman Green: 14 touchdowns
- William Henderson: 13 touchdowns
- Visanthe Schiancoe: 12 touchdowns
- Tyrone Davis: 12 touchdowns
- Robert Ferguson: 12 touchdowns
- Keith Jackson: 11 touchdowns
- Percy Harvin: 11 touchdowns
- Edgar Bennett: 10 touchdowns
- David Martin: 9 touchdowns
- Anthony Morgan: 8 touchdowns
- Donald Lee: 8 touchdowns
- Corey Bradford: 7 touchdowns
- Sidney Rice: 7 touchdowns
- Laveranues Coles: 7 touchdowns
- Jackie Harris: 6 touchdowns
- Jerricho Cotchery: 5 touchdowns
- Tony Fisher: 5 touchdowns
- Derrick Mayes: 5 touchdowns
- Antonio Chatman: 5 touchdowns
- Berrnard Barrian: 4 touchdowns
- Don Beebe: 4 touchdowns
- Ruvell Martin: 4 touchdowns
- Chansi Stuckey: 3 touchdowns
- Mark Clayton: 3 touchdowns
- Terry Mickens: 3 touchdowns
- Mark Ingram: 3 touchdowns
- Dustin Keller: 3 touchdowns
- Terry Glenn: 2 touchdowns
- Leon Washington: 2 touchdowns
- Thomas Jones: 2 touchdowns
- James Jones: 2 touchdowns
- Ed West: 2 touchdowns
- Jeff Thomason: 2 touchdowns
- Randy Moss: 2 touchdowns
- Jeff Dugan: 2 touchdowns
- Noah Herron: 2 touchdowns
- Charles Jordan: 2 touchdowns
- Harry Sydney: 1 touchdown
- Andre Rison: 1 touchdown
- Koren Robinson: 1 touchdown
- Reggie Cobb: 1 touchdown
- Samkon Gado: 1 touchdown
- Adrian Peterson: 1 touchdown
- Kitrick Taylor: 1 touchdown
- Darrell Thompson: 1 touchdown
- Wesley Walls: 1 touchdown
- Greg Camarillo: 1 touchdown
- Greg Lewis: 1 touchdown
- Chester Taylor: 1 touchdown
- Naufahu Tahi: 1 touchdown
- Charles Lee: 1 touchdown
Business Visualizations
New Research Shows Which Vehicle Makes and Models are Deadliest
Fatal accidents are all too common in the United States, but some crucial factors can affect whether an accident becomes deadly. One of those factors is the safety features of the vehicles involved. Makes and models aren’t equally safe, and the research conducted by the team at Convoy Car Shipping makes this grim fact clear.
The research used data from government organizations to study the statistics on which vehicles were involved in fatal accidents and how many fatal accidents a given vehicle was involved in compared to number of them on the road. The results give us a balanced look at which makes and models have the worst track record of fatal accidents.
Click below to zoom
The research shows that these vehicles are the deadliest:
- Ford Ranger
- Jeep Cherokee
- Dodge Charger
- Nissan Maxima
- Ford Taurus
- Ford Mustang
- Chevrolet Camaro
- Chevrolet Blazer/Tahoe
- Chevrolet Silverado
- Ford Expedition
American-made vehicles aren’t looking safe when we consider the number of Ford and Chevy models on this top ten list. Examine the data to find information on even more vehicles. You’ll also see that this make/model list differs from overall crash statistics. The broader picture proved Harley Davidson motorcycles to be the second most deadly vehicles. We think that this skews the story the data tells because motorcycles have far fewer safety features than cars and trucks. The team at Convoy Car Shipping should be applauded for their attention to detail that considers the unequal safety standard on cars and trucks versus motorcycles. The research gives us all possible data so that vehicle owners can draw their own conclusions.
Charts
Visualizing the Cost Per Ounce of the World’s Most Valuable Metals
The team at Kylar Mack shows us just how valuable the world’s most precious metals are with this illustrated chart visualizing the cost per ounce of the most expensive metals and alloys. A metal is naturally occurring, and many appear on the periodic table of elements whereas an alloy combines two elements.
On this illustrated chart, we can truly visualize the comparative value of these metals because the team stacked money representative of the value beside an image of each metal. The chart is a great example of the power of visual data. Our eye is immediately drawn to the vast stacks of cash beside the most valuable metal, Californium. These stacks tower above ever other metal on the chart making it clear that not all metals are created equal.
Click below to zoom
Californium’s value is a shocking $765,436,299 per ounce! That’s significantly higher than the second-most popular metal, a non-synthetic called Iridium, which is valued at $4,700. The key to the value difference lies in the fact that Californium is a synthetic substance. It’s created in a nuclear reactor and only two plants in the world have the capability of engineering it. As for Iridium, it’s naturally occurring but hard to mine and access. It’s found deep under the Earth’s crust, often attached to asteroids. Through this chart, we can learn more about different metals as well as why they’re so highly valued. Many are needed for key electronics and aerospace parts.
Charts
Mapping Spam Call Hot Spots Around the Country
Spam calls are a widespread problem that can be a nuisance or leave important information vulnerable to scammers. This map from Ooma shows us that although spam calls are widespread, they seem to have concentrated hot spots around the nation.
The Ooma team used data from the Federal Communications Commission to pinpoint where the highest number of spam calls are occurring. The data is based on the number of spam call complaints the FCC receives per capita. The team highlighted each city with the highest number of calls and shows in a graph below the map how many spam calls complaints are received per 1,000 people. The map is a detailed look at where spam calls are concentrated, giving us an interesting look at the data. If you live near one of these hot spots, be wary of answering the phone.
Click below to zoom
These were the cities that had the highest number of spam call complaints per capita:
- Alexandria, Virginia: 22.84
- Pittsburgh, Pennsylvania: 18.75
- Orlando, Florida: 18.52
- Miami, Florida: 17.58
- Atlanta, Georgia: 16.39
- Las Vegas, Nevada: 16.12
- Knoxville, Tennessee: 15.18
- Plano, Texas: 14.91
- Washington, District of Columbia: 14.46
- Columbia, South Carolina: 14.44
Alexandria, Virginia, tops the list with the highest number of spam call complaints. The city has received so many that local police have had to put out spam call warnings and prevention tips. Seeing such high concentrations of spam calls definitely leads to interesting questions about why these areas might receive more calls than others.
Be sure to check the map carefully and take note of whether your area is near is near one of these locations.
-

 Business Visualizations4 weeks ago
Everything Owned by Apple
-
 Maps2 years ago
The Population Density of Europe (and the World) in Two 3-D Maps
-
 Maps1 year ago
The Most Popular Surnames in Countries Around the World
-

 Maps2 years ago
Where Have The Most Shipwrecks Occurred?
-

 Business Visualizations2 years ago
The Most Popular Board Games Based on Units Sold
-
 Maps2 years ago
The World’s Most Expensive Buildings in One Chart
-
 Charts2 years ago
Which Country Produces the Most Oil?
-
 Business Visualizations2 years ago
New Maps Show the Most Popular Beer by State

