Business Visualizations
Study Shows Us the Most Common Occupations by Age Group
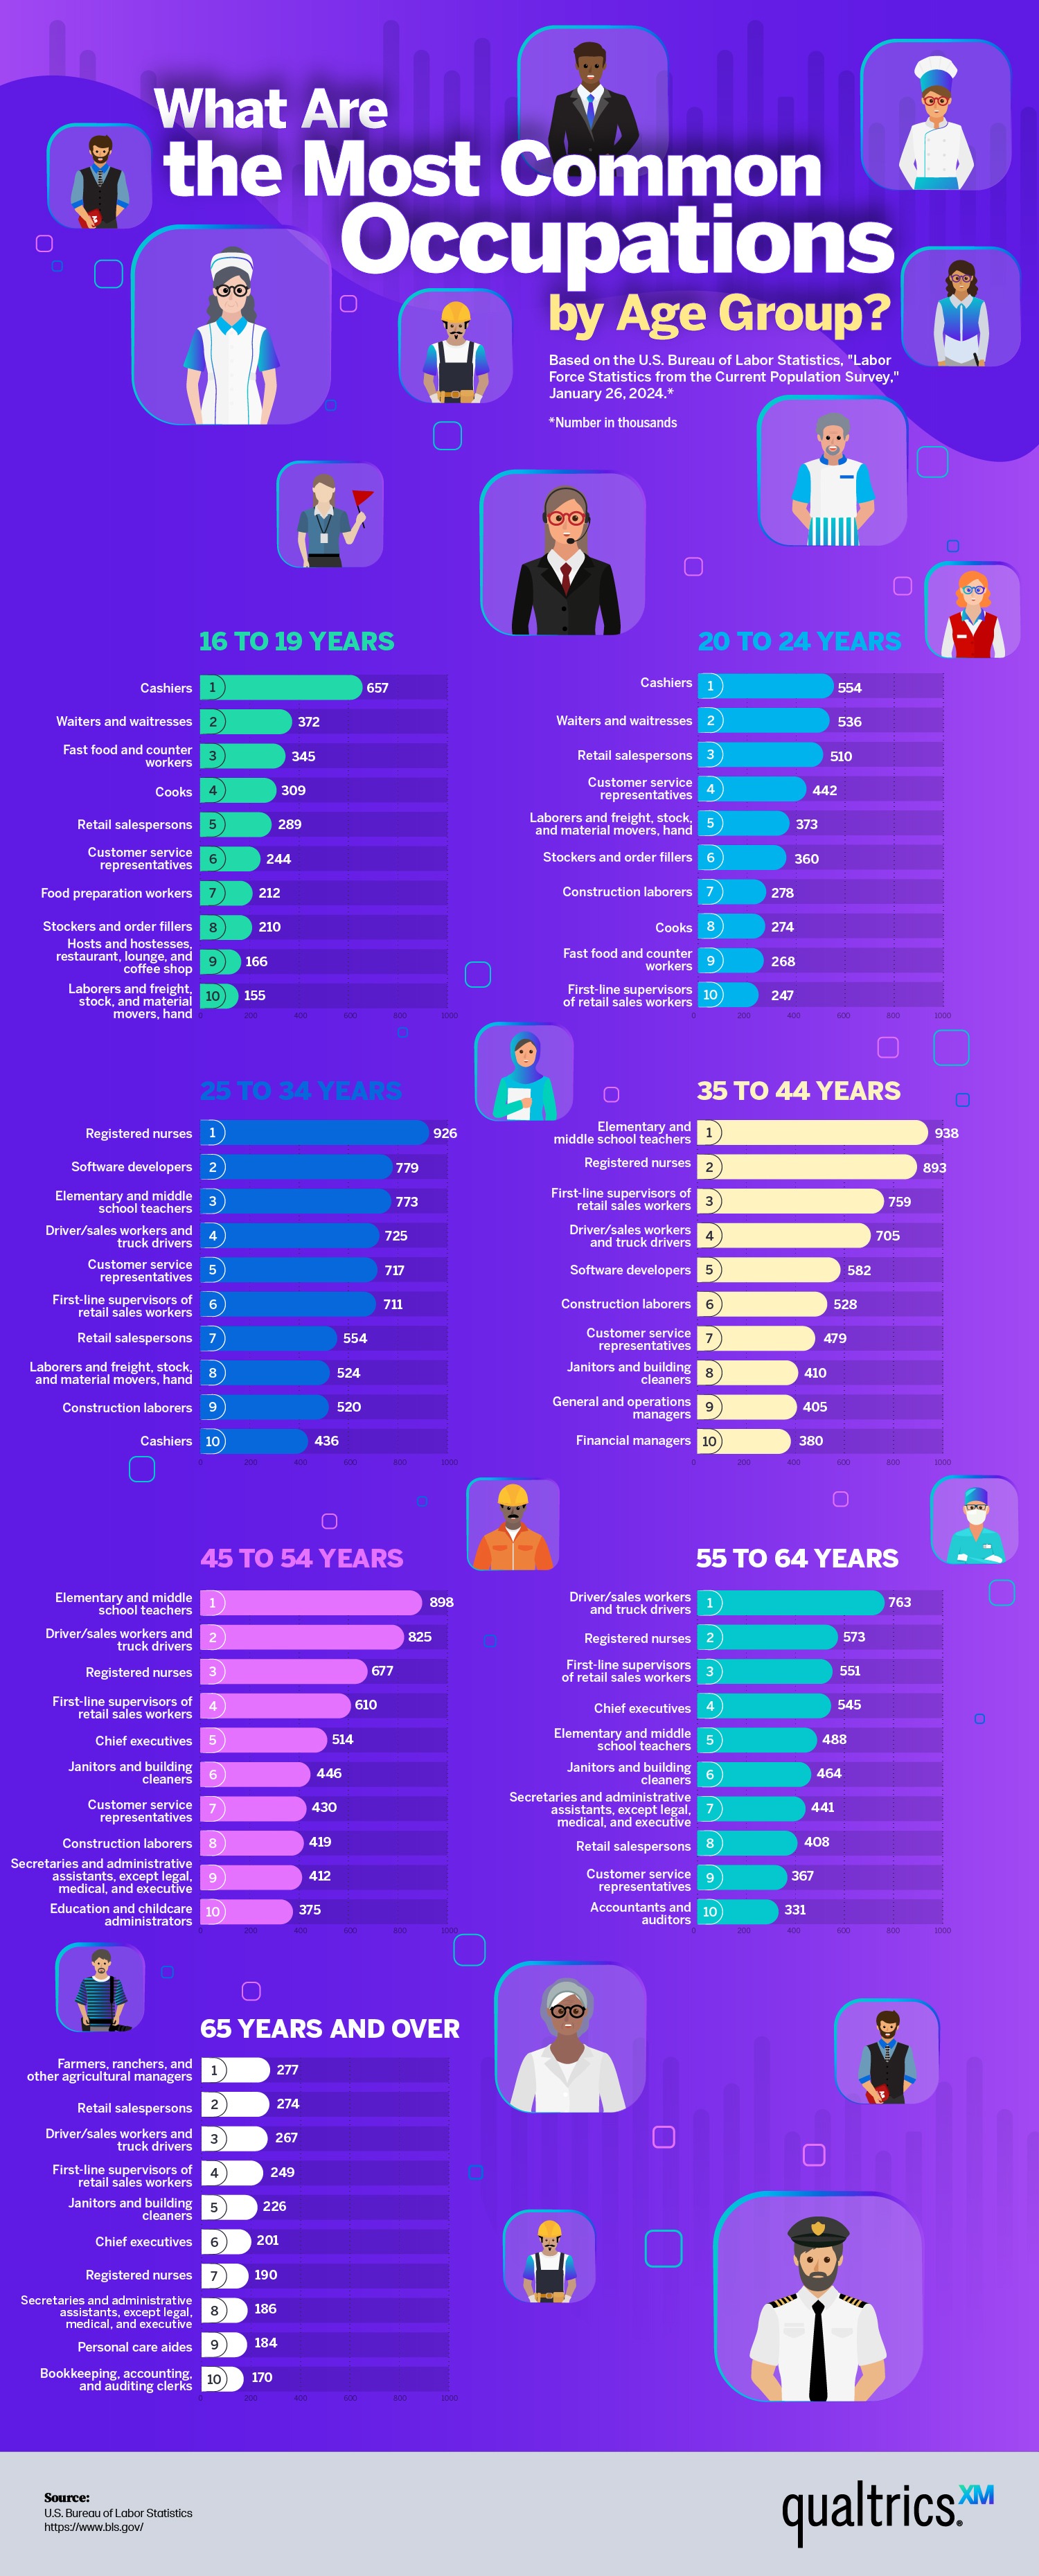
Studying jobs by age groups provides insight into worker priorities and the impact of factors such as education, experience, and physical strength. The team at Qualtrics gathered data to create a graphic of the most common jobs held in different age categories using data from the Bureau of Labor Statistics to form their visualizations.
Click below to zoom.
Here are the most common jobs by age:
- 16–24: cashier
- 25–34: registered nurse
- 35–54: elementary or middle school teacher
- 55–64: sales worker or truck driver
- Over 65: farmer, rancher, or agricultural manager
- Any age group overall: customer service representative
The chart shows that the most common job is a customer service rep, which is understandable given the number of industries hiring for this position. It’s a job with diverse tasks encompassing customer experience and quality of interactions with the business. Customer service jobs typically don’t require more than a high school diploma, yet they pay an average annual salary of over $60,000.
We can see from the charts that cashier and server jobs are most common among the youngest demographics. This is likely due to the low pay and hours spent on your feet. It’s an entry job for many people who grow to move on to different positions or career paths as they age and change priorities. While that’s not always the case, many servers and cashiers move on from the role in search of higher pay and less physically demanding work.
These same individuals may go on to pursue careers as teachers and nurses, if our data is any indication. These jobs require specialized education but offer higher pay, and there is a demand for these positions. It’s no surprise that many people are building lifelong careers in nursing and teaching. As for people who keep working past retirement age, farmers and ranchers took the top spot. This work is often physically demanding, but the businesses are usually generational, meaning older people get help from their descendants and stay involved with a business close to their heart.
Employers can make use of data like this, as they generally want to avoid job-hopping employees. Looking at these statistics, we can infer many reasons why someone may leave a job. Employers can address this by offering higher wages, more flexible work styles and arrangements, and an improved employee experience. Most workers seek a stable job with fair compensation for the amount of work and education required. We also note that many blue-collar jobs are represented on this list, including construction workers, janitors, and truck drivers, with fewer white-collar jobs listed. Many people work essential jobs that help us stay healthy, fed, and stocked with goods.
Business Visualizations
Most Mattress Brands Are Owned by a Handful of Companies
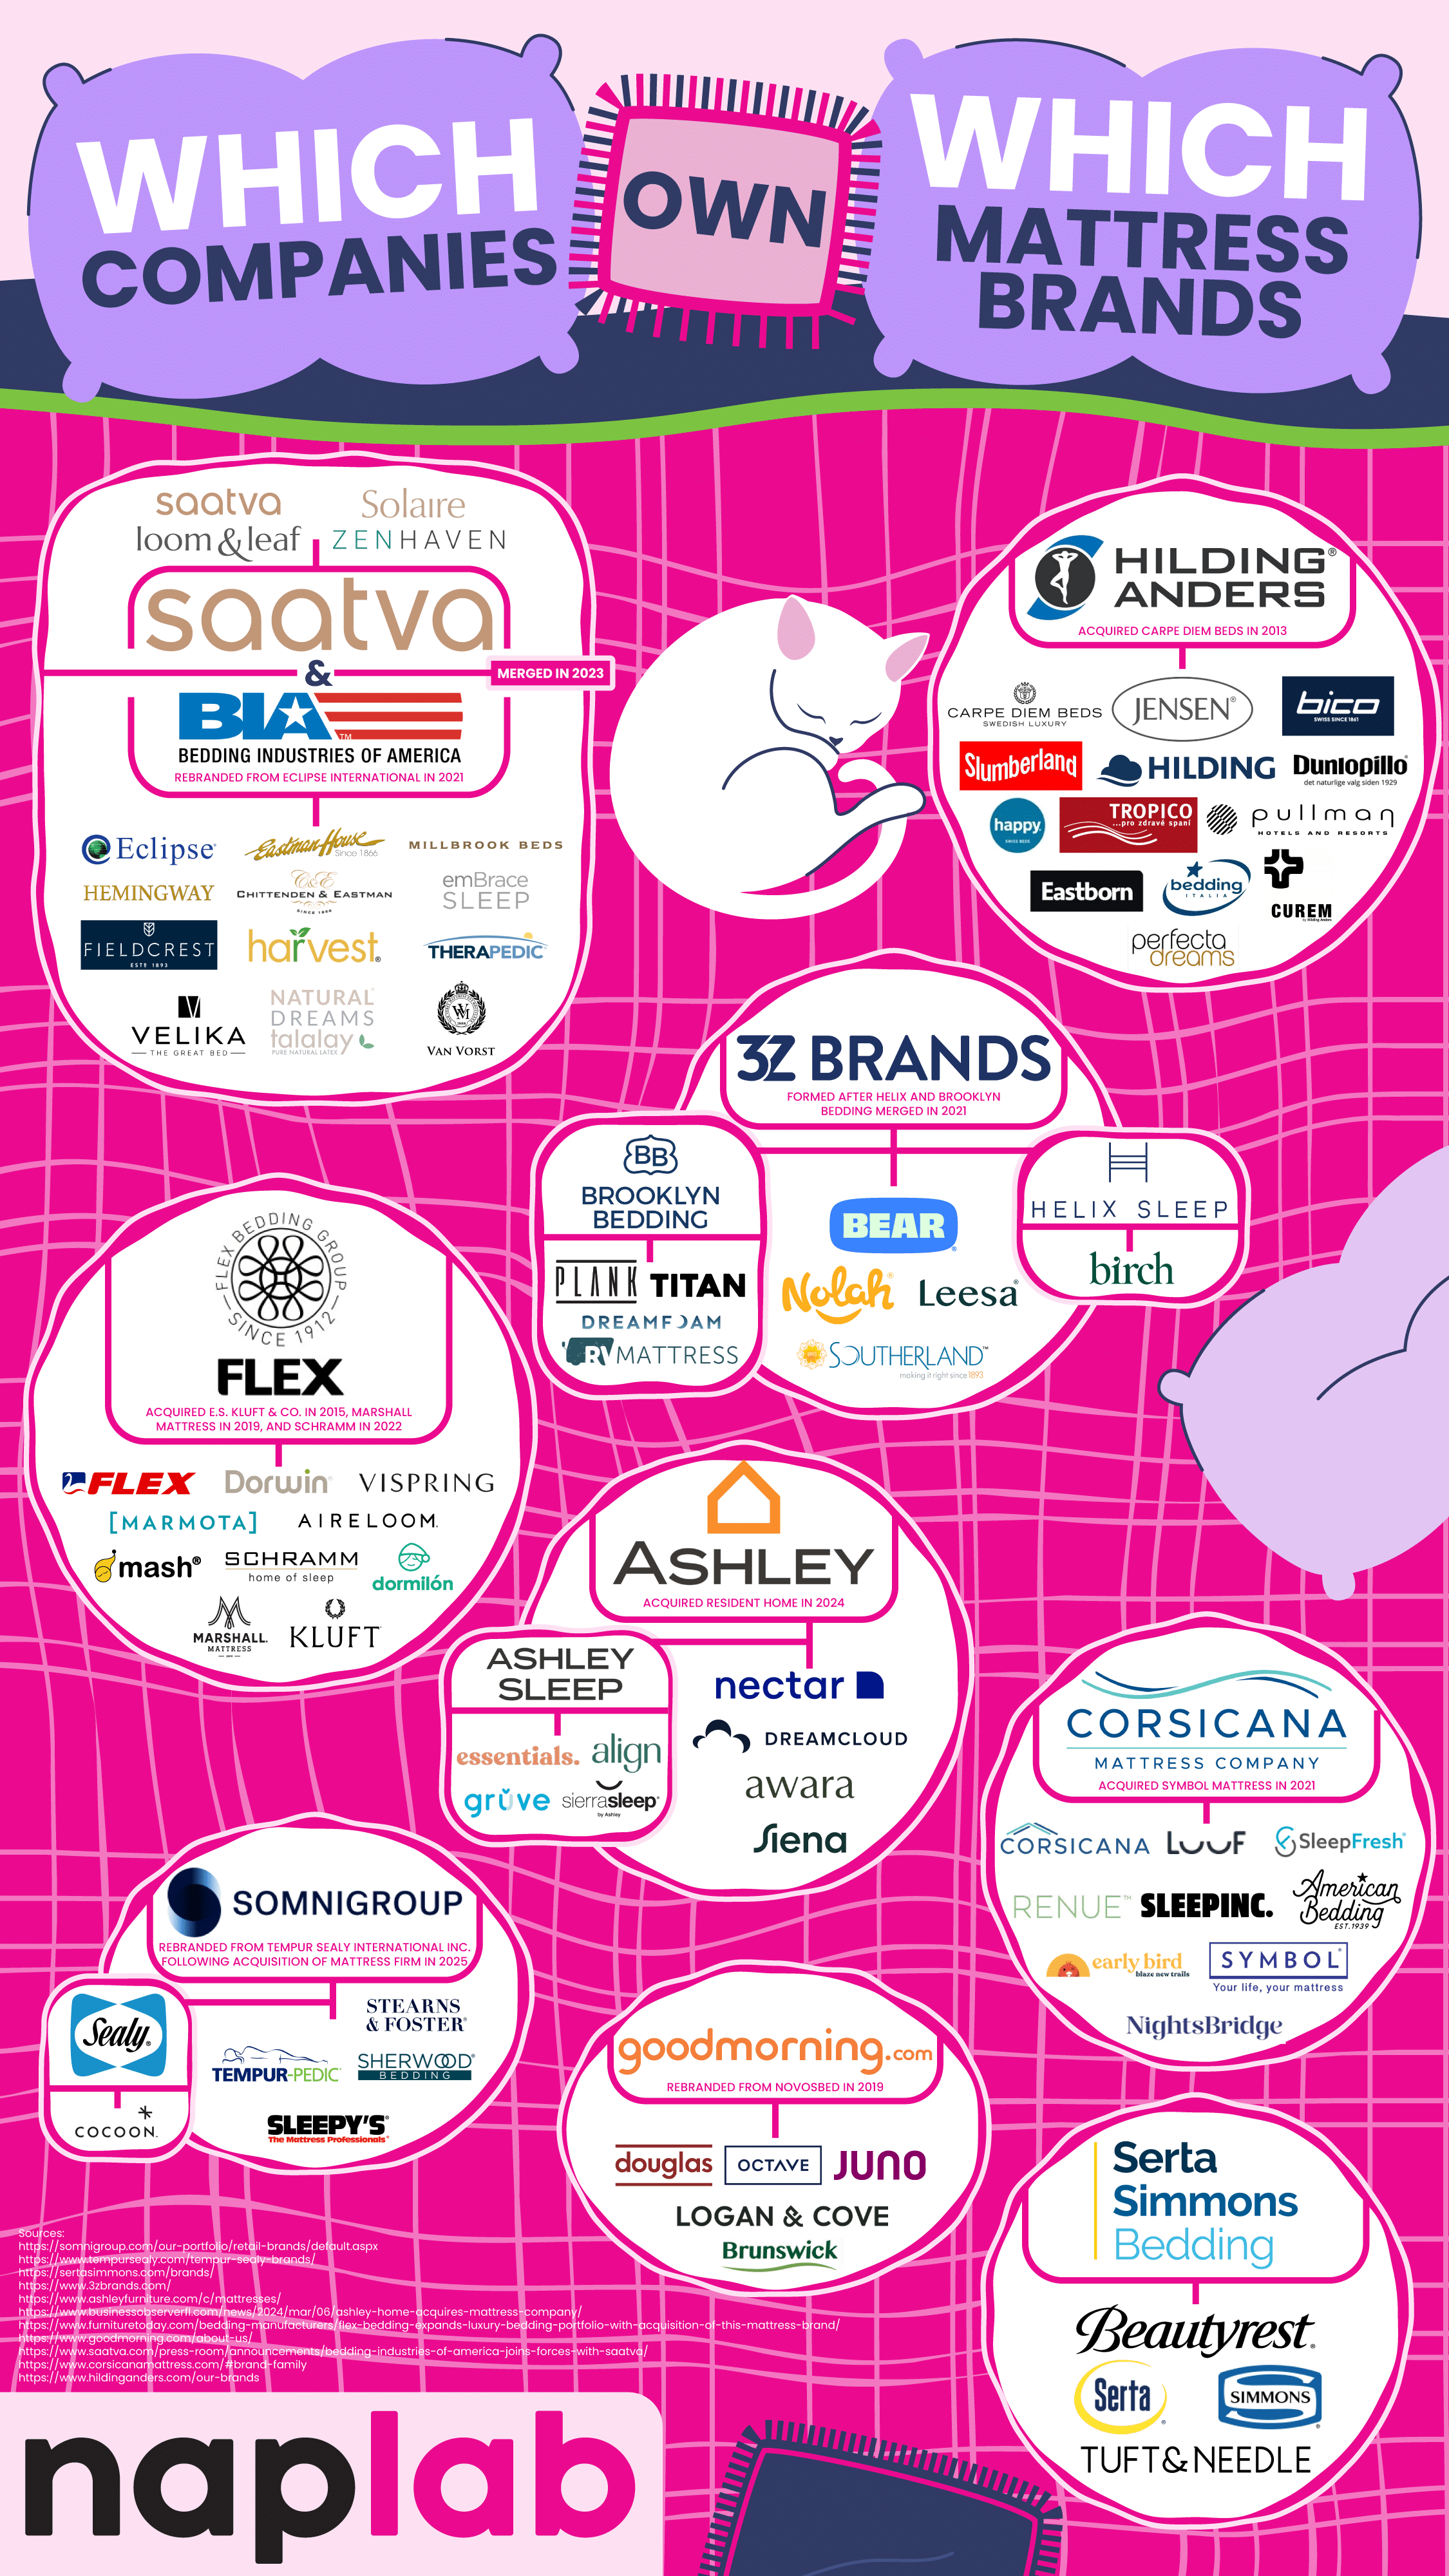
When you visit a mattress store or browse through mattress options online, there are a lot of choices that make us feel like we’re choosing from dozens of options from a wide variety of companies. But this choice is an illusion, as a handful of corporations actually own these brands and control large portions of the mattress and bedding industries. The team at NapLab breaks down ownership of the most recognizable mattress companies. Their work shows us that brand diversity is often a mask for a limited corporate structure.
Click below to zoom.
One of the biggest shareholders of the mattress industry is Somnigroup International. They used be called Tempur Sealy International, a name you probably recognize. What you might not realize is that this company owns brands like Tempur-Pedic, Sealy, Stearns & Foster, Sherwood Bedding, and Sleepy’s. They also own the entire extensive Mattress Firm retail store network. This makes Somnigroup International a powerful driving force in mattress sales and distribution.
Another big player in the industry is Serta Simmons Bedding LLC (SSB). They own classic brand names like Simmons, Serta, Beautyrest, and Tuft & Needle. SSB has had its share of financial challenges, including filing for Chapter 11 bankruptcy in 2023, but it still continues to own a significant share of the American mattress market.
Not all these owners are giant manufacturers. Ashley Global Retail is best known for furniture, but it entered the mattress market when it acquired the Resident Home family of brands, which includes Nectar, Awara, Siena, DreamCloud, and Ashley Sleep. These options encompass both luxury and budget-friendly mattress brands.
3Z Brands is a key player in the direct-to-consumer mattress sales space. They own the brands Helix Sleep, Bear, Brooklyn Bedding, Leesa, and Nolah. These brands represent the share of shoppers who prefer buying a mattress online rather than dealing with retailers and sales representatives.
Saatva Inc. used to focus solely on selling luxury mattresses online, but in 2023, it merged with Bedding Industries of America. The merger added other brands to their roster, including Eclipse, Millbrook, Ernest Hemingway, and Eastman House, in addition to Saatva’s name brand of products.
We also see some international companies represented here. GoodMorning.com, formerly known as Novosbed, is a Canadian company that primarily sells to the U.S. market, encompassing the brands Octave, Juno, Douglas, and Logan & Cove.
The Flex Bedding Group is Spanish-owned and sells luxury and niche products to Americans, including the high-end brands Marshall Mattress, E.S. Kluft & Co., Kluft, Aireloom, and Vispring.
Understanding which companies own these mattress brands helps consumers make informed choices. It also helps us understand that brands might appear vastly different, but in reality, they’re under the same corporate umbrella, which influences everything from pricing to marketing to manufacturing.
This brand consolidation isn’t any different from many other industries, like beer and skincare, but it does raise consumer concerns about true choice and industry competition.
Business Visualizations
Ranking States by Workplace Cleanliness
The team at Stratus Building Solutions reveals which states have the cleanest and dirtiest workplaces in a new study. Cleanliness is often an overlooked but powerful influence on workers’ health, happiness, and productivity. People who work in an office spend many hours there and have a right to a clean, safe space to work, whether that’s at their desk, in the breakroom, or in the bathroom. The team’s study reveals that cleanliness depends on more than company policy and culture. It’s impacted by resources and state laws. While some states mandate rules that boost workers’ health and safety, other locations lack such protections and put workers at risk.
Click below to zoom.
The team created a scoring system based on some key criteria. First was the number of OSHA violations. OSHA is the Occupational Safety and Health Administration, which sets federal workplace safety standards, including sanitation standards. A state with a high number of OSHA sanitation violations is a clear sign of dirty workplaces. These violations could include unclean restrooms, inadequate waste disposal, or the presence of mold and bacteria. The team also examined the number of janitors per capita, population density, air pollution, and sick leave laws in each state.
The team found that these states were the cleanest with the highest scores:
- Nebraska
- Colorado
- North Dakota
- South Dakota
- Washington
- Missouri
- Montana
- Idaho
- Michigan
- New Mexico
The top scorers had low rates of OSHA violations, clean air, and high janitor-to-population ratios. State laws mandating sick leave also play a major role, as workers are more likely to stay home rather than bring germs to work.
These were the states that struggled the most with these standards:
- Tennessee
- North Carolina
- Mississippi
- Virginia
- Connecticut
- Oregon
- Nevada
- Rhode Island
- Alabama
- New Jersey
- Pennsylvania
Many of these states are on the dirty end of the spectrum, lacking paid sick leave. Tennessee, Mississippi, and North Carolina do not have laws on paid sick leave, which, when combined with the absence of handwashing stations and disinfecting services, makes the workplace a petri dish for germs. We also see heavily populated states like New York and New Jersey on the low end of the spectrum because more people means a greater challenge to clean up waste and keep germs at bay. High populations also mean bigger cities and more air pollution. We do see, however, that lower population density doesn’t necessarily mean cleaner workplaces, as Vermont was near the bottom of the list and has a small population.
Clean workplaces are healthy workplaces. Dust, germs, and air pollution lead to gastrointestinal and respiratory problems among workers. Simple precautions like regularly disinfecting surfaces, installing handwashing stations, and removing dust can boost the cleanliness of the office and the health of workers. Healthy workers mean better productivity and greater safety for all. Not only will a clean space improve worker experience, but OSHA violations can be very costly. The team’s study provides fascinating insights into what affects workplace cleanliness.
Business Visualizations
New Study Examines Language Used to Let Employees Go
Letting an employee go is an unpleasant experience for everyone involved, but language has the power to guide the emotions surrounding an interaction. While the right words won’t erase the bad side of being let go, they can help the employee in question understand why the situation is happening and make them feel seen and heard. Preply leaned into the language aspects in these situations with a study examining the most common phrases and words used when letting an employee go and how employers and employees felt about the situation.
Click below to zoom.
Overall, the team found that these were the most common phrases used:
- Letting you go
- Effective immediately
- Terminating your employment
- This isn’t working out
- No longer require services
- Parting ways
- Ending your employment
- No longer needed
- Relieved of duties
- Ending our working relationship
Managers and employees seem to agree that lack of empathy and responsibility were the most common complaints about the process. One in six managers say they regret the words they chose when firing someone, and 92% feel they need more training on how to handle such situations. Employees wanted their managers to focus on clarity, compassion, empathy, and honesty when firing an employee.
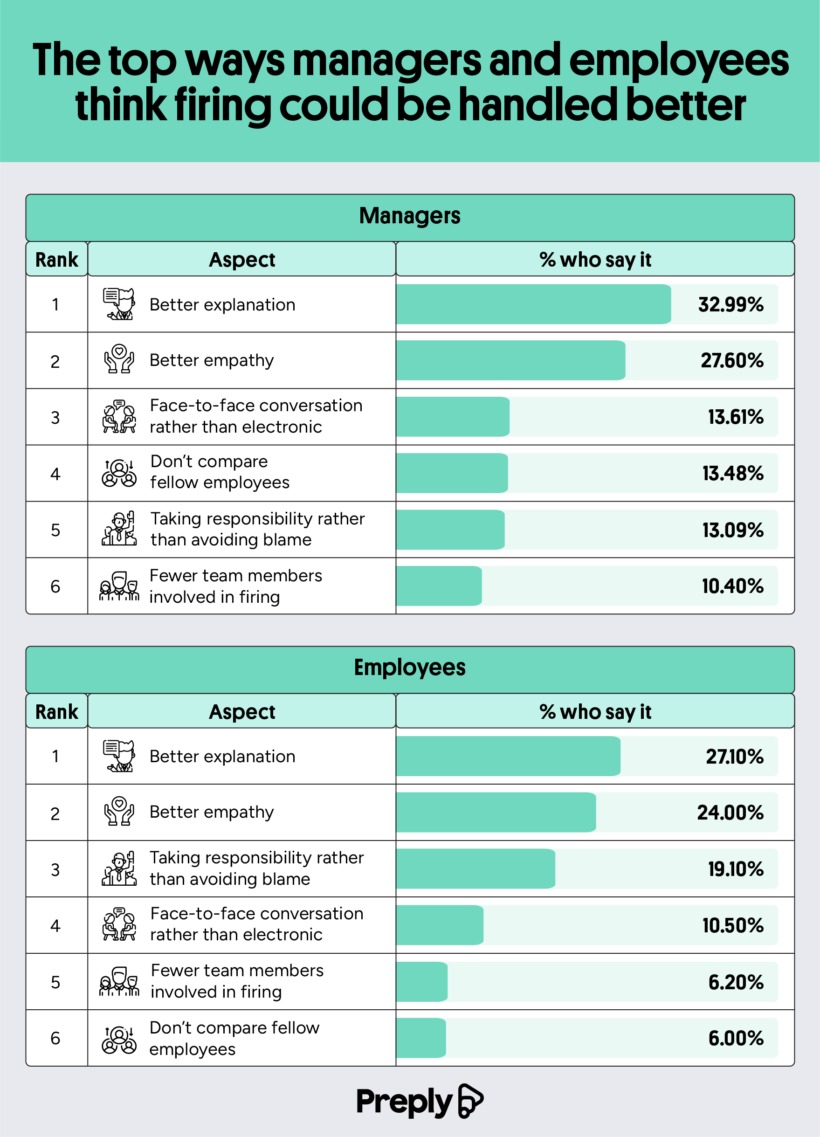
The team studied changes that both managers and employees would like to see in the firing process.
These are the six things employees want to see improved:
- Better explanation
- Better empathy
- Taking responsibility rather than avoiding blame
- Face-to-face conversation rather than electronic
- Fewer team members involved in the firing
- Don’t compare fellow employees
Here’s how that compares to changes managers would like to make to the process:
- Better explanation
- Better empathy
- Face-to-face conversation rather than electronic
- Don’t compare fellow employees
- Taking responsibility rather than avoiding blame
- Fewer team members involved in firing
These are similar answers, but we can see that the two groups ranked their importance differently. Overall, 92% of Americans think managers could benefit from some language training when it comes to firing someone. Empathy and honesty were high on the list of employee wishes, indicating that understanding can help give them closure on the job, and empathy softens the blow. Not many managers would prefer a face-to-face meeting. Only 1 in 6 prefer this to virtual meetings, which seem to be the most common option.
Only 55% of managers have received training on how to fire someone, and with many of them regretting their language choices, it seems that many managers would benefit from some education in business language and communication. Notice that many of the top phrases are more professional ways to say “fired,” like “letting you go,” “terminating,” and “no longer require.”
When managing a team, empathy and clear language are crucial. These skills can help managers excel at many tasks beyond having to let an employee go. But when a situation like firing someone is emotionally charged, the language used becomes more important than ever. Hopefully, the team’s study can help managers reflect on how they go about the process.
-

 Business Visualizations1 year ago
Everything Owned by Apple
-

 Business Visualizations1 year ago
America’s Most Valuable Companies Ranked by Profit per Employee
-

 Business Visualizations12 months ago
The Biggest Fortune 500 Company in Every State
-

 Business Visualizations9 months ago
The Biggest Employers by Industry
-

 Business Visualizations2 years ago
New Animated Map Shows Airbnb’s Fully Booked Cities Along the 2024 Eclipse Path of Totality
-

 Business Visualizations2 years ago
Everything the Luxury Giant LVMH Owns in One Chart
-

 Timelines1 year ago
Timeline Charts the Development of Communications Technology
-

 Charts2 years ago
How Many Crayola Crayon Colors Are There? A Lot.


