Business Visualizations
The Biggest Employers by Industry
There are more than 30 million businesses in the U.S. — but some of those companies employ far more workers than others. Giants like Walmart and Amazon have more than a million employees working on developing, marketing, transporting and selling their products everyday. Meanwhile, lesser-known companies in industries you may not be as familiar with also employ a significant amount of our workforce.
Using Fortune 500 data, our team at The Chartistry identified the largest employers in every industry, including retail, food, health care, real estate and many more (we included a whopping 75 industries total).
Click below to zoom
Who is the largest employer in America?
Technically, the largest employer in the U.S. is the federal government. But if we’re talking about the company that employs the most people, Walmart takes the cake.
Since Walmart’s first store opened in 1962, the company has grown to establish more than 11,500 stores globally to serve more than 260 million weekly shoppers in 28 countries, according to the company’s site. It’s no surprise that the retailer requires a lot of manpower. Walmart has 2,100,000 employees, and is the only one on our list that employs more than 2 million people.
Who else are America’s biggest employers?
Walmart may offer up the most jobs in the U.S.,but there are plenty of other companies with thousands of employees headed to work everyday. Some of the giants on the list of companies with the most employees in every industry are also among the largest U.S. employers in general.
Amazon, which started in Jeff Bezos’ garage in 1994 as an online bookseller, has grown up to make its mark around the world. There’s a good chance you’ve shopped online via the company, watched its streamer or walked past an Amazon retail store or fulfillment center. Amazon may have started with a solo founder, but it now employs 1,525,000 people.
Home Depot is another retail heavyweight. Founded in 1978 as a hardware store, the company now boasts more than 2,300 stores across North America. But offering up all that home improvement requires a lot of hands on deck: The company has 463,100 employees. That makes it the highest employer in one category of specialty retailers, but TJX, with 349,000 employees, is the largest employer in the apparel-specific specialty retailer category.
In the mail, package and freight delivery industry, you can probably guess who employs the most people. It’s FedEx, which was just an idea in 1965 when its eventual founder Frederick W. Smith wrote a paper at Yale University on the potential of a new way to get time-sensitive shipments to recipients (he received an average grade, according to the company’s website). Since then, the company makes around 14.5 million deliveries each day thanks to its 446,400 employees.
UnitedHealth Group also made our list, which makes sense, seeing as its the largest health insurance company in the U.S. Parent company of United Healthcare, the company was founded in 1977. Nowadays, it employs 440,000 people.
Curious which food and drug store is the largest employer? That would be Kroger, which had its start in 1883 when Barney Kroger invested his life savings of $372 to open a single grocery store. More than 140 years later, Kroger is the nation’s largest grocer with nearly 2,800 stores in 35 states and 414,000 employees. But if we’re talking specifically about food services, latte lovers’ favorite place, Starbucks, is the largest employer, with 381,000 employees. Looking specifically at the food consumer products industry, PepsiCo — which owns brands like Lay’s, Doritos, Gatorade, Quaker and, of course, Pepsi — is the largest employer with 318,000 employees.
The travel industry also requires tons of workers. American Airlines Group, which offers thousands of flights daily in more than 60 countries, is the largest employer in the airline industry with 132,100 people. Hilton Worldwide Holdings, meanwhile, has 178,000 employees to help run its hotels, casinos and resorts.
In the entertainment industry, a very familiar name earns the title for largest employer with its 199,125 workers: Walt Disney.
The largest U.S. employers in each industry
Here are the largest companies by employees in every industry — from hotels and airlines to pharmaceuticals and medical equipment.
|
Industry |
Company |
Number of Employees |
|
General Merchandisers |
Walmart |
2,100,000 |
|
Internet Services and Retailing |
Amazon |
1,525,000 |
|
Specialty Retailers: Other |
Home Depot |
463,100 |
|
Mail, Package, and Freight Delivery |
FedEx |
446,400 |
|
Health Care: Insurance and Managed Care |
UnitedHealth Group |
440,000 |
|
Information Technology Services |
Concentrix |
440,000 |
|
Food and Drug Stores |
Kroger |
414,000 |
|
Insurance: Property and Casualty (Stock) |
Berkshire Hathaway |
396,500 |
|
Food Services |
Starbucks |
381,000 |
|
Specialty Retailers: Apparel |
TJX |
349,000 |
|
Food Consumer Products |
PepsiCo |
318,000 |
|
Commercial Banks |
JPMorganChase |
309,926 |
|
Health Care: Medical Facilities |
HCA Healthcare |
265,000 |
|
Diversified Outsourcing Services |
Aramark |
262,550 |
|
Health Care: Pharmacy and Other Services |
CVS Health |
259,500 |
|
Semiconductors and Other Electronic Components Equipment |
Jabil |
236,000 |
|
Computer Software |
Microsoft |
221,000 |
|
Entertainment |
Walt Disney |
199,125 |
|
Motor Vehicles & Parts |
Lear |
186,600 |
|
Telecommunications |
Comcast |
186,000 |
|
Aerospace & Defense |
RTX |
185,000 |
|
Hotels, Casinos, Resorts |
Hilton Worldwide Holdings |
178,000 |
|
Computers, Office Equipment |
Apple |
161,000 |
|
Food Production |
Tyson Foods |
139,000 |
|
Airlines |
American Airlines Group |
132,100 |
|
Pharmaceuticals |
Johnson & Johnson |
131,900 |
|
Real Estate |
CBRE Group |
130,000 |
|
Industrial Machinery |
General Electric |
125,000 |
|
Scientific, Photographic, and Control Equipment |
Thermo Fisher Scientific |
122,000 |
|
Medical Products and Equipment |
Abbott Laboratories |
114,000 |
|
Construction and Farm Machinery |
Caterpillar |
113,200 |
|
Transportation and Logistics |
GXO Logistics |
109,000 |
|
Household and Personal Products |
Procter & Gamble |
107,000 |
|
Network and Other Communications Equipment |
Amphenol |
95,000 |
|
Chemicals |
3M |
85,000 |
|
Diversified Financials |
Marsh & McLennan |
85,000 |
|
Apparel |
Nike |
83,700 |
|
Tobacco |
Philip Morris International |
82,700 |
|
Beverages |
Coca-Cola |
79,100 |
|
Advertising, Marketing |
Omnicom Group |
75,900 |
|
Wholesalers: Food and Grocery |
Sysco |
71,750 |
|
Insurance: Property and Casualty (Mutual) |
State Farm Insurance |
65,054 |
|
Petroleum Refining |
Exxon Mobil |
61,500 |
|
Financial Data Services |
Fidelity National Information Services |
60,000 |
|
Wholesalers: Diversified |
Genuine Parts |
60,000 |
|
Electronics, Electrical Equipment |
Whirlpool |
59,000 |
|
Oil And Gas Equipment, Services |
Baker Hughes |
58,000 |
|
Packaging And Containers |
WestRock |
56,100 |
|
Securities |
Edward Jones |
54,000 |
|
Engineering and Construction |
Quanta Services |
52,500 |
|
Home Equipment, Furnishings |
Stanley Black & Decker |
50,500 |
|
Waste Management |
Waste Management |
48,000 |
|
Wholesalers: Health Care |
McKesson |
48,000 |
|
Insurance: Life, Health (Stock) |
MetLife |
45,000 |
|
Trucking, Truck Leasing |
J.B. Hunt Transport Services |
34,718 |
|
Toys, Sporting Goods |
Mattel |
33,000 |
|
Railroads |
Union Pacific |
32,973 |
|
Metals |
Nucor |
32,000 |
|
Automotive Retailing, Services |
CarMax |
30,621 |
|
Building Materials, Glass |
Builders FirstSource |
29,000 |
|
Utilities: Gas and Electric |
PG&E |
28,010 |
|
Wholesalers: Electronics and Office Equipment |
TD Synnex |
28,000 |
|
Temporary Help |
Manpower Group |
27,900 |
|
Mining, Crude-Oil Production |
Freeport-McMoRan |
27,200 |
|
Equipment Leasing |
United Rentals |
26,300 |
|
Publishing, Printing |
News Corp. |
25,000 |
|
Miscellaneous |
Service Corporation International |
21,267 |
|
Transportation Equipment |
Polaris |
18,500 |
|
Energy |
NRG Energy |
18,131 |
|
Education |
Graham Holdings |
17,006 |
|
Insurance: Life, Health (Mutual) |
TIAA |
16,023 |
|
Pipelines |
Energy Transfer |
13,786 |
|
Homebuilders |
D.R. Horton |
13,450 |
|
Forest and Paper Products |
Domtar |
13,000 |
|
Shipping |
Kirby Corporation |
5,450 |
Don’t miss our other visuals (Chartistry Originals) that give insight into some of the biggest employers in the U.S, including our map of the biggest Fortune 500 companies in every state, breakdown of America’s most valuable companies ranked by profit per employee and original chart of everything owned by Apple.
Source:


A new study by LLC Attorney examines the booming side-gig economy across the United States, identifying which states have seen the largest increases in freelance work and why. The piece introduces us to an expanding “Gig Economy” driven by apps and services like Uber, DoorDash, and Fiverr. These apps have made on-demand work accessible on a wide scale. While the side-gig economy is growing overall, the team shows that growth isn’t evenly distributed. Some states have far more gig workers than others.
Click below to zoom.
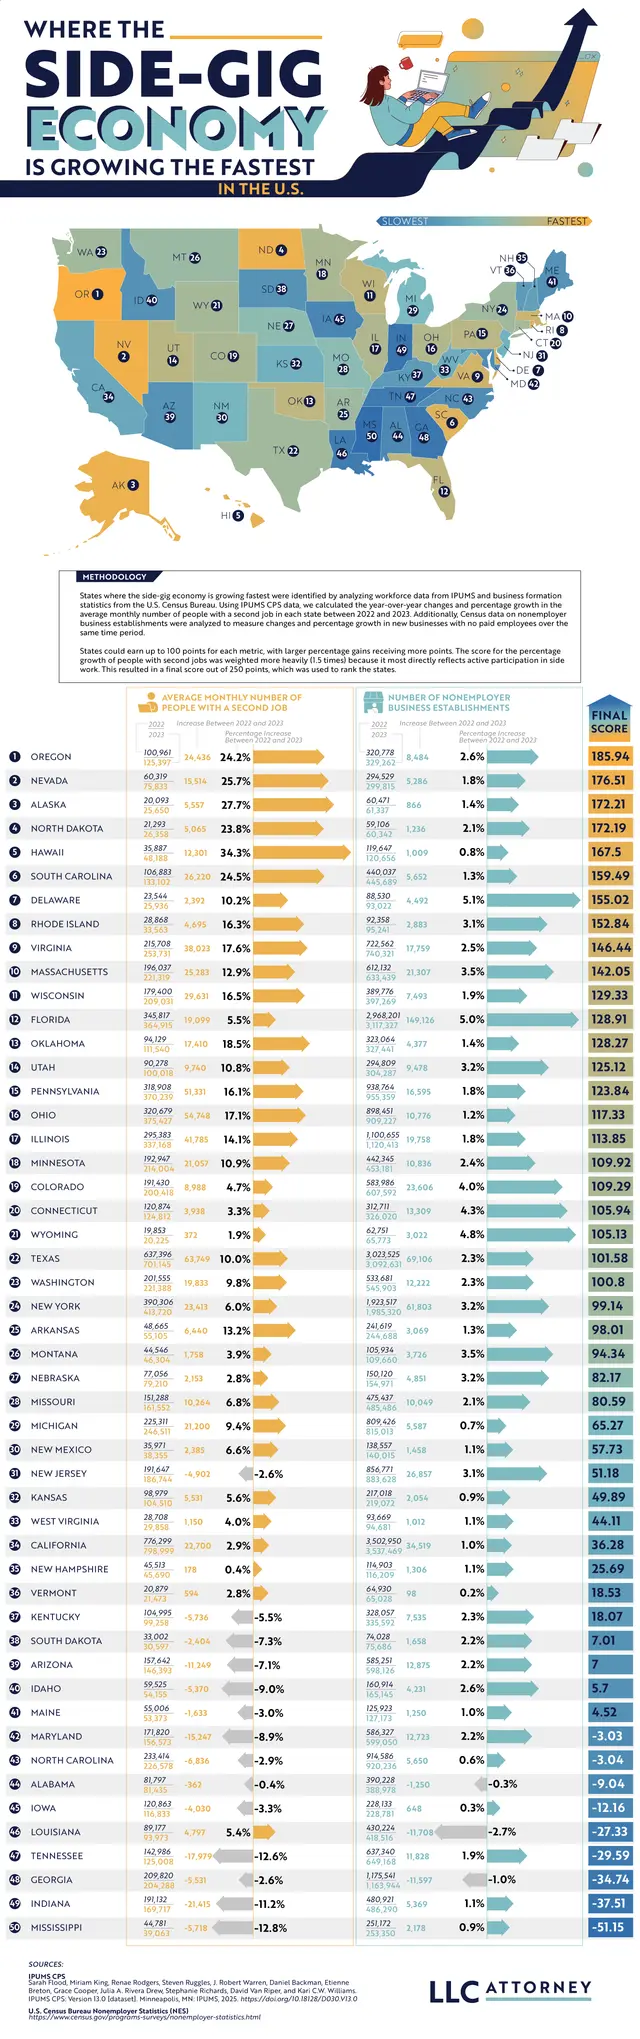
To get the data needed to create the map, the team analyzed year-over-year changes in the average monthly number of people holding a second side gig job and the growth of non-employer business establishments. Drawing on data from IPUMS CPS and the U.S. Census Bureau, the team created a color-coded map.
The top five states show us an interesting geographic picture. Oregon claimed the number one spot with a 24.2% rise in the average monthly number of people working a second gig job. Oregon has the highest number of gig workers in general. Nevada had one of the largest increases, at 25.7%, thanks to its tourism-heavy economy, which naturally generates demand for ride-sharing, Airbnb, and delivery services. Alaska takes third place, despite its smaller population. It had a 27.7% increase, while North Dakota follows in fourth with a 23.8% rise. Hawaii rounds up the top five with a huge 34.3% jump in residents working two jobs between 2022 and 2023.
These specific states lead the way because of two recurring issues. High costs of living, with rising costs of food, healthcare, and housing outpacing wage growth in these regions, lead more people to take on second jobs out of necessity. Hawaii has steep grocery and housing costs; Oregon and Nevada face similar cost-of-living issues.
These top-ranking states might appear to be thriving if we look at the Gig Economy numbers, but they have less diverse job markets, often relying on tourism. These seasonal and unpredictable jobs lead workers to seek ways to diversify their income.
The top ten states with the biggest gig economies are:
- Oregon
- Nevada
- Alaska
- North Dakota
- Hawaii
- South Carolina
- Delaware
- Rhode Island
- Virginia
- Massachusetts
Gig work can be convenient and a big asset to small business owners, but it also has downsides. Gig roles rarely include health insurance or benefits, income tends to be inconsistent, and the work is for people who don’t mind flying solo without coworker interaction. It does support independence and a flexible work schedule for people who value those qualities.
This map helps us understand the lasting changes the gig economy has had on the American economy. Side gig trends reflect how workers respond to economic changes, whether they face setbacks or opportunities. Side gigs create a fairly straightforward, low-effort way to make money, but they also drive steeper competition for jobs. Visualizing data can help us understand what drives economies and helps gig workers decide what opportunities will help them grow.
Many studies have proven the cognitive benefits of learning a second language, which is especially powerful for children. A new Preply study turns to the career world and the monetary benefits of being bilingual. After examining thousands of job advertisements, the team examined how language skills impact hiring trends, salaries, and career growth potential. Their findings help workers definitively decide whether a bilingual career is worth the study. Results show that salary gaps vary widely across countries, and some languages offer stronger benefits than others. Different industries value bilingual workers more than others too. The team’s analysis is a thorough examination of how bilingual abilities can impact a career.
Click below to zoom.
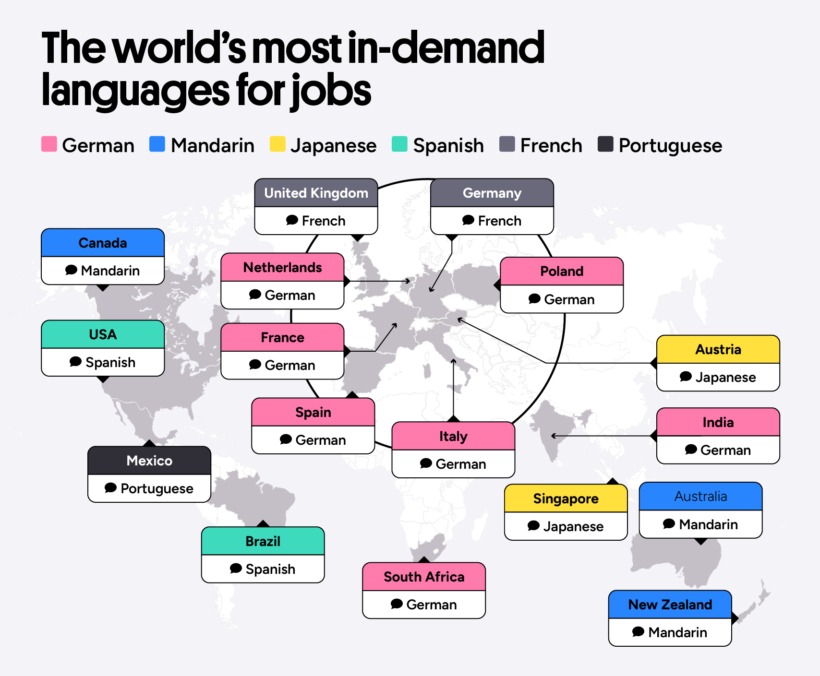
Despite variances, the Preply found that bilingual jobs do indeed pay more. The study found that bilingual workers earn an average of $9,353 more a year. In some countries, that amount is even higher, proving that a second language is one of the most valuable skills you can add to your resume.
These are the countries where speaking a second language pays the most:
- Spain – bilingual workers earn 19.4% more than single-language workers
- USA – 18.8% more
- Poland – 18.6% more
- UK – 11.5% more
- Italy – 4.8% more
- Canada – 3.3% more
Not all languages are worth the same salary increase. Research has uncovered five languages that lead to the highest salary increases. Japanese, Portuguese, Italian, German, and Russian are the most lucrative to learn. Japanese is the most valuable language to learn, giving workers a 20.9% salary increase with fluency. Japan is a world leader in engineering, technology, and the automobile industry, so Japanese fluency allows workers to communicate with these world-leading Japanese brands. The value of Portuguese lies in the many countries that speak it, including Brazil and parts of Africa. Italian fluency comes in handy, particularly in the tourism industry.
Speaking of industry differences, bilingual ability is more valued in some sectors than others. These American sectors had the highest number of job openings that required a second language:
- Sales
- Customer Service
- Social work
- Property and real estate
- Education
- Manufacturing
- Logistics
- Consulting and Strategy
- Accounting and Finance
- Healthcare and Nursing
- Marketing and PR
- Hospitality and Catering
Some of the positions this can lead to include call center reps, account managers, nurses, teachers, hotel managers, tech support experts, social workers, and salespeople.
In the USA, Spanish is the most sought-after second language. In Europe, many countries seek German and French speakers. Remember that it’s never too late to start to learn a second language. You’ll still see career benefits. While you may have to invest in hiring a tutor or start a class, this data makes it clear that this investment will pay off in the long run. Learning a second language not only enriches your life but can also open new doors and career possibilities. If you want to change careers, a second language can help you do this, and if you want to advance, a second language might be the key.
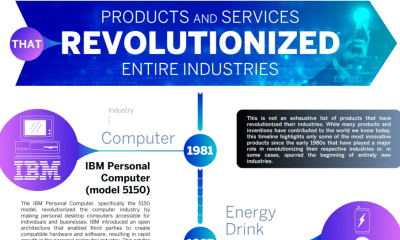
Breakthroughs in technology can revolutionize industries and even give birth to new industries previously unimagined. The Qualtrics team explored the world’s most revolutionary products and services, arranged on a timeline that teaches us not only which tech has caused the biggest changes, but also how these developments interact with each other and advance technology and our lives as a whole. The timeline spans 1981 to 2022. It covers the realms of Computing and Internet, Entertainment and Media, and Mobile and Digital Services. Each item on the timeline has changed its industry and even changed the way humans live.
In the world of computing and Internet services, the timeline covers:
- IBM Personal Computer
- America Online
- Microsoft Windows 95
- Google Search Engine
- OpenAI ChatGPT
Click below to zoom.
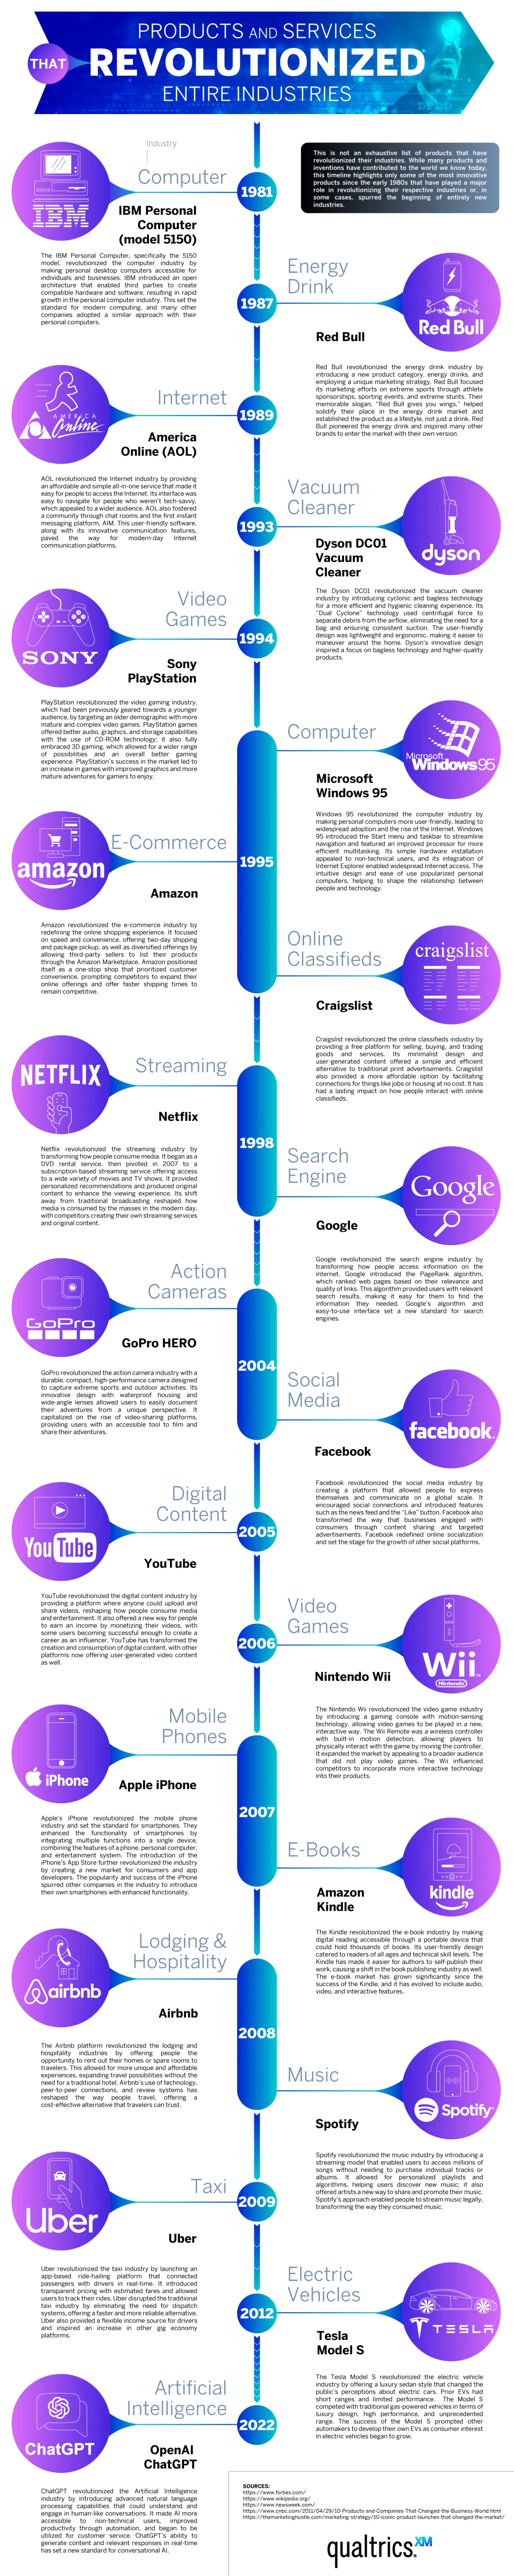
The timeline covers the world of entertainment, featuring Sony PlayStation, Amazon, Craigslist, Netflix, Facebook, YouTube, and Nintendo Wii as the gamechangers. In the mobile and digital services realm, there’s a surprising diversity of products from smartphone models to apps like Uber to the Dyson DC01 Vacuum Cleaner, and even Red Bull energy.
It’s no secret that the personal computer revolutionized the business and computing industries. Before IBM’s PC, there was no market for personal computers; today, they’re a staple of modern life. Another 1980s brand, Red Bull, created a market where none previously existed. People traditionally get their caffeine fix from coffee, but energy drinks offer an easier-to-grab option on the go. Red Bull partnered with extreme-sports marketing to turn energy drinks into a lifestyle.
The timeline highlights AOL Instant Messenger as the Internet’s first big revolution. It’s a precursor to social media and helped make the World Wide Web a means of quick, easy communication. In 1998, Google Search Engines made the Internet an invaluable tool for knowledge. Google made it far easier to find websites of value on any topic under the sun (and even some beyond!)
From here on, the timeline is dominated by a range of innovative apps and Internet-based services. Amazon is the worldwide leader in e-commerce. It changed the way consumers shop forever, offering low prices, convenience, and fast delivery. Netflix changed the way people consume films and television by offering the first-ever streaming service. They offer an enormous library of new and old titles. No more waiting for a syndicated show to air. Netflix created a demand for “binge-worthy” content. The entertainment world touches every area of traditional arts and media. We see the Amazon Kindle changing how many book lovers read, offering a digital library that saves physical space and even money for some titles. Spotify became the leader of music streaming in 2008. Some think of it as the Netflix of music. Memberships offer unlimited streaming access to millions of songs and artists.
These are just a few of the industries that have been revolutionized by technology. We haven’t even touched on AI! Dive into the timeline to learn more about the most pivotal products and services of the modern era.
-

 Business Visualizations2 years ago
Everything Owned by Apple
-

 Business Visualizations1 year ago
America’s Most Valuable Companies Ranked by Profit per Employee
-

 Business Visualizations1 year ago
The Biggest Fortune 500 Company in Every State
-

 Business Visualizations2 years ago
New Animated Map Shows Airbnb’s Fully Booked Cities Along the 2024 Eclipse Path of Totality
-

 Timelines1 year ago
Timeline Charts the Development of Communications Technology
-

 Charts2 years ago
How Many Crayola Crayon Colors Are There? A Lot.
-

 Business Visualizations6 months ago
The Largest Companies in America That Are Still Run by the Person Who Founded Them
-

 Business Visualizations2 years ago
This Chart Shows the Colors That Appear in the Most Fortune 500 Logos