
Finance Visualizations
Where Project Management Specialists Earn the Most in the U.S.

If you’re currently in your career as a Project Manager, are you reaching your full earnings potential? If not, there’s certainly opportunity out there.
This colorful and fascinating visualization from Financial Force dives into the average salaries of Project Management Specialists, to see just where people in the career fields of project management are making the most and least amounts of money.
Click below to zoom
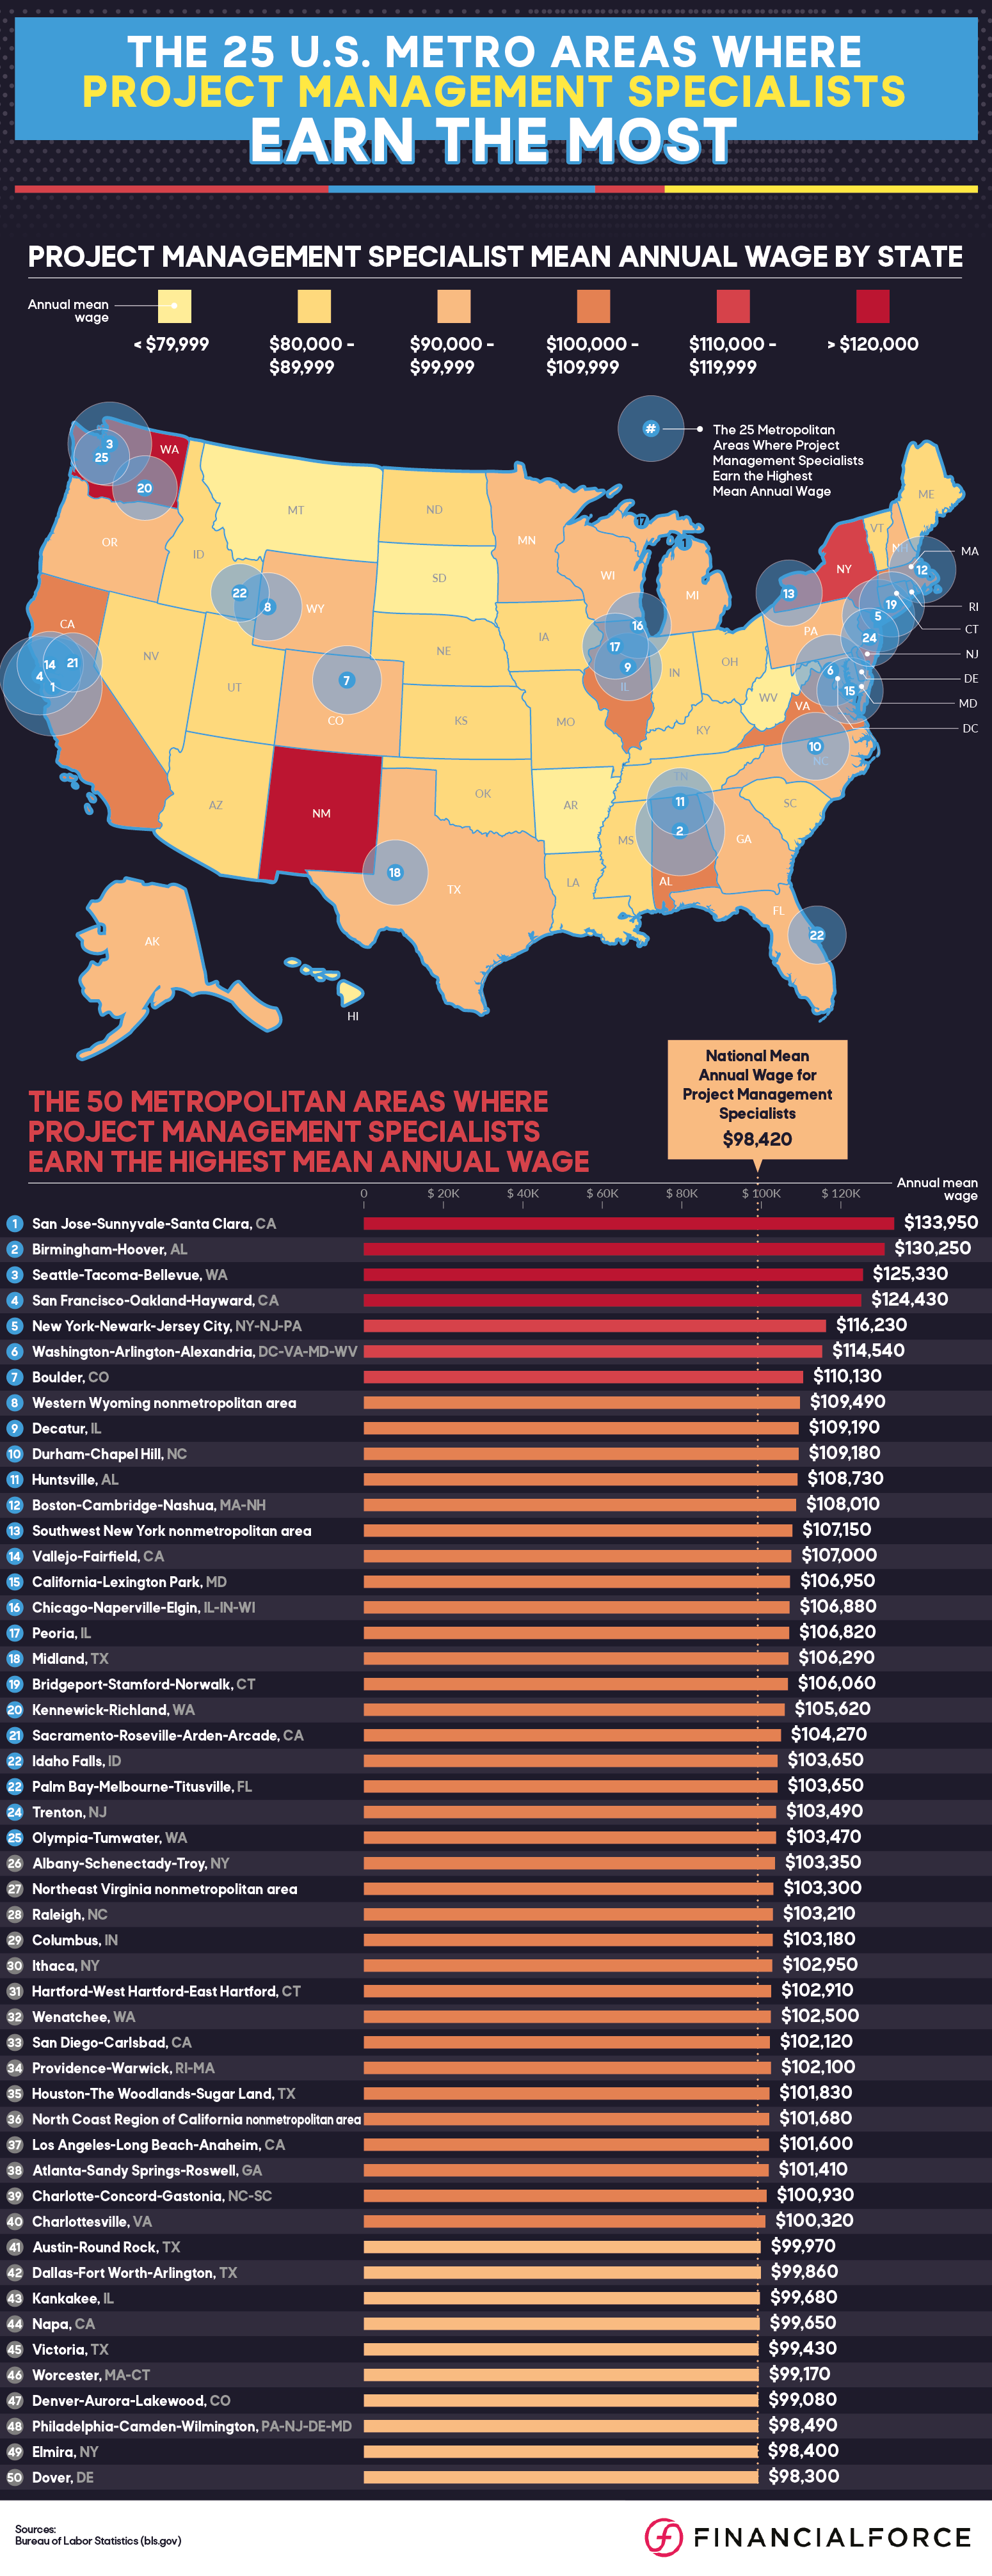
Where do Project Managers make the most money?
Project Management Specialists earn the most in San Jose, California, where the average annual salary is $133,950. Aside from San Jose, the only other metropolitan area in the United States where Project Managers earn more than $130,000 annually is Birmingham, Alabama ($130,250).
Per the research and data from the team at Financial Force, it was found that these were the ten metropolitan areas where Project Management Specialists earned the most on an annual basis.
- San Jose, California: $133,950 annually
- Birmingham, Alabama: $130,250 annually
- Seattle, Washington: $125,330 annually
- San Francisco, California: $124,430 annually
- New York, New York: $116,230 annually
- Washington, D.C.: $114,540 annually
- Boulder, Colorado: $110,130 annually
- Western Wyoming: $109,490 annually
- Decatur, Illinois: $109,190 annually
- Durham, North Carolina: $109,180 annually
Which State pays the most for Project Management Specialists?
In New Mexico, Project Management Specialists can earn an average annual salary of $123,160, which is the most of any U.S. state. Other states with annual mean wages of more than $110,000 across the United States include Washington ($120,800), New York ($111,890), New Jersey ($111,460) and Virginia ($109,980).
According to the data and research shown on this visualization, it was determined that these were the ten states where Project Management Specialists made the most annually.
- New Mexico: $123,160 annually
- Washington: $120,800 annually
- New York: $111,890 annually
- New Jersey: $111,460 annually
- Virginia: $109,980 annually
- Alabama: $109,100 annually
- California: $108,990 annually
- Delaware: $106,930 annually
- Massachusetts: $106,690 annually
- Illinois: $104,520 annually
The average annual salaries for Project Management Specialists in these ten metropolitan areas across the country are especially impressive considering that the average salary range in general is $65,567 to $77,401 annually.

If you were to ask the average American on the street to name the industries that power the national economy, they’ll likely reply “manufacturing” or “tech.” But the Bureau of Economic Analysis says otherwise. As Ooma’s study shows, real estate, rental, and leasing hold the biggest slice of the U.S. economy.
In 2024, the U.S. produced more than $29 trillion in economic output, which outstripped Germany, China, and Japan combined. Looking at how gross domestic product (GDP) breaks down by industry shows the value added by sector after subtracting the costs of the inputs that industry consumed. For example, a carmaker buys steel, rubber, and semiconductors. The value added is the difference between those purchases and the selling price of the finished car. Add up that gap, the value added across every industry in the country, and you arrive at the GDP.
Click below to zoom.
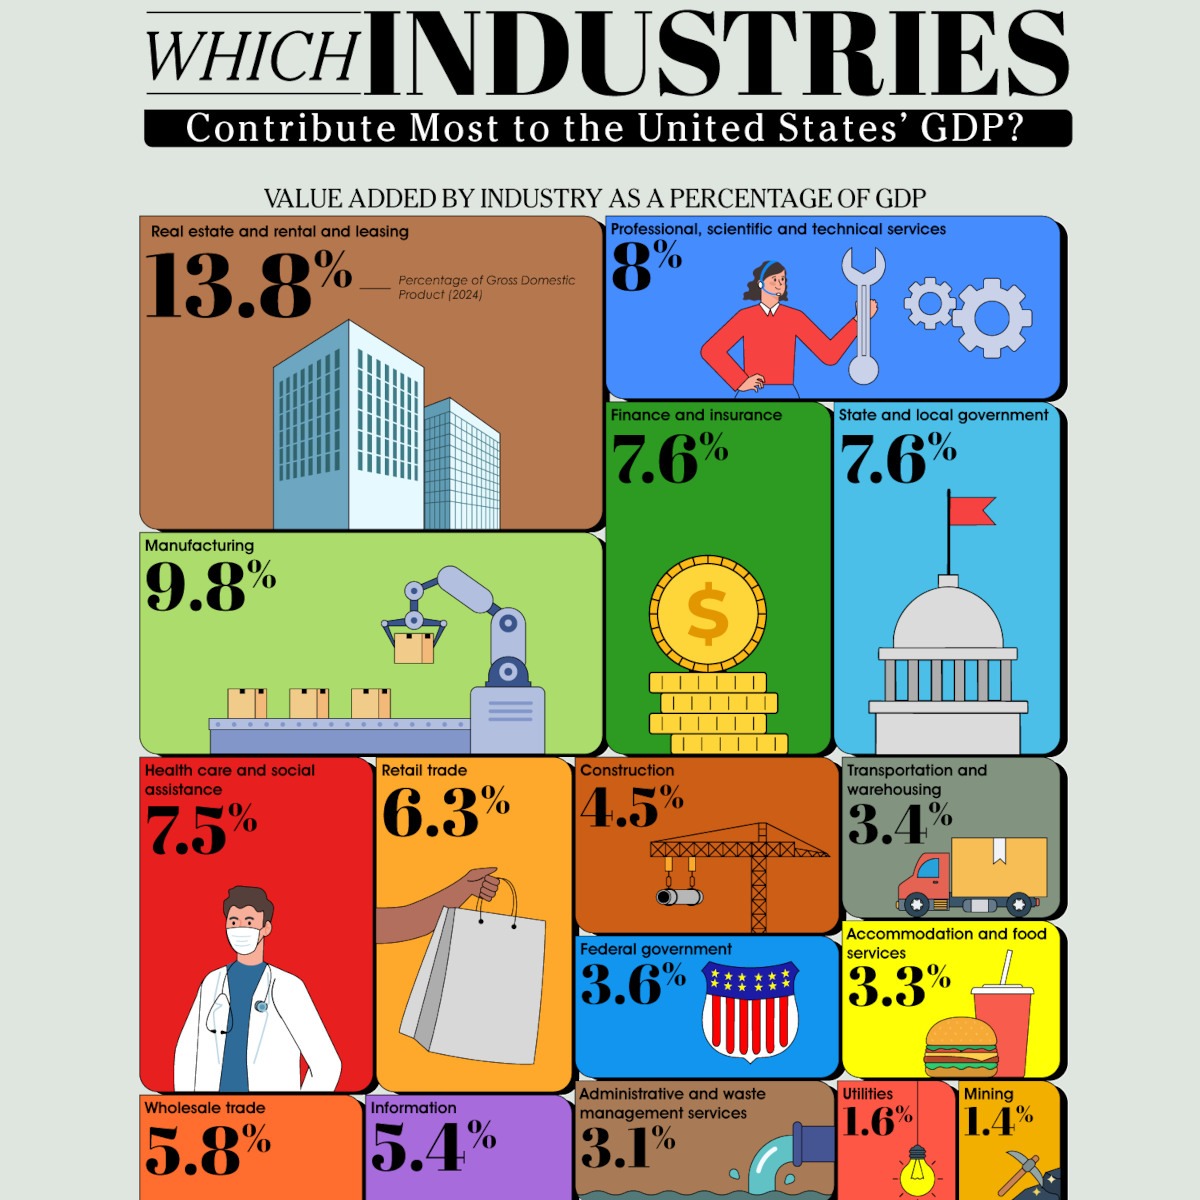
When Ooma ranked industries by their GDP, they found out that the money is concentrated in these industries:
Real estate, rental, and leasing – 13.8%: Real estate alone accounted for $3.68 trillion, the biggest of any sub-industry in the economy. Every mortgage payment, property tax bill, apartment lease, and commercial rent check pours into this sector. Rising home ownership costs over the past decade have pushed more citizens into renting, which has only inflated this industry.
Manufacturing – 9.8%: Factory employment has fallen for forty years due to automation and offshoring, but output hasn’t fallen. Chemical products created $554 billion, and computer and electronic products contributed $299.8 billion to the U.S. economy, helping keep the nation among the world’s top manufacturing nations despite a smaller workforce.
Professional, scientific, and technical services – 8.0%: This industry is made up of law firms, consultancies, engineering firms, and software developers. Legal services alone created $387.7 billion, and computer systems design added $552.2 billion to the American economy. This strongly shows how the American economy leans toward knowledge work.
Finance and insurance – 7.6%: Credit intermediation and Federal Reserve banks generated $1.01 trillion, insurance carriers contributed $791.8 billion, and securities and commodity contracts brought in $396.1 billion.
State and local government – 7.6%: Many rankings leave out these sectors, but government at the state and local level added $2.07 trillion, second only to real estate among all the sub-industries.
Health care and social assistance – 7.5%: Ambulatory care brought in $1.08 trillion and hospitals contributed $691.5 billion. This reflects genuine demand from an aging population and the fact that the U.S. spends more per capita on healthcare than any other developed nation.
Below these top-tier industries, retail trade, wholesale trade, information (Google, Meta, cloud providers, telecom), data processing, and internet publishing followed. Construction closed out the top ten industries at 4.5%, rising and falling in contributions with the real estate sector.
The largest components of American GDP aren’t the ones that produce a physical product. They’re the industries that manage property, deliver care, sell expertise, and move money.

Smartphones are a central part of modern life after a meteoric rise over the past decade. As technology advances, smartphones have developed more features, better cameras, larger screens, and greater connectivity. While many fans clamor for these upgrades, a growing countertrend calls for simpler options, more like phones from a decade ago. Enter the “dumb phone.” The team at Ooma created a timeline that tracks the rise of the dumb phone trend, helping us understand how it happened, what it entails, and why it’s even a thing.
Click below to zoom.
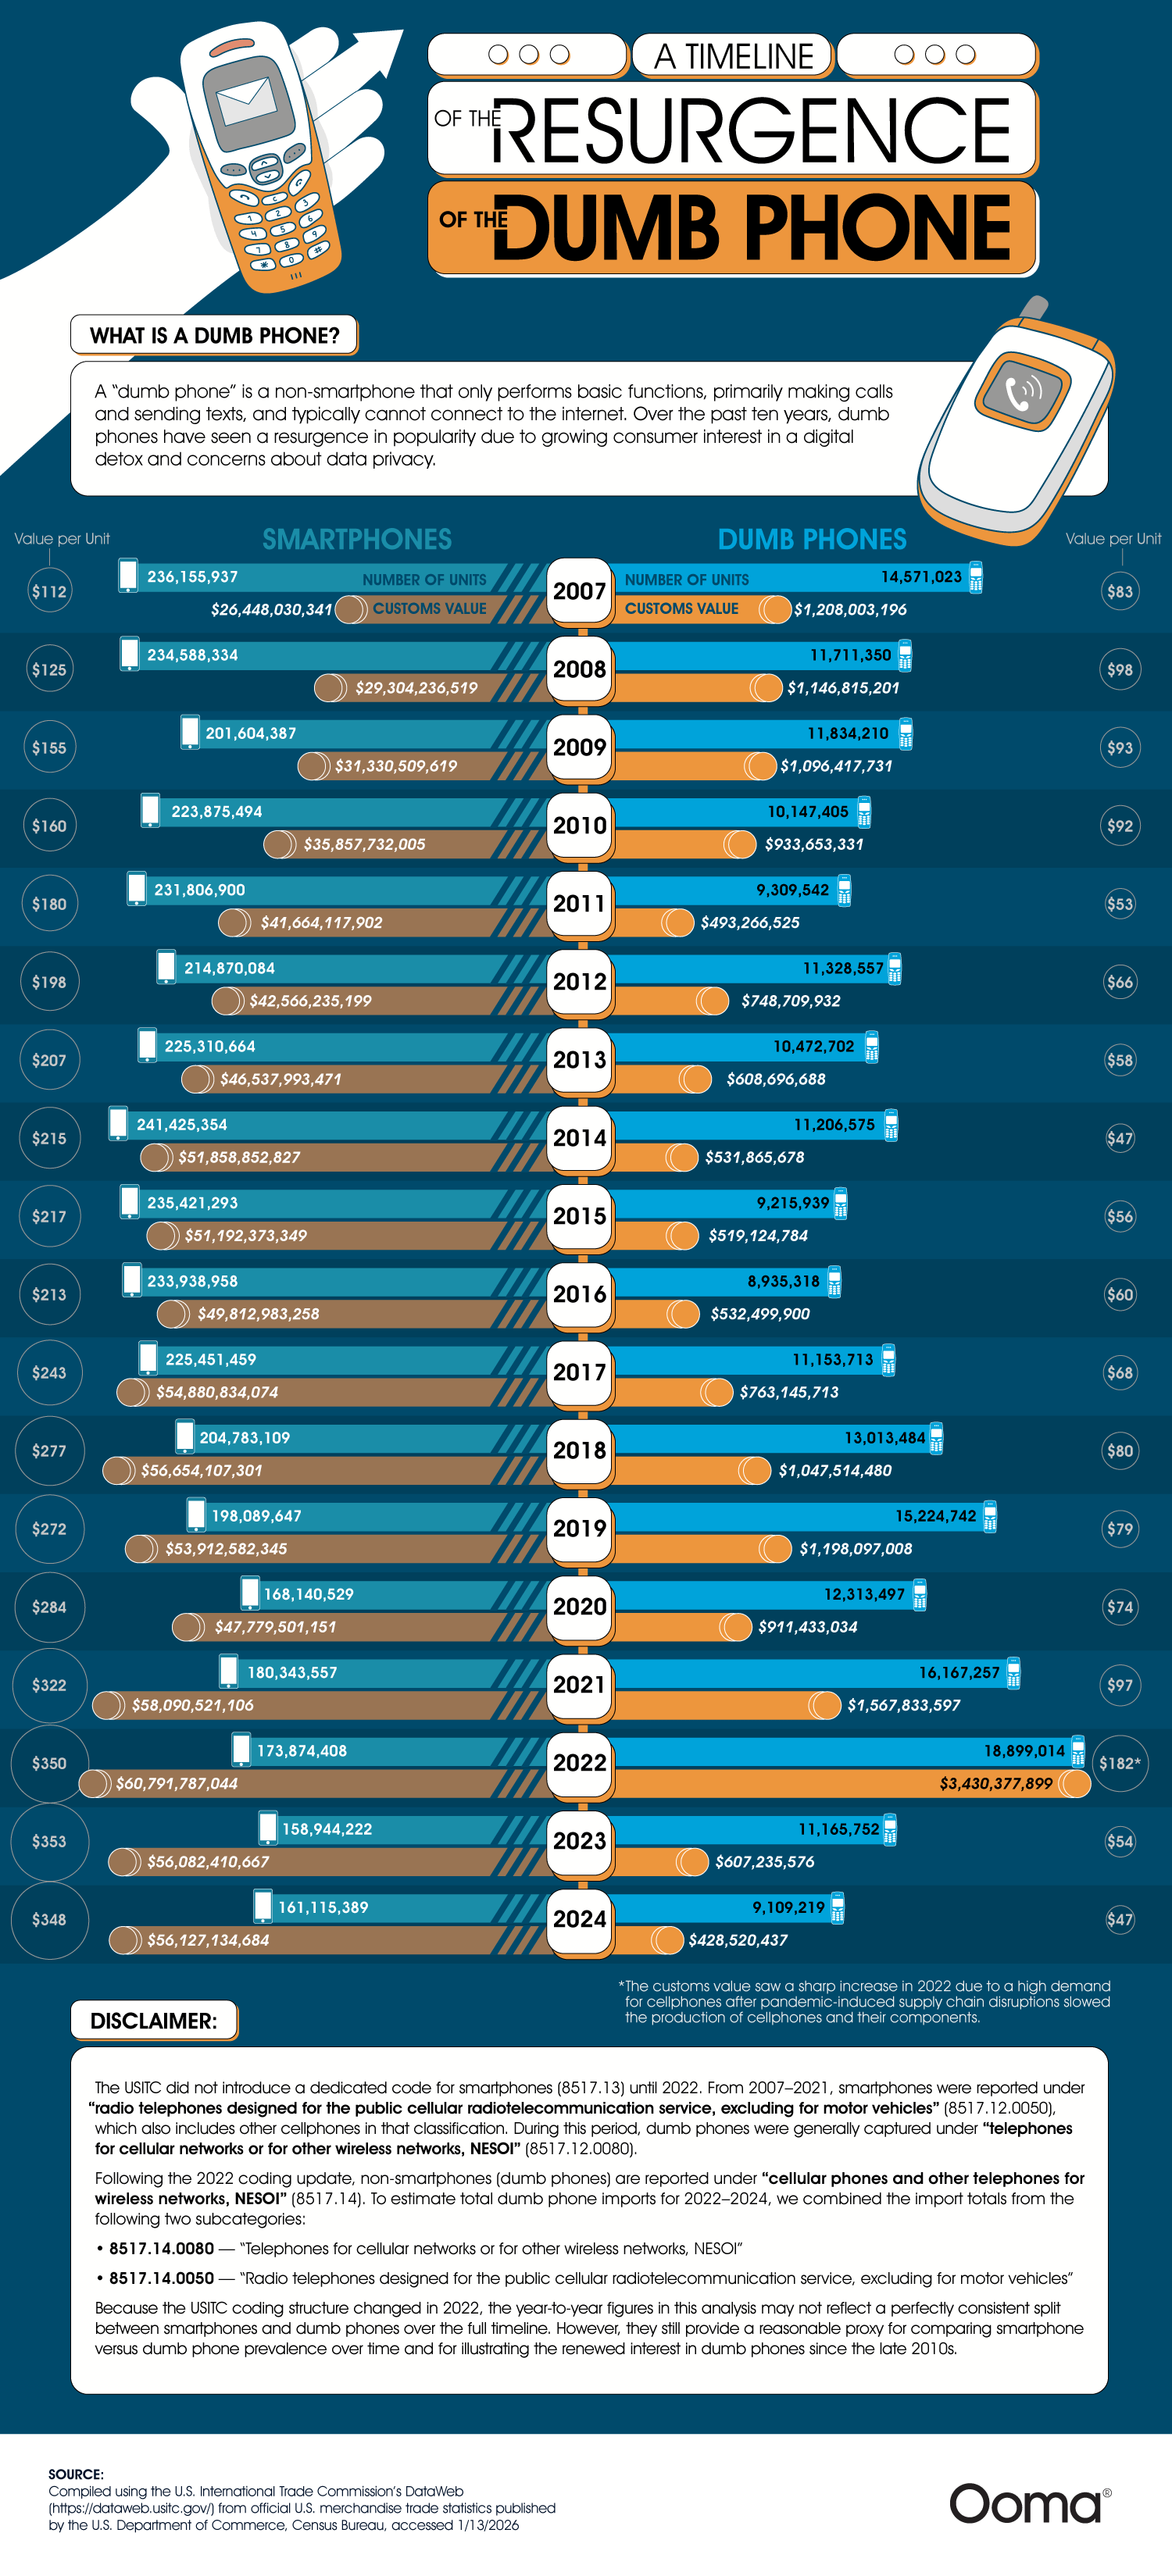
Their timeline compares the number of smartphones vs dumbphones each year from 2007 to 2024. Their data is sourced from the U.S. International Trade Commission, which logged units sold, customs values, and value per unit for both types of devices. Visualizing 17 years of this data helps highlight key inflection points. Over the course of the data, we can see the early dominance of the smartphone and the decline of the dumb phone through the mid-2010s. In the late 2010s, the dumb phone made a comeback, leading to a spike in popularity in 2022.
Before diving deeper into the data, it’s helpful to define the difference between smartphones and dumb phones. Smartphones are essentially pocket computers, mini versions of laptops or tablets. They have large touchscreens, advanced cameras, internet, and social media connectivity. Dumb phones are simple, focused solely on calls and texts. They have limited Internet connectivity and T9 keypads; that means no touch screens.
When 91% of Americans own a smartphone, a 35% increase since 2011, it’s hard to see how or why the dumb phone is gaining popularity, but the numbers tell the story. In 2022, more dumb phones were sold than smartphones. This could be because of growing research warning of the dangers of excessive screen time. Americans average five hours of phone use per day, but excessive screen time leads to sleep disruption, poor mental health, and reduced attention spans. Data privacy issues dominate the news cycle, too. Smartphones collect personal data, which is used for targeted advertising at best and for leaks and data compromise at worst. Dumb phones don’t have these vulnerabilities. A surprising advantage of dumb phones is the battery life. Many of them can go for days on a single charge, something smartphones can’t match.
Dumb phone sales peaked in 2022 and have since leveled off, but they remain well above their lowest point, when smartphones seemed poised to replace dumb phones forever. For now, the forecast seems to show dumb phones are here to stay. The resurgence of dumb phones highlights a shift toward simplicity and mindfulness in technology use. As concerns about screen time, privacy, and mental health grow, many Americans are opting for basic devices. This trend signals that, despite advancements, there’s value in taking a step back and prioritizing well-being over constant connectivity.
Online shopping, known as e-commerce, took the shopping world by storm. Today, one-fifth of all retail sales come from e-commerce. Economists predict e-commerce will only continue to grow in the coming years. This industry can be lucrative but not without risks. The competition is tight as the team at LLCAttorney proves with this chart tracking the e-commerce brands with the biggest gains and losses. The results show the shifting e-commerce landscape and just how much of a difference there is between leading retailers and struggling brands.
Click below to zoom.
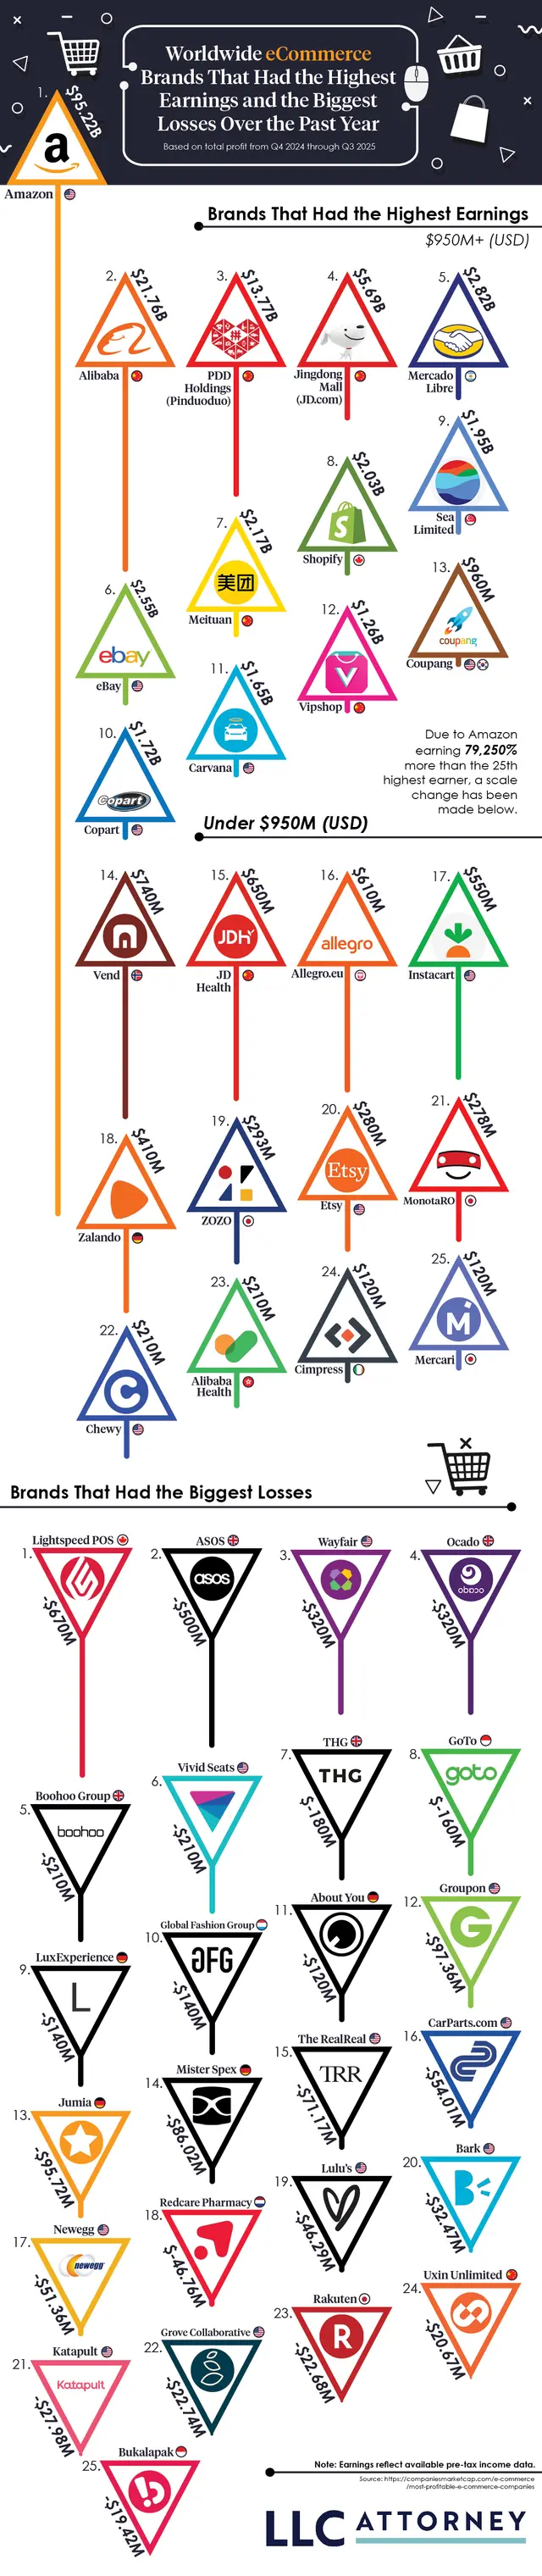
As we would expect from this global-dominant brand, Amazon leads the e-commerce industry with the biggest gains. In 2025, Amazon’s revenue amounted to a whopping $95.22 billion. Ever since Amazon debuted as a bookseller in 1994, it has had a meteoric rise, earning more each year. The biggest leap in the company’s earnings occurred between 2017 and 2018, with a 172.8% increase. Amazon only suffered one year in the red after it invested heavily in Rivian, a failed electric vehicle venture. Amazon’s massive catalog of over 12 million products, its entertainment subscription services, digital books, and convenient, fast delivery service make Amazon the powerhouse it is today.
Right behind Amazon, we find the Chinese brand, Alibaba, which earned $21.76 billion in 2025. Alibaba sells a wide range of products at wholesale prices. You’ll find electronics, home goods, beauty products, and even industrial supplies in their offerings. Alibaba’s business-to-business marketplace, which connects small and mid-size businesses directly to manufacturers, allows them to source bulk goods and makes this brand a popular choice. Other Chinese brands top the e-commerce earnings list too, like PDD Holdings (Pinduoduo) and Jingdong Mall (JD.com). Each of the top four e-commerce companies earned over 5 billion in revenue.
Turning to the other end of the chart, we find the brand with the most losses in 2025: Lightspeed POS. They reported a devastating $670 million loss. They earned $1.15 billion, but it wasn’t enough to cover their expenses. This Canadian e-commerce brand is a point-of-sale system for retailers and restaurants. It was once considered a promising company with rapid growth, but its revenue has shrunk significantly in the past few years as competitors have taken bites out of Lightspeed POS’s market. The British brand, ASOS, a clothing retailer, also suffered a massive $500 billlion loss in 2025. American brand Wayfair suffered losses, too, which is surprising considering its past popularity as an affordable home goods retailer with a big selection.
The figures we see here demonstrate that e-commerce is an industry with diverse companies and varying success rates. With tremendous gains and equally earth-shattering losses, we can see e-commerce is volatile, competitive, full of opportunities and challenges alike. The team’s data show that the industry’s biggest giants will be difficult to surpass. Companies like Amazon have set an astronomically high bar for success.
-
 Business Visualizations2 years ago
Everything Owned by Apple
-
 Business Visualizations2 years ago
America’s Most Valuable Companies Ranked by Profit per Employee
-
 Business Visualizations2 years ago
The Biggest Fortune 500 Company in Every State
-
 Business Visualizations1 year ago
The Biggest Employers by Industry
-

 Charts2 years ago
Map Uncovers Countries with Most Powerful Passports
-
 Business Visualizations11 months ago
The Largest Companies in America That Are Still Run by the Person Who Founded Them
-

 Timelines2 years ago
Timeline Charts the Development of Communications Technology
-

 Timelines2 years ago
The Evolution of Baby Names: A Century of Trends