Misc Visuals
Visualizing the Most Famous Phones in Pop Culture
Sometimes, props that could have quietly become part of a film’s scenery stand out as an iconic aspect that adds depth to a setting or character. Nothing illustrates this better than a chart created by Ooma displaying the 45 most famous phones in pop culture. On the chart we can see where and when these phones first appeared on screens, an illustrated rendering of them, and a bit of trivia telling us why this phone made an impact. As a whole, the chart makes us re-think how something as commonplace as a phone can help make a piece of media memorable.
Click below to zoom
Some phones help form part of our lasting impression of a character. For example, Pee-Wee Herman’s picture phone is a regular part of the show and adds texture to Pee-Wee’s whimsical world. In the film, Juno, the title character is a relaxed teen with a quick wit, who uses a phone shaped like a hamburger to add a sense of humor and childishness to otherwise serious conversations.
Here are some more examples that appear on the chart:
- TARDIS from Doctor Who
- Clear Conairphone from Clarissa Explains it All
- “Show Me the Money!” Flip Phone from Jerry Maquire
- Neo’s Cell Phone from The Matrix
- Shellphone from Spongebob Squarepants
- Glass Case of Emotion from Anchorman: The Legend of Ron Burgundy
How many phones do you remember from this list? Have any of them made you re-think the movie or show they appear in?
Charts
The Home Improvement Projects with the Strongest ROI
Deciding which home improvement projects are worth your time and money can yield big payoffs. Whether you think you’ll sell yourself soon or want to increase your comfort and value, you can use this new study from Ace Handyman Services to decide which projects to tackle. Their article “Which Handyman Home Improvement Projects have the Biggest ROI?” pinpoints the upgrades and repairs that will give you the greatest return on investment.
Click below to zoom.
The study focuses on cost-effective projects that offer a tangible increase in home value. These projects will improve the home’s functionality and make it look more cared for. Both qualities are appealing to potential buyers. Some of the top upgrades the team lists are garage door replacement, new entry doors, refinishing floors, fixing siding, and painting the walls. Landscaping and proper lawn care also go a long way toward increasing curb appeal. Nationwide surveys show that simple cosmetic upgrades can add over 100% of the project’s cost to the home’s value. This is particularly true if you paint in neutral or modern colors.
Experts also point to kitchen and bathroom improvements as good, modest cost investments. Replacing fixtures and cabinets can make a big difference. National data points to small-scale kitchen remodels recouping 80% to 96% of their costs, which is a much better ROI than big, expensive remodeling overhauls. We see in the team’s data that flooring and exterior upgrades also have a major impact. Well-maintained and upgraded floors are often worth more than the cost to do the project. New hardwood floors or sanding and refinishing floors add around $5,000 of resale value. A lawn care service has an enormous ROI of 217%, underscoring the massive impact of curb appeal. Upgraded landscaping can add $9,000 in value, and even simple landscape lighting can add around $4,000. You could also consider adding an outdoor fire feature, which would add $5,000 in value.
Overall, these projects had the highest ROI:
- Replacing the garage door
- Standard lawn care service
- Replace the entry door
- Install manufactured stone veneer
- Sand and refinish hardwood floors
- Install new hardwood floors
- Replace siding
- Paint interior
- Landscape maintenance
- Upgrade the landscape
The biggest message the team’s study underscores is that handyman projects can outperform big remodels and renovations in terms of increased home value. These handyman-friendly projects that the average DIYer can achieve represent a balance of cost-effectiveness, value impact, and everyday comfort enhancement. Always lean toward adding visual appeal and increasing functionality when deciding on ways to improve your home. The projects on this list will help you make a more beautiful, comfortable home without breaking your back. Whether you hire a handyman service or take on the project yourself, these projects are within your grasp and will give you a solid return on the investment.
Charts
The States Where Americans Give Hardware and Home Improvement Gifts
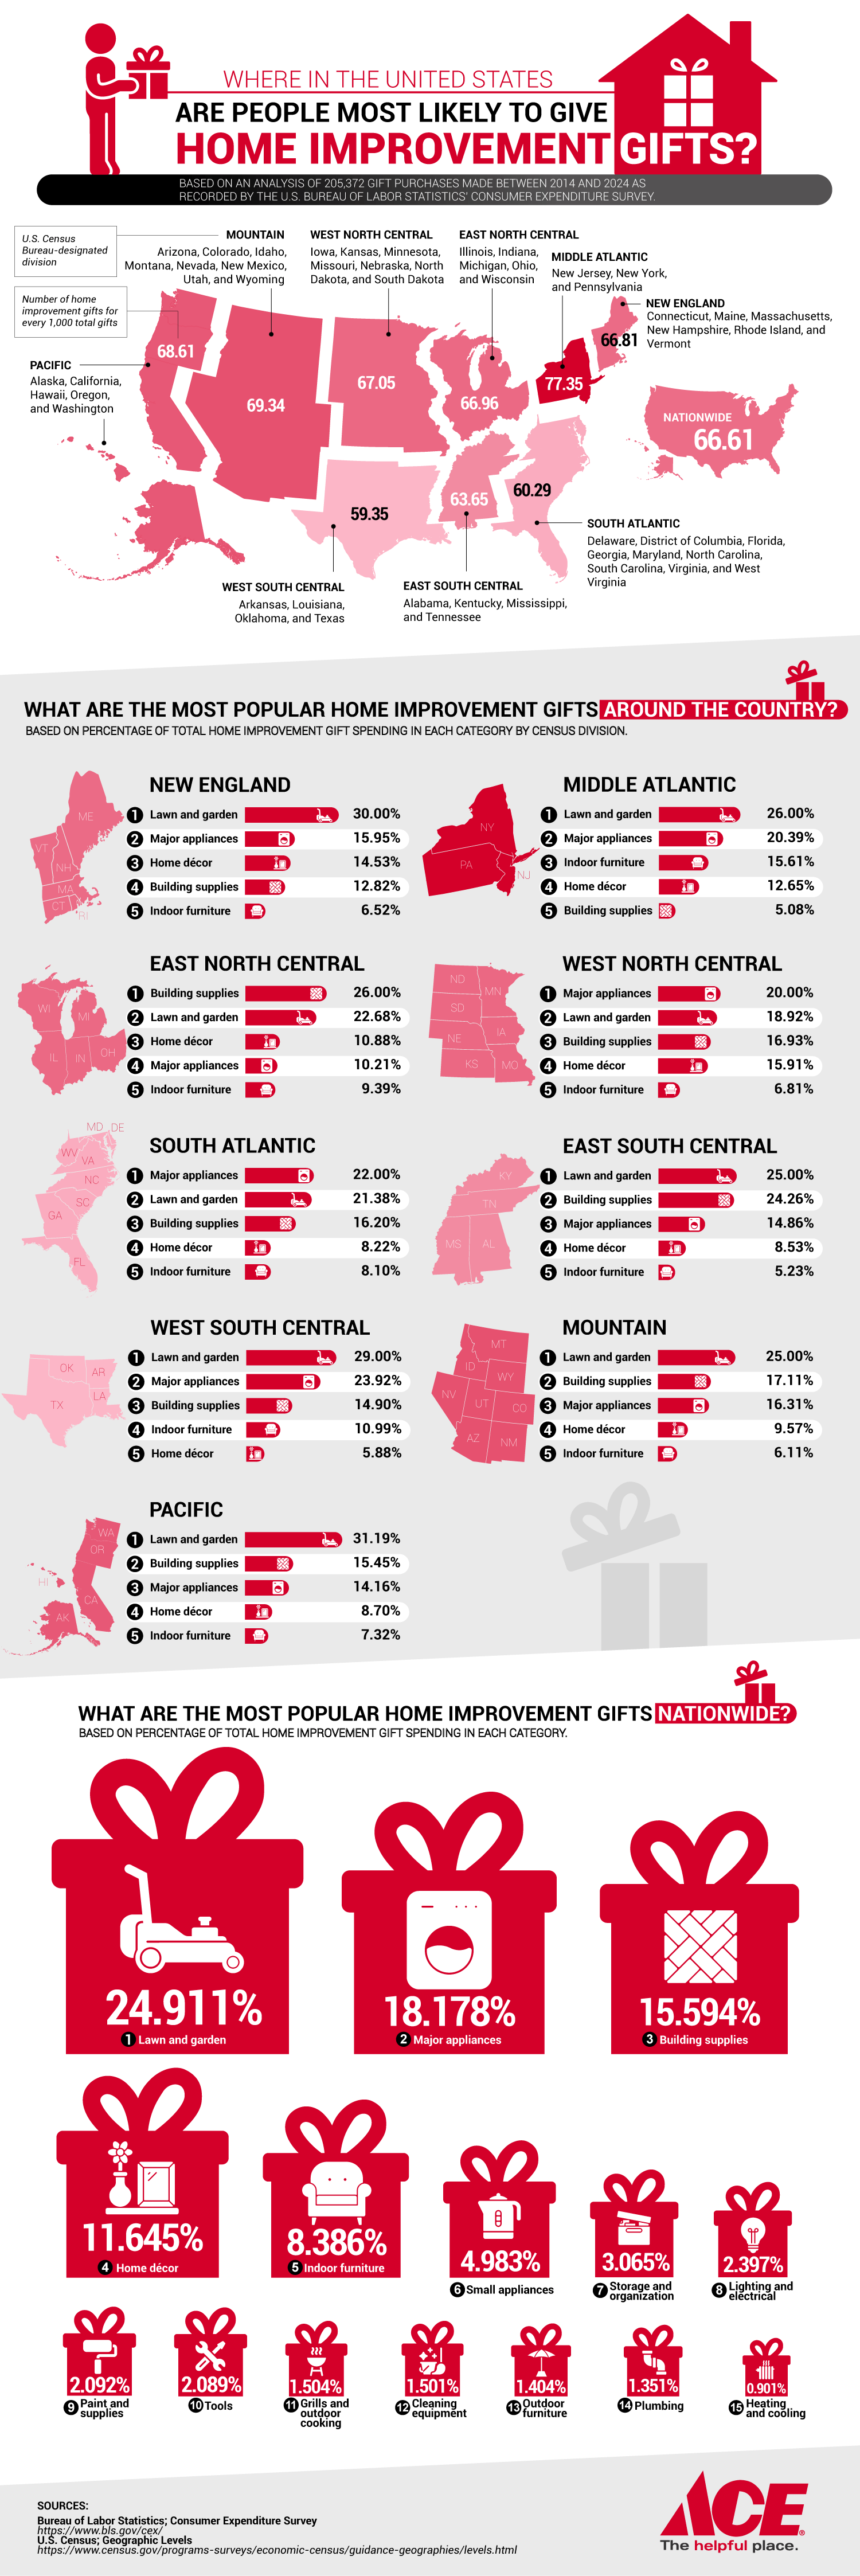
As the holidays approach, American families are thinking about gift-giving, and a trend stands out: Americans are giving home improvement and hardware items as useful and practical gifts. According to an Ace Hardware analysis of Bureau of Labor Statistics Consumer Expenditure Survey data spanning a decade of gift purchases, some regions are more likely to gift-wrap DIY tools, garden supplies, and appliances.
Click below to zoom.
Home ownership and upkeep are a major part of the American lifestyle. The team’s study found that 79% of homeowners undertake multiple home improvement projects each year, with many completing three or more. Americans spent $526 billion on home improvement in 2024. The number of projects per household has increased from 2.7 in 2015 to 3.4 in 2023. This commitment to home maintenance explains why hardware and home improvement supplies are a reliable gift choice, especially for people who live in older homes or in harsh climates.
According to the team’s study, the highest amount of home improvement gift-giving occurs in the Mid-Atlantic states, particularly New York, New Jersey, and Pennsylvania. In these states, 77.35 home improvement gifts were given out of every 1,000 gifts purchased. This is a higher rate than the national average of 66.61 gifts per 1,000 gifts purchased.
The popularity of home improvement gifts in the Mid-Atlantic is likely due to the region’s older homes. The median age of a New York home is 62, higher than the national home age median of 40 to 41. Older homes need more upkeep, upgrades, and repairs, making home improvement gifts all the more valuable and appreciated. The average age of homeowners in these properties is around 58, suggesting that these older homeowners have more financial stability to invest in larger home improvement projects. Extreme weather in these regions with cold winters and variable seasons necessitates ongoing maintenance.
The team determined the most popular types of home improvement gifts. Here’s how it broke down:
- Lawn and garden supplies – 24.91% of all home improvement gifts
- Major appliances – 18.18% of all home improvement gifts
- Building supplies – 15.59% of all home improvement gifts
- Home décor – 11.65% of all home improvement gifts
- Indoor furniture – 8.39% of all home improvement gifts
- Small appliances – 4.98% of all home improvement gifts
- Storage/organization items – 3.07% of all home improvement gifts
- Lighting/electrical supplies – 2.40% of all home improvement gifts
- Paint and painting supplies – 2.09% of all home improvement gifts
- Tools – 2.09% of all home improvement gifts
These numbers show that many Americans consider home improvement gifts to be both functional and meaningful. These gifts contribute to long-term comfort and the value of a home. The numbers might reflect that home improvement gifts are shifting beyond the scope of DIY aficionados to a universally appreciated gift. As homeowners juggle time and effort on the upkeep of their homes, these gifts can make their work easier and their home more enjoyable. Home improvement items are likely to remain a major aspect of holiday gift-giving.
Misc Visuals
How to Avoid Scams in 2025
Americans will collectively lose over $2 billion to scams this year. As technology advances, scammers and fraudsters use more sophisticated tactics that are harder for victims to identify and avoid. The team at Ooma created a list of up-to-date tips and methods to prevent fraud and scams via email, text, phone, and Internet messages. With proper prevention and education, people can avoid falling into a scammer’s trap. One in three people who have reported fraud lost money as a result, so the team’s advice can help people avoid getting too far into a scammer’s trap if they don’t prevent them entirely.
Click below to zoom.
Phone calls and text messages can be very tricky. Many people have caught on to the practice of avoiding calls from unknown area codes. Lately, scammers have taken advantage of neighborhood spoofing. They use a familiar area code so the people they call are more likely to think it’s someone they know and answer.
Ooma offers these tips for avoiding and navigating scams via the phone:
- Despite number spoofing, you should still avoid answering unknown calls, as answering lets the scammer know your number is active.
- Never share sensitive information like your full Social Security number over the phone. A legitimate company will never request this.
- If the caller starts pressuring you to do something like send money or share information urgently, you can assume they’re a scammer and don’t feel guilty about hanging up the phone.
- Don’t click on links sent through text. It can lead to malware.
- Never act on requests to send money through unusual means like gift cards or cryptocurrency.
- Use spam filters and call-blockers to limit the messages you receive.
- Report spam numbers to your carrier.
Email scams can be just as malicious and difficult to detect, even after getting past malware protection and spam blockers. Here are some of the team’s tips for avoiding email scams:
- Go directly to a website’s domain rather than click on links in unsolicited emails.
- Check the sender’s full address and look out for signs that the address was spoofed.
- Hover your mouse over links to make sure they’re legitimate. Malware domains often include spammy nonsense in their names or names that don’t match the alleged sender.
- Use two-factor authentication on email and logins.
- Make sure your software’s malware protection is up to date.
- If you aren’t sure how to handle a phishing scheme once you’re ensnared, practice with emulators that can help you learn what to say and do.
- Be aware that scammers sound more legitimate these days thanks to the power of AI.
- Have a plan in place for what to do in the event of falling victim to a scam. You should change your passwords and contact your bank immediately.
Ooma’s steps can’t completely eliminate the possibility of fraud, but they are strong best practices to prevent encountering scammers and to deal with them if they contact you. If you follow these steps carefully, you’re very unlikely to lose money to a scam.
-

 Business Visualizations1 year ago
Everything Owned by Apple
-

 Business Visualizations1 year ago
America’s Most Valuable Companies Ranked by Profit per Employee
-

 Business Visualizations11 months ago
The Biggest Fortune 500 Company in Every State
-

 Business Visualizations8 months ago
The Biggest Employers by Industry
-

 Maps2 years ago
Penis Lengths Around the World
-

 Timelines2 years ago
A History of the Oldest Flags in the World
-

 Business Visualizations2 years ago
New Animated Map Shows Airbnb’s Fully Booked Cities Along the 2024 Eclipse Path of Totality
-

 Business Visualizations2 years ago
Everything the Luxury Giant LVMH Owns in One Chart


