
Charts
Study Reveals How Age Shapes Social Media Preferences

Social media platforms connect billions of people worldwide every day, but these platforms aren’t uniform. They’re diverse micro-societies reflecting different age groups at different rates. Ooma’s new infographic analyzes social media usage patterns to deliver insights about generational preferences and a picture of the digital landscape’s influence on information spread.
The Ooma team used data from the Pew Research Center’s Social Media Fact Sheet and other reputable sources of social media demographics. Their approach gives us domestic and global information on platform usage numbers, which is valuable for researchers, marketers, and the digitally curious.
Click below to zoom.
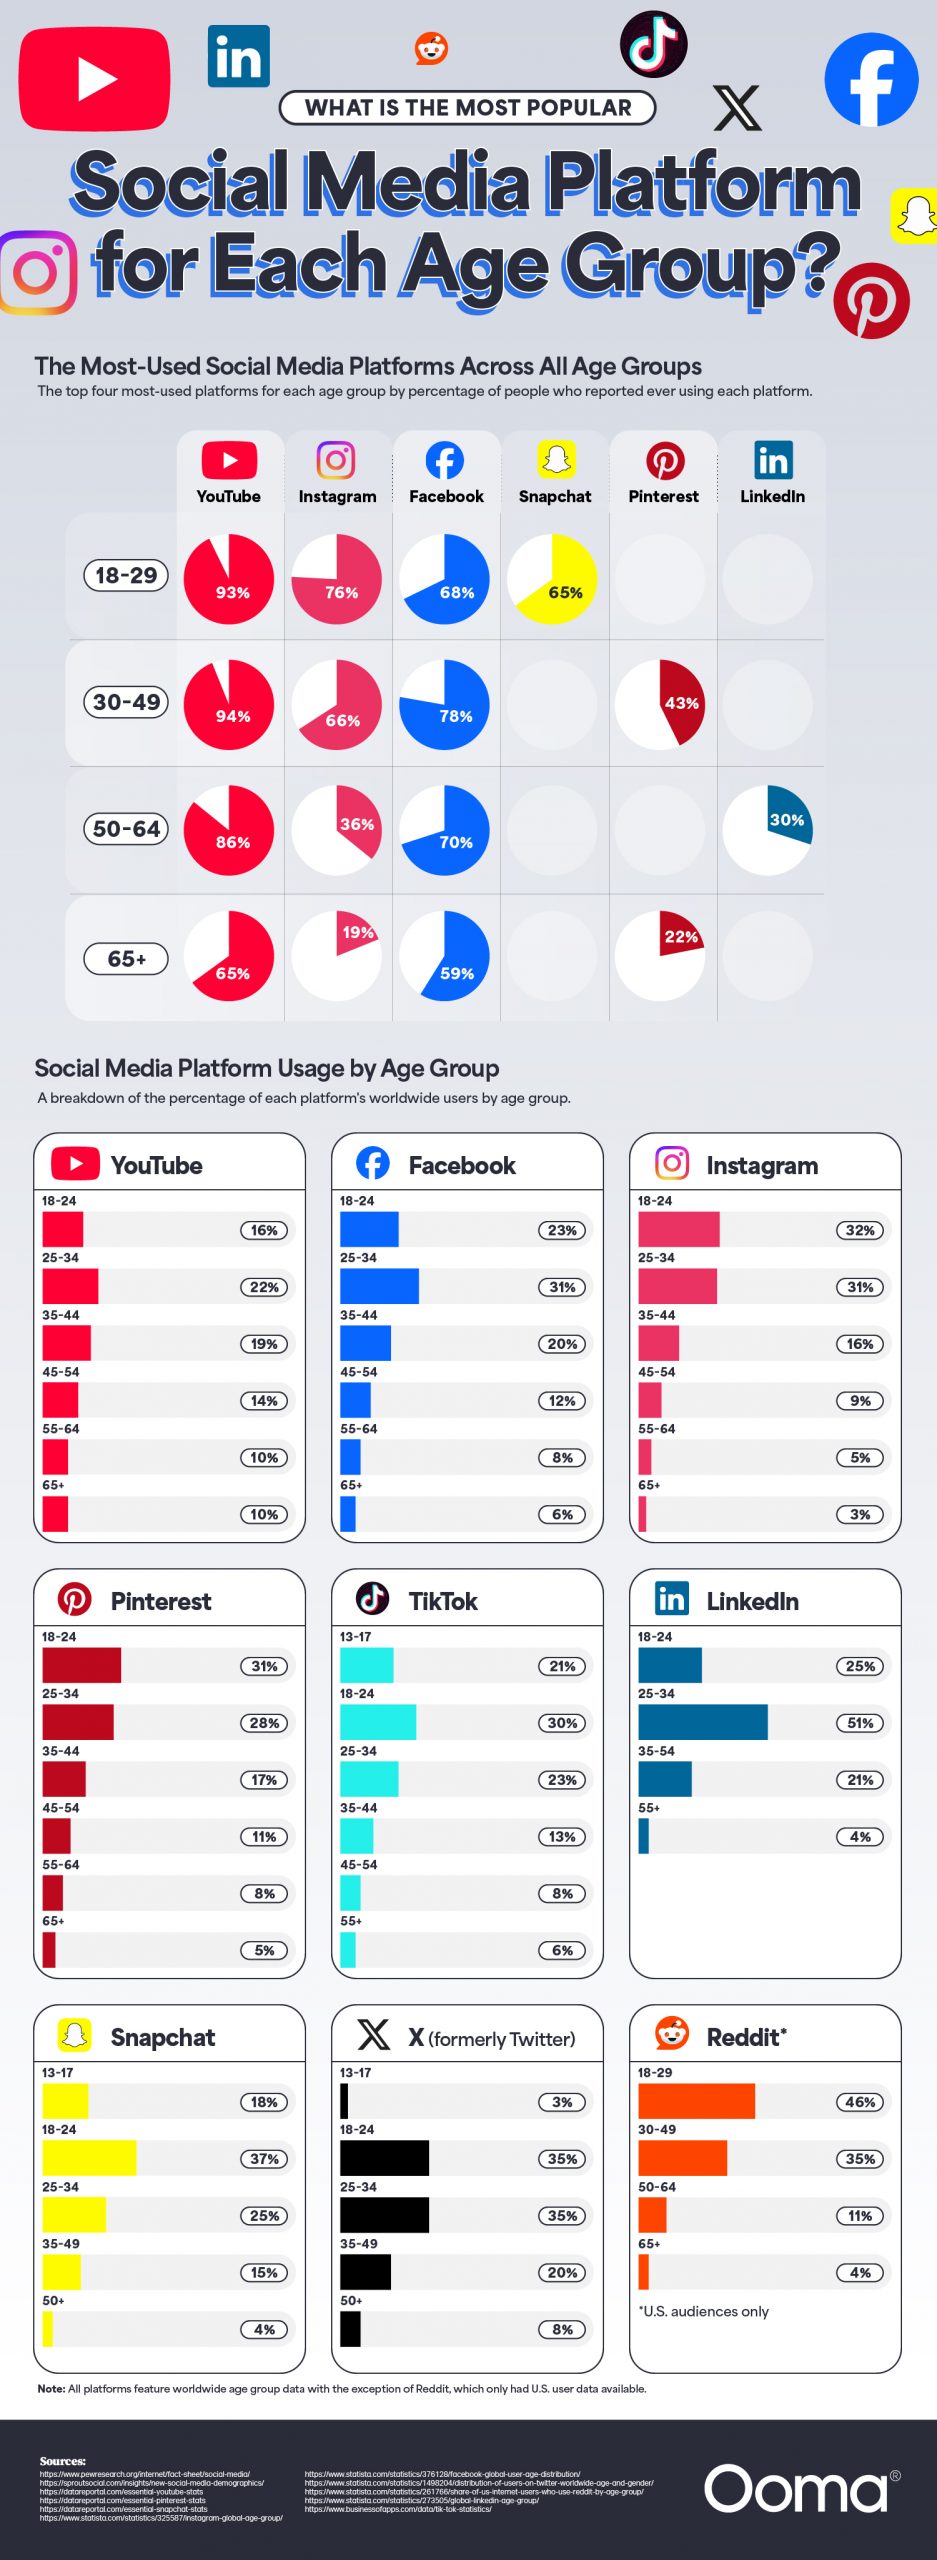
A stand-out finding is YouTube’s enormous popularity across all American age groups. The platform brags 93% usage among 18–29-year-olds, 94% among 30–49-year-olds, 86% among 50–64-year-olds, and 65% among those 65 and older. YouTube is so widely used that it’s the second-largest search platform after Google. Anyone who wants quick video results can turn to YouTube to ask questions, but more than that, it’s a source of entertainment and education, too. With something for everyone, it’s no wonder YouTube is universally popular.
Facebook offered us some surprising data. It’s usually considered a platform for older generations, but the data defies this stereotype and shows us a platform with cross-generational appeal. 68% of people between 18 and 29 reported Facebook usage, and 78% between ages 30 and 49 did too. These numbers among younger people are nothing to sneeze at. Facebook has over 3 billion users worldwide, with a user base that clearly encompasses more than baby boomers and Generation X. Facebook’s staying power is impressive given the rise of up-and-coming apps like TikTok and Snapchat.
While YouTube and Facebook enjoy universal appeal, the infographic does reveal some age-based patterns for certain platforms. TikTok is certainly popular among younger users, with 59% of people aged 18 to 29 reporting that they use it, and only 10% of users over 65. TikTok’s user base tends to be young worldwide, with 30% of its users aged 18 to 24, and 21% between 13 and 17.
LinkedIn skews much older with usage peaking among 50- to 64-year-olds. This is no surprise as LinkedIn is primarily a professional platform made for business connections rather than entertainment or social sharing.
The data also reflects major shake-ups in a social media company that affect user bases. X, formerly known as Twitter, lost 2.7 million active users in just two months in December of 2024 after actions taken by CEO Elon Musk. The platform seems most geared toward people between 18 and 34, who comprise 34% of the user base.
These patterns show how age groups can affect social media usage and suggest what aspects of a platform attract different groups. The findings underscore how important it is for platforms of all kinds to adapt to changing culture and demographic needs or risk being left behind as exciting new platforms rise to take their place.
Translation apps promise to dissolve language barriers with a tap, turning your phone into a pocket interpreter. A new study from Preply suggests that convenience comes at a cost. After surveying 1,200 Americans who have used these tools while traveling abroad, Preply found that 57% considered the apps robotic and unnatural, leaving travelers feeling that something essential was missing from their interactions with locals.
Click below to zoom.
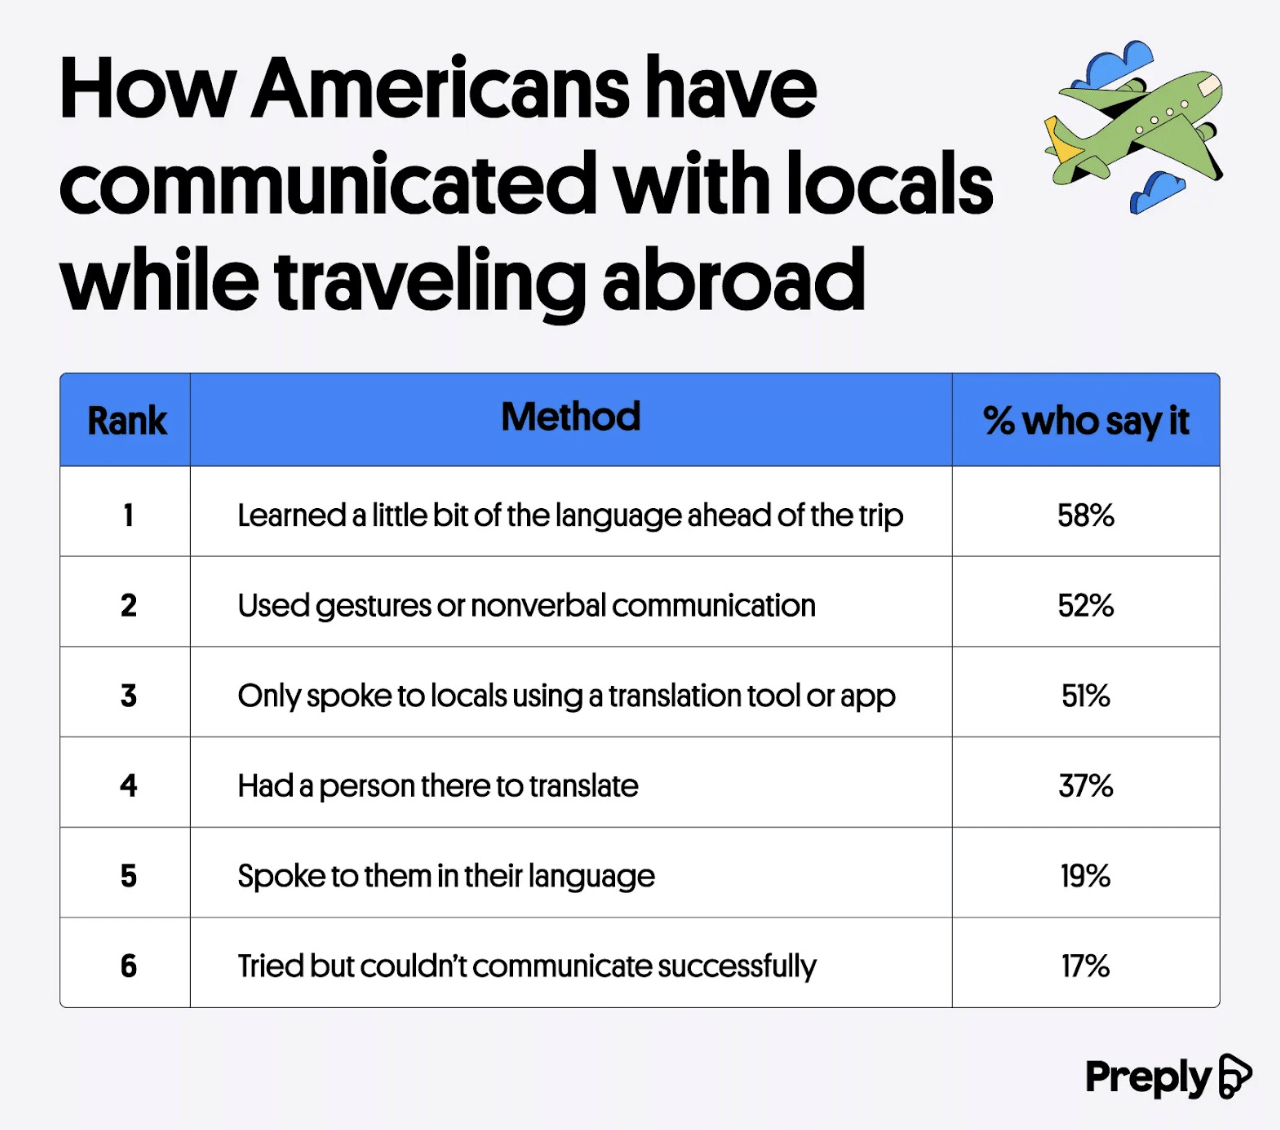 The study’s first graph breaks down how Americans usually communicate when they travel, and the most popular solution is low-tech. Nearly three in five respondents said they learned some of the local language before their trip so they could use it themselves. Gestures and pointing, along with facial expressions, were also popular when asking for food or directions. Half of respondents used a translation app or tool, while two in five used in-person translators. Almost one in five could speak the local language, either from prior knowledge or from efforts to study before the trip. 17% said they still struggled to communicate despite their best efforts.
Click below to zoom.
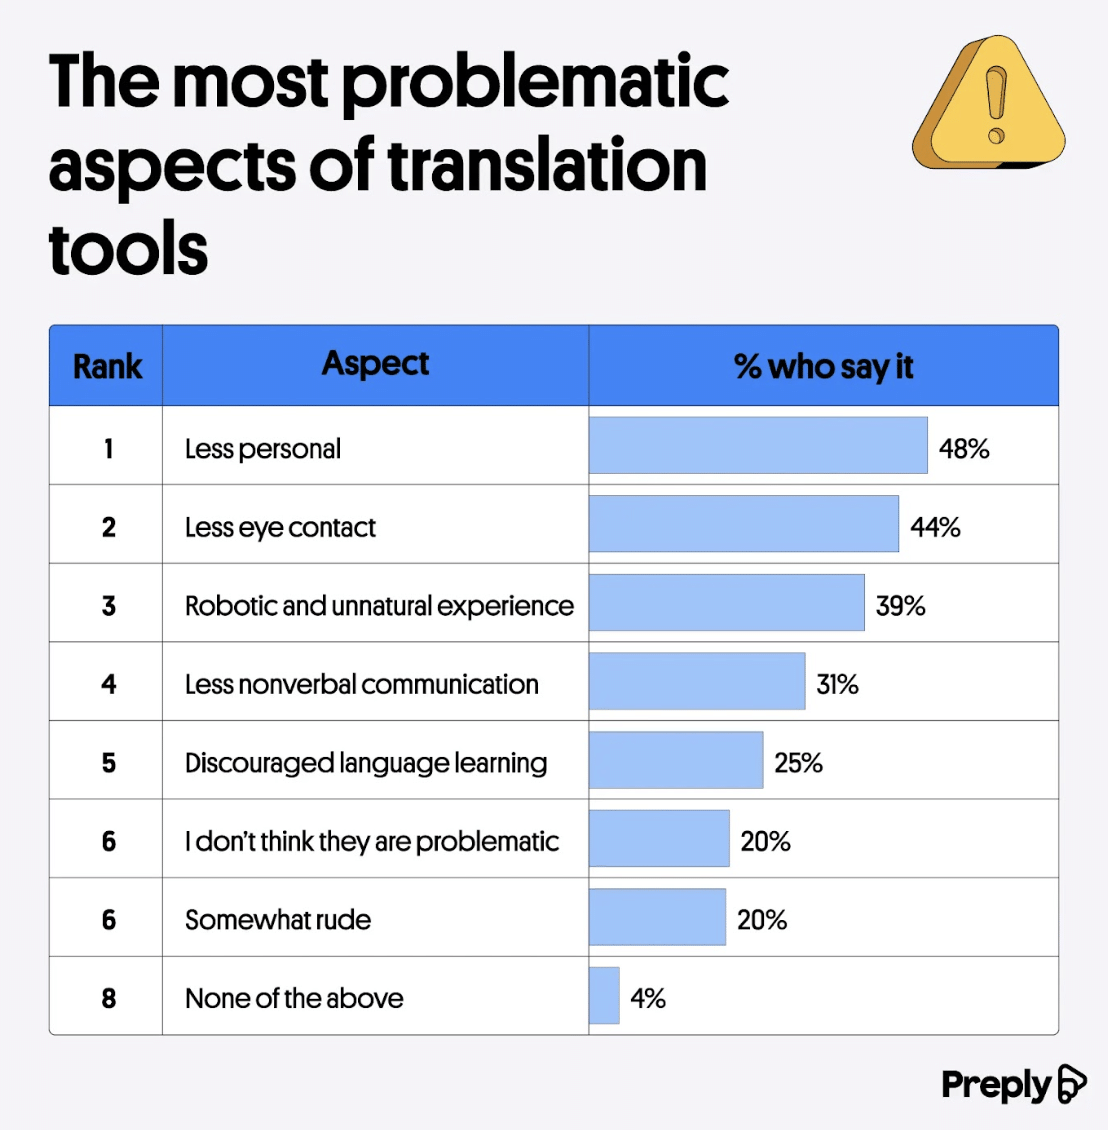 The second visual shows what travelers don’t like about translation apps. Most complaints center around human connection. Nearly half of travelers said technology made interactions less personal, and more than two in five were bothered by the lack of eye contact because the user must watch the screen. Body language and eye contact help people build rapport, but a device in the middle can disrupt this connection. One in five travelers described real-time technology as somewhat rude. A third of respondents reported an awkward moment while using the tool, and nearly one in three said the app made their trip feel less immersive.
The tools might also undercut long-term learning. More than a third of travelers felt translation technology discouraged them from learning more of the language, and 52% were frustrated that an app can’t communicate tone or cultural nuance.
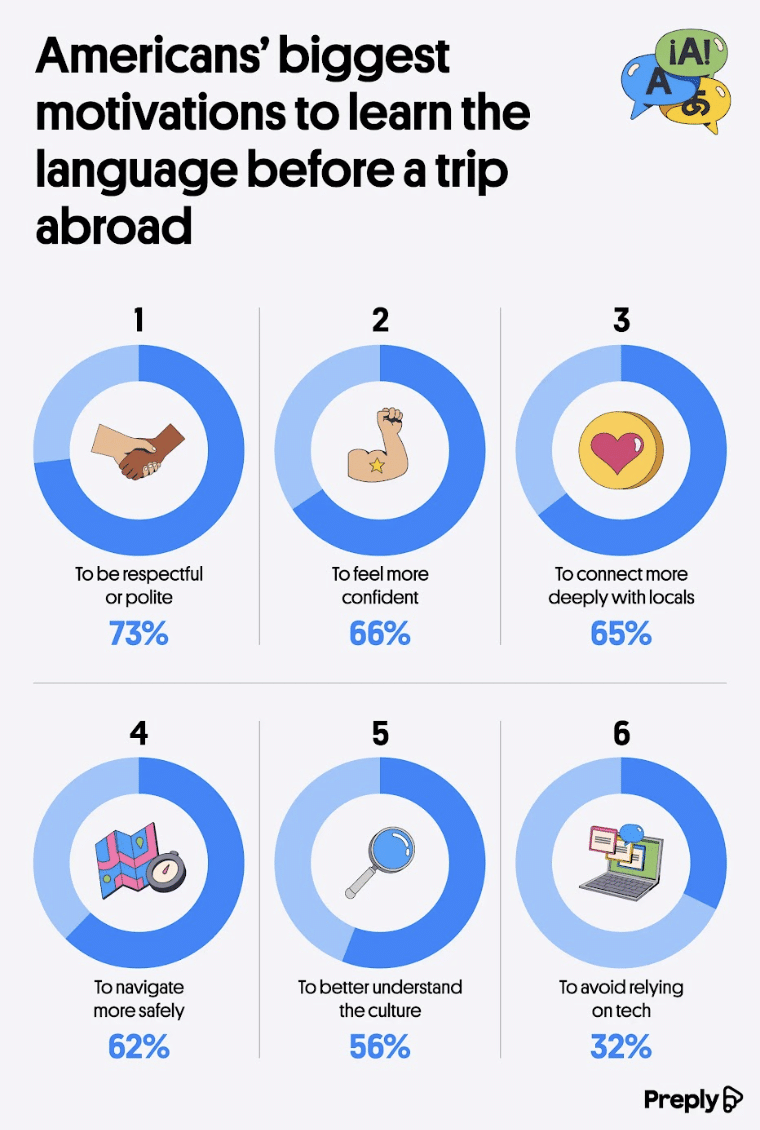
The final visual aid examines what motivates travelers to study a language before setting out on a trip. Half of Americans who traveled abroad took some kind of language class beforehand. The top reason chosen by 73% of respondents was a desire to be polite and respectful. Two-thirds wanted to feel more confident when traveling, and 65% hoped to connect more deeply with locals. Looking ahead, 65% of Americans said they want to learn more of the local language before a future trip.
That doesn’t mean travelers are abandoning their apps. More than two-fifths expect to rely on translation tools more the next time they travel. One in six plan to use these tools less.
Preply offers us a balanced conclusion. Translation apps are a remarkable technology that works best in moderation. Knowing a handful of phrases can transform a transactional exchange into a genuine moment of connection. That connection is something no app has managed to replicate.

As new technologies transform industries and create new skills demand, this analysis from Altium ranks states by how well their workforces are positioned to meet the future and a changing economy. The article, graphs, and maps show that tech readiness doesn’t always match a high-tech reputation.
Click below to zoom.
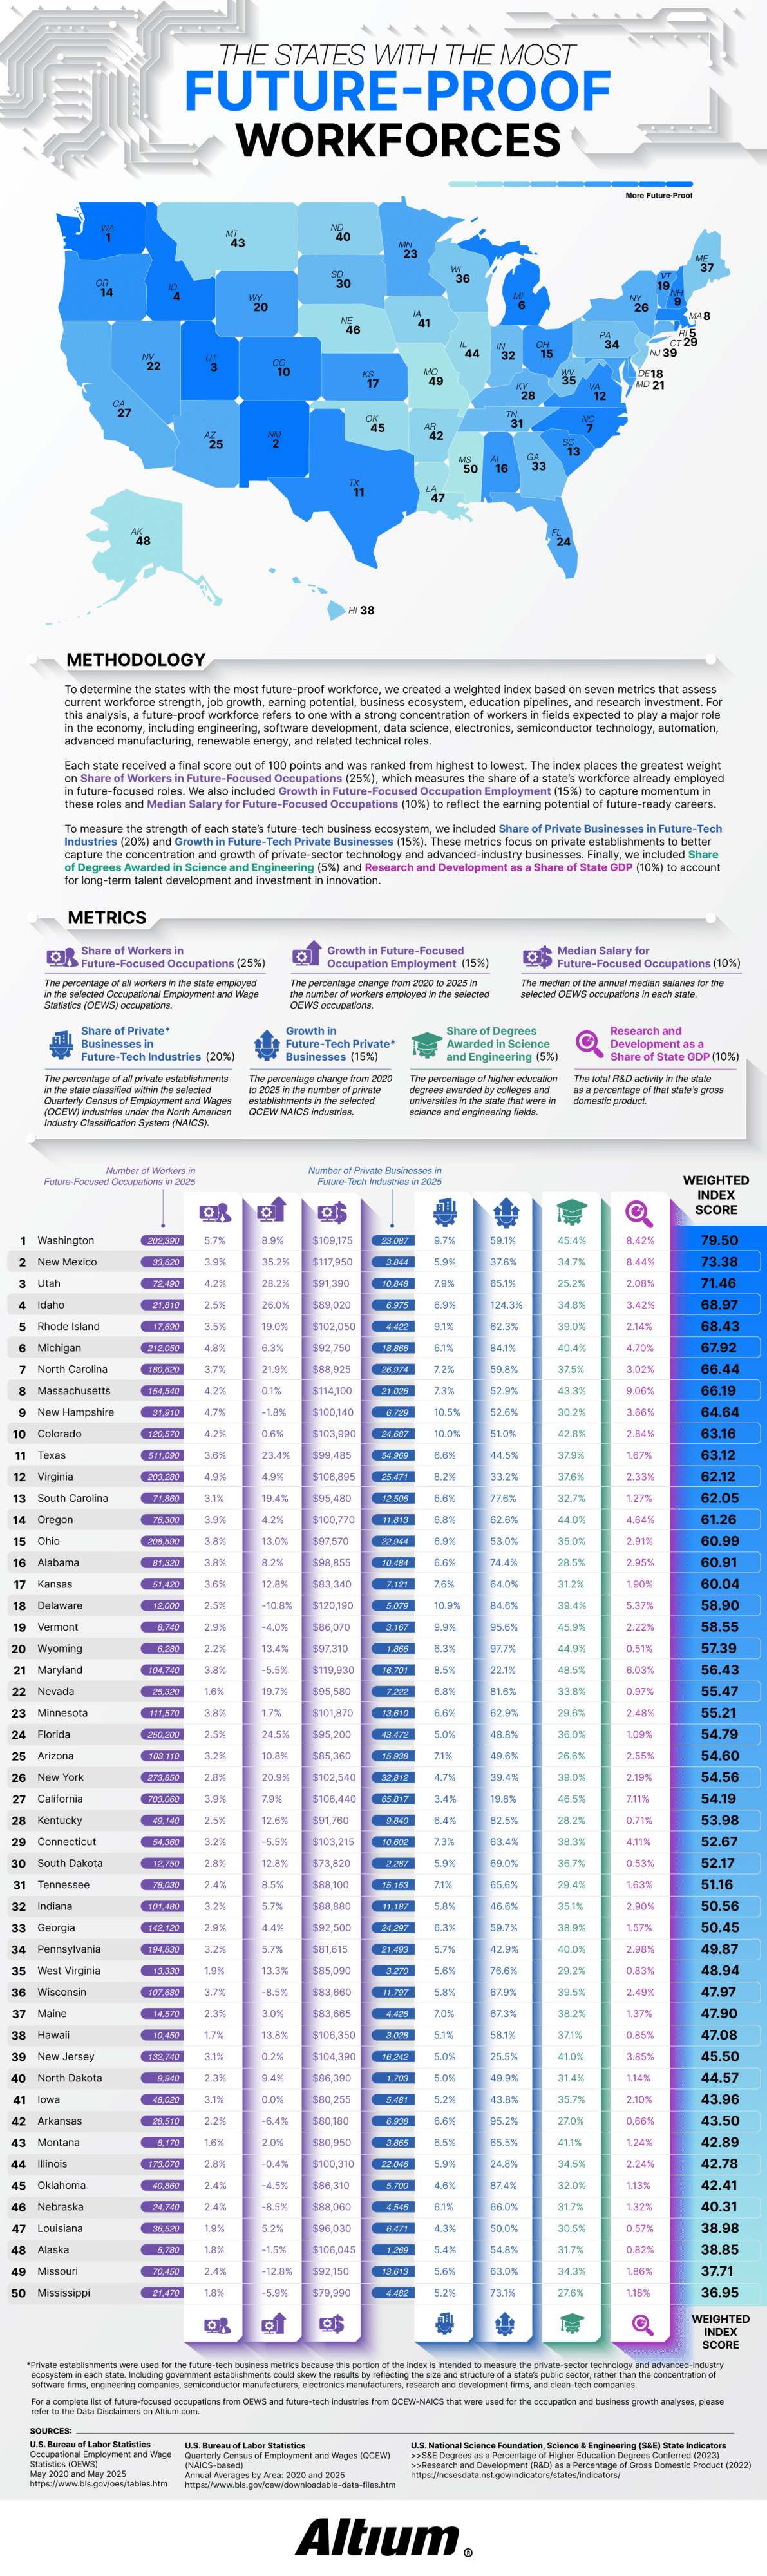
Altium defined a future-proof workforce as one with a large share of workers in fields expected to drive economic growth over the next few decades. The study tracked 30 occupations using data from the Bureau of Labor Statistics, including electrical and computer hardware engineers, software developers, data scientists, solar installers, semiconductor processing technicians, CNC programmers, and wind turbine technicians. The team considered 27 “future-tech” industries from aerospace to renewable energy to semiconductor manufacturing and R&D services.
Each state received a score out of 100 based on seven weighted metrics. The largest factor at 25% was the share of workers already employed in future-focused positions. The share of private businesses in future-tech industries was worth 20%. Employment growth and business growth from 2020 to 2025 counted for 15%. Median salary and research and development as a share of state GDP each accounted for 10%, and the share of science and engineering degrees made up the final 5%.
Washington took first place with a score of 79.50. Nearly 6% of the workforce there holds future-focused jobs and earns a median salary of $109,175. Washington’s future-tech businesses grew 59.1% over five years. The article credits the state’s concentration of software and aerospace employers, noting that Washington leads the nation in aerospace sales, exports, and employment.
The runner-up is more surprising! New Mexico ranked second, thanks to its 35.2% growth in future-focused employment. That’s the fastest growth rate in the country. Thanks to national laboratories and an expanding aerospace sector, it has one of the highest median salaries in the study at $117,950. Utah, Idaho, and Rhode Island round out the top five rankings. Idaho stood out for business expansion, with future-tech businesses growing by an eyebrow-raising 124.3%.
The study’s most confusing findings relate to California. The state employs 703,060 people in future-focused occupations, more than any other state, yet it only ranks at #27. Although California is strong in engineering education and R$D investment, future-tech industries make up only 3.4% of its private businesses. Its five-year business growth rate of 19.8% is the lowest in the nation.
Smaller states benefited when technology made up a larger slice of their economies. Rhode Island’s future-tech businesses represent 9.1% of its private sector and grew 62.3%. New Hampshire ranked ninth with the highest future-tech business share in the top ten at 10.5%. Rounding out the top ten were Michigan, North Carolina, Massachusetts, and Colorado.
Mississippi finished last with a score of 36.95, followed by Missouri, Alaska, Louisiana, and Nebraska. Several of these states saw a decline in future-focused occupations. The key takeaway is that a state’s headcount or Silicon Valley reputation alone doesn’t define its readiness for the future. A growing technical workforce and a dense base of tech businesses best position a state for the future.
Around 80% of Americans believe that learning a few words of the local language matters before they travel abroad. Only 58% of those Americans actually go so far as to learn some words. That twenty-two-point gap is the basis of Preply’s report on language anxiety and travel, supplemented by visuals to support the data on this anxiety.
The report opens on this contradiction between belief and action and sharpens the data. It shows that 40% of travelers admit to cramming language lessons at the airport or on the plane. Only 25% begin practicing the language of their destination months ahead of time. 32% side-step the problem entirely by choosing destinations where English is the dominant language or prevalent enough to carry travelers through.
Two ranked charts are the center of the report and comparing their results offers eye-opening details. The first chart shows that in 2026, Italy topped the wish list of American travel destinations. Australia, Ireland, the UK, and France followed.
Click below to zoom.
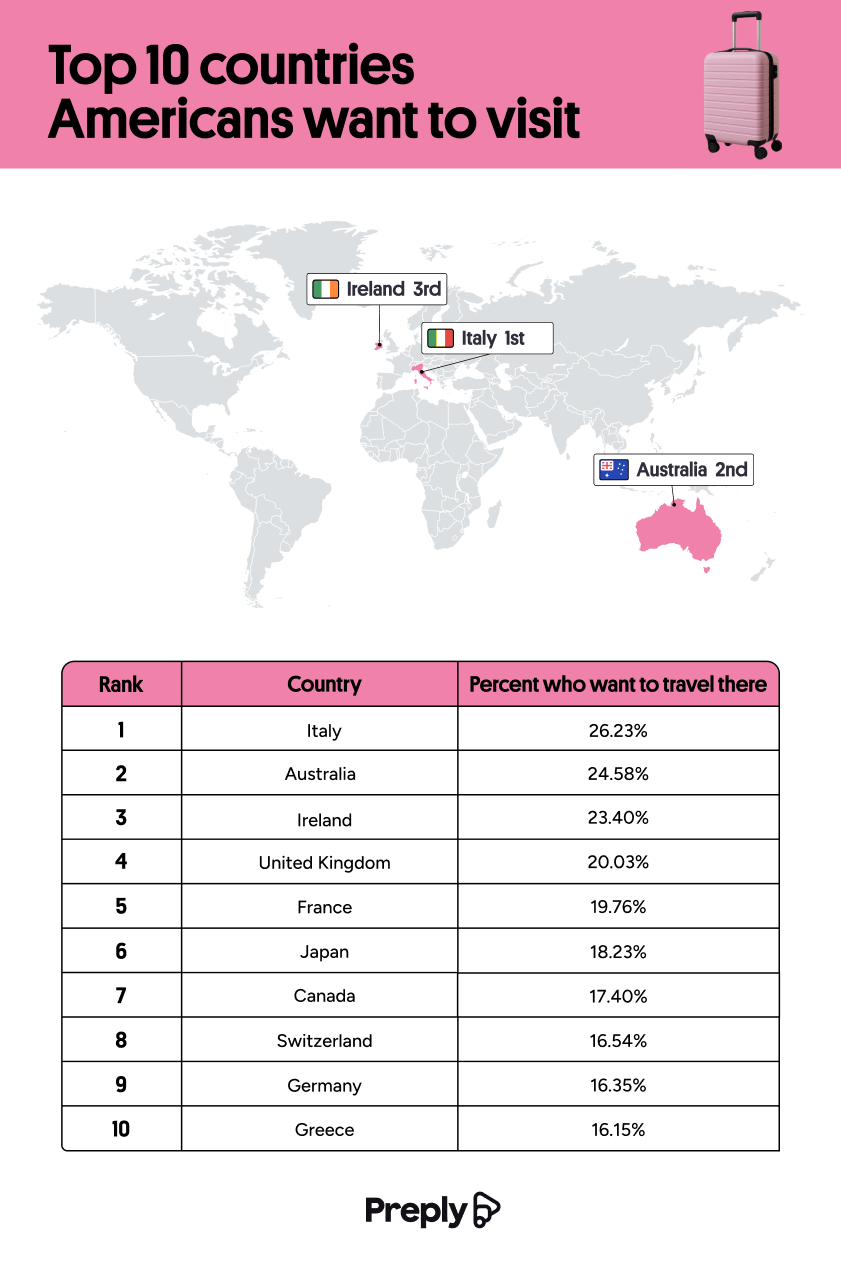 The second chart ranked where Americans would consider living. Australia and the UK tie at 20% of the answers, and Canada follows closely at 19%. Three of the top five travel destinations are largely English-speaking, and the relocation list you’ll note was entirely English-speaking.
Japan demonstrates this split dramatically. 18% of Americans would like to visit Japan, but only 10% would consider living there. Comfort clearly wins out over desire when it comes to relocation.
The demographic section shows even more interesting trends. Gen Z is nearly three times as likely as Boomers to want to visit Japan (24.4% versus 8.6%). They’re also more than twice as likely to consider living there (13.4% versus 5.3%). Ireland runs the opposite direction, with 26.2% of Boomers wishing to visit and only 9.8% of Gen Z. This is the biggest generational gap in the survey.
The pattern suggests that Boomers gravitate toward English-speaking destinations, while Gen Z showed stronger interest in places like Japan, Korea, Brazil, Colombia, and Thailand. Gender splits emerged too, with women favoring Italy, Ireland, and Greece, and men dreaming of Japan at 24% versus women’s 14%.
A horizontal bar graph ranks the barriers to visiting non-English-speaking destinations. 37% of Americans assume the native language is too difficult to learn. 35% believe English is understood well enough to get by without learning. 33% of respondents said they’re bad at learning languages, 32% cite lacking the time to learn, and 31% fear offending a native speaker by mistake. When ranking language intimidation by country, China led at 37%, Japan followed at 34%, then Korea at 24%, and Thailand at 13%.
A graphic on language faux pas showed that 35% of Americans point to menu items rather than attempting pronunciation, 23% speak louder and slower, and 17% buy American fast food for familiarity—only 15% attempt to mimic the local accent, which the Preply team gently discouraged.
The big takeaway seems to be that 45% of Americans would travel more if they spoke another language.
-
 Business Visualizations2 years ago
America’s Most Valuable Companies Ranked by Profit per Employee
-
 Business Visualizations2 years ago
The Biggest Fortune 500 Company in Every State
-
 Charts2 years ago
Map Uncovers Countries with Most Powerful Passports
-
 Business Visualizations1 year ago
The Biggest Employers by Industry
-
 Business Visualizations1 year ago
The Largest Companies in America That Are Still Run by the Person Who Founded Them
-
 Charts2 years ago
Study Highlights Disparity Between Homelessness Rates and Empty Housing
-
 Misc Visuals2 years ago
Exploring Science Fiction Technology That Became a Reality
-
 Charts1 year ago
New Study Reveals Details About American Intimacy