Maps
Explore the Most Translated Books in the World
Wide translation is a hallmark of a book and an author’s success and influence, indicating high readership and a place in the world’s cultural consciousness. The team at Preply shows us which novels have earned that honor with a map showing the most translated book from every country in the world (based on the author’s origin). This map offers a fascinating look into a vast world of literature, featuring timeless classics and some books with unexpected popularity.
Click below to zoom.
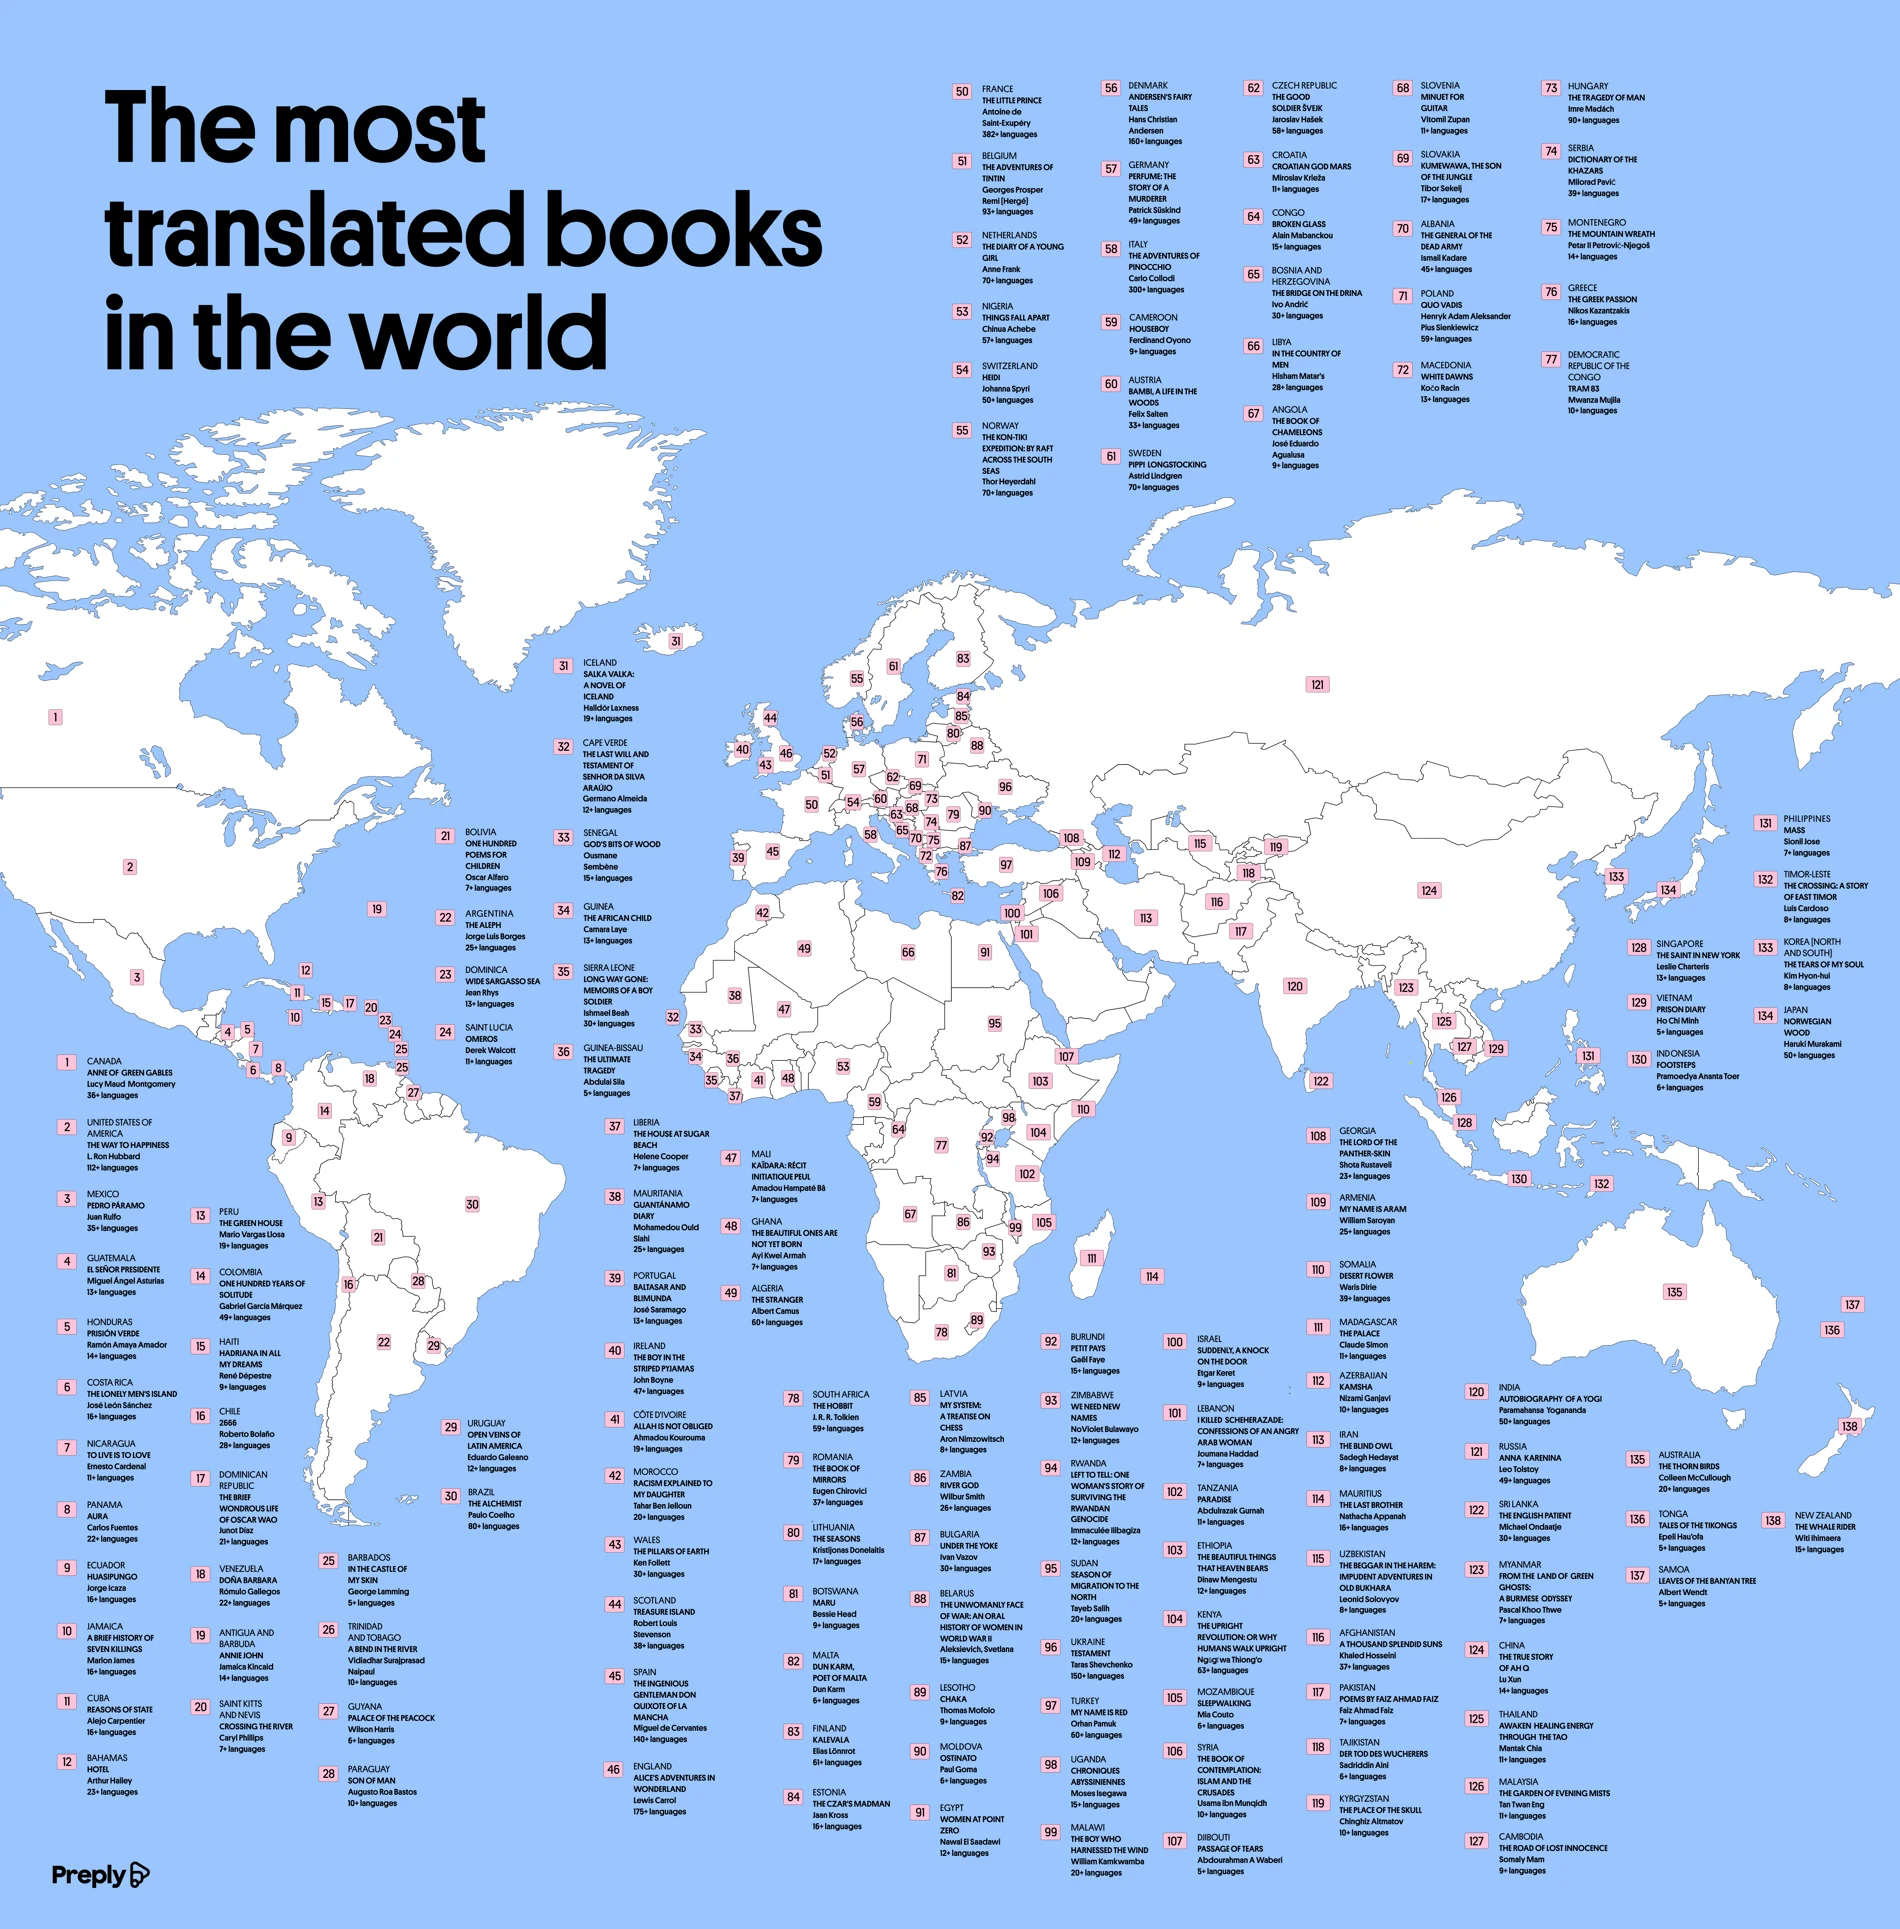
It’s likely no surprise to readers that the Bible is the most translated book, available in over 700 languages. After the Bible, the world’s most translated work is a charming children’s book from France. The Little Prince is an illustrated novel for young readers by Antoine de Saint-Exupéry, available in hundreds of languages. The book’s themes of friendship, loss, loyalty, responsibility, and love resonate with children and adults alike all over the world.
North American favorites include Canada’s coming-of-age tale, Anne of Green Gables. The author L.M. Montgomery overcame a sexist literary world to prove her worth, with 36 translations of her novel, which has been widely popular since its release and has had staying power over many of her contemporary male peers. As for the United States, it may be surprising to learn that the most translated book is a 1980 self-help title, The Way to Happiness, written by L. Ron Hubbard, a sci-fi author and founder of the niche religion Scientology.
Moving on to South America, it’s not surprising that we find some beloved works of magical realism. This subgenre originated in South America, and some of its most translated works represent magical realism’s enduring legacy, including The Alchemist by Paulo Coelho and One Hundred Years of Solitude by Gabriel Garcia Marquez.
As for Europe, home to many literary giants besides France’s Saint-Exupéry, we see a lot of representation of children’s novels. Italy’s Carlo Collodi penned The Adventures of Pinocchio. The world-famous wooden puppet who dreamed of being a real boy has a tale that’s been translated into over 300 languages. England’s most translated book is not a play by Shakespeare, but Lewis Carroll’s bizarre and imaginative tale, Alice’s Adventures in Wonderland. And, of course, Europe is the origin of world-famous fairy tales, penned by some of the most widely translated authors, including Jacob Grimm of Germany and Hans Christian Andersen of Denmark.
Africa is a massive continent packed with unique cultures, but the most translated African title is from Kenyan author Nagugi wa Thiong’o with The Upright Revolution: Or Why Humans Walk Upright, a fable that explains why humans walk on two legs and what connects humans worldwide. While often associated with France, Albert Camus was born in Algeria and claims its most translated book, The Stranger. The same is true of Oxford professor and author J.R.R. Tolkien, the father of modern fantasy. He was born in South Africa and claims to have written their most translated title, The Hobbit.
Asia has its own diverse and ancient literary traditions, but its most translated novel was a more recent title from 1998. Turkey’s Orhan Pamuk wrote a novel called My Name is Red, translated into more than 60 languages. Meanwhile, contemporary Japanese author Haruki Murakami takes the number two spot with his novel, Norwegian Wood.
Lastly, the map zooms in on Oceania, where we find Australia’s most translated novel, The Thorn Birds by Colleen McCullough, and New Zealand’s The Whale Rider, which was adapted into a critically-acclaimed film about the Māori community.
Compatibility is usually our biggest driver in the search for a romantic partner, but it turns out that age is still a major part of that compatibility. Tawkify’s matchmaking service surveyed about 98,798 Americans over two years, asking whether they’d date someone older and younger and how far outside their own age range they’d go. The data reveal both geographic and dating patterns, with a recurring pattern: smaller dating pools push singles to date across wider age ranges.
Click below to zoom.
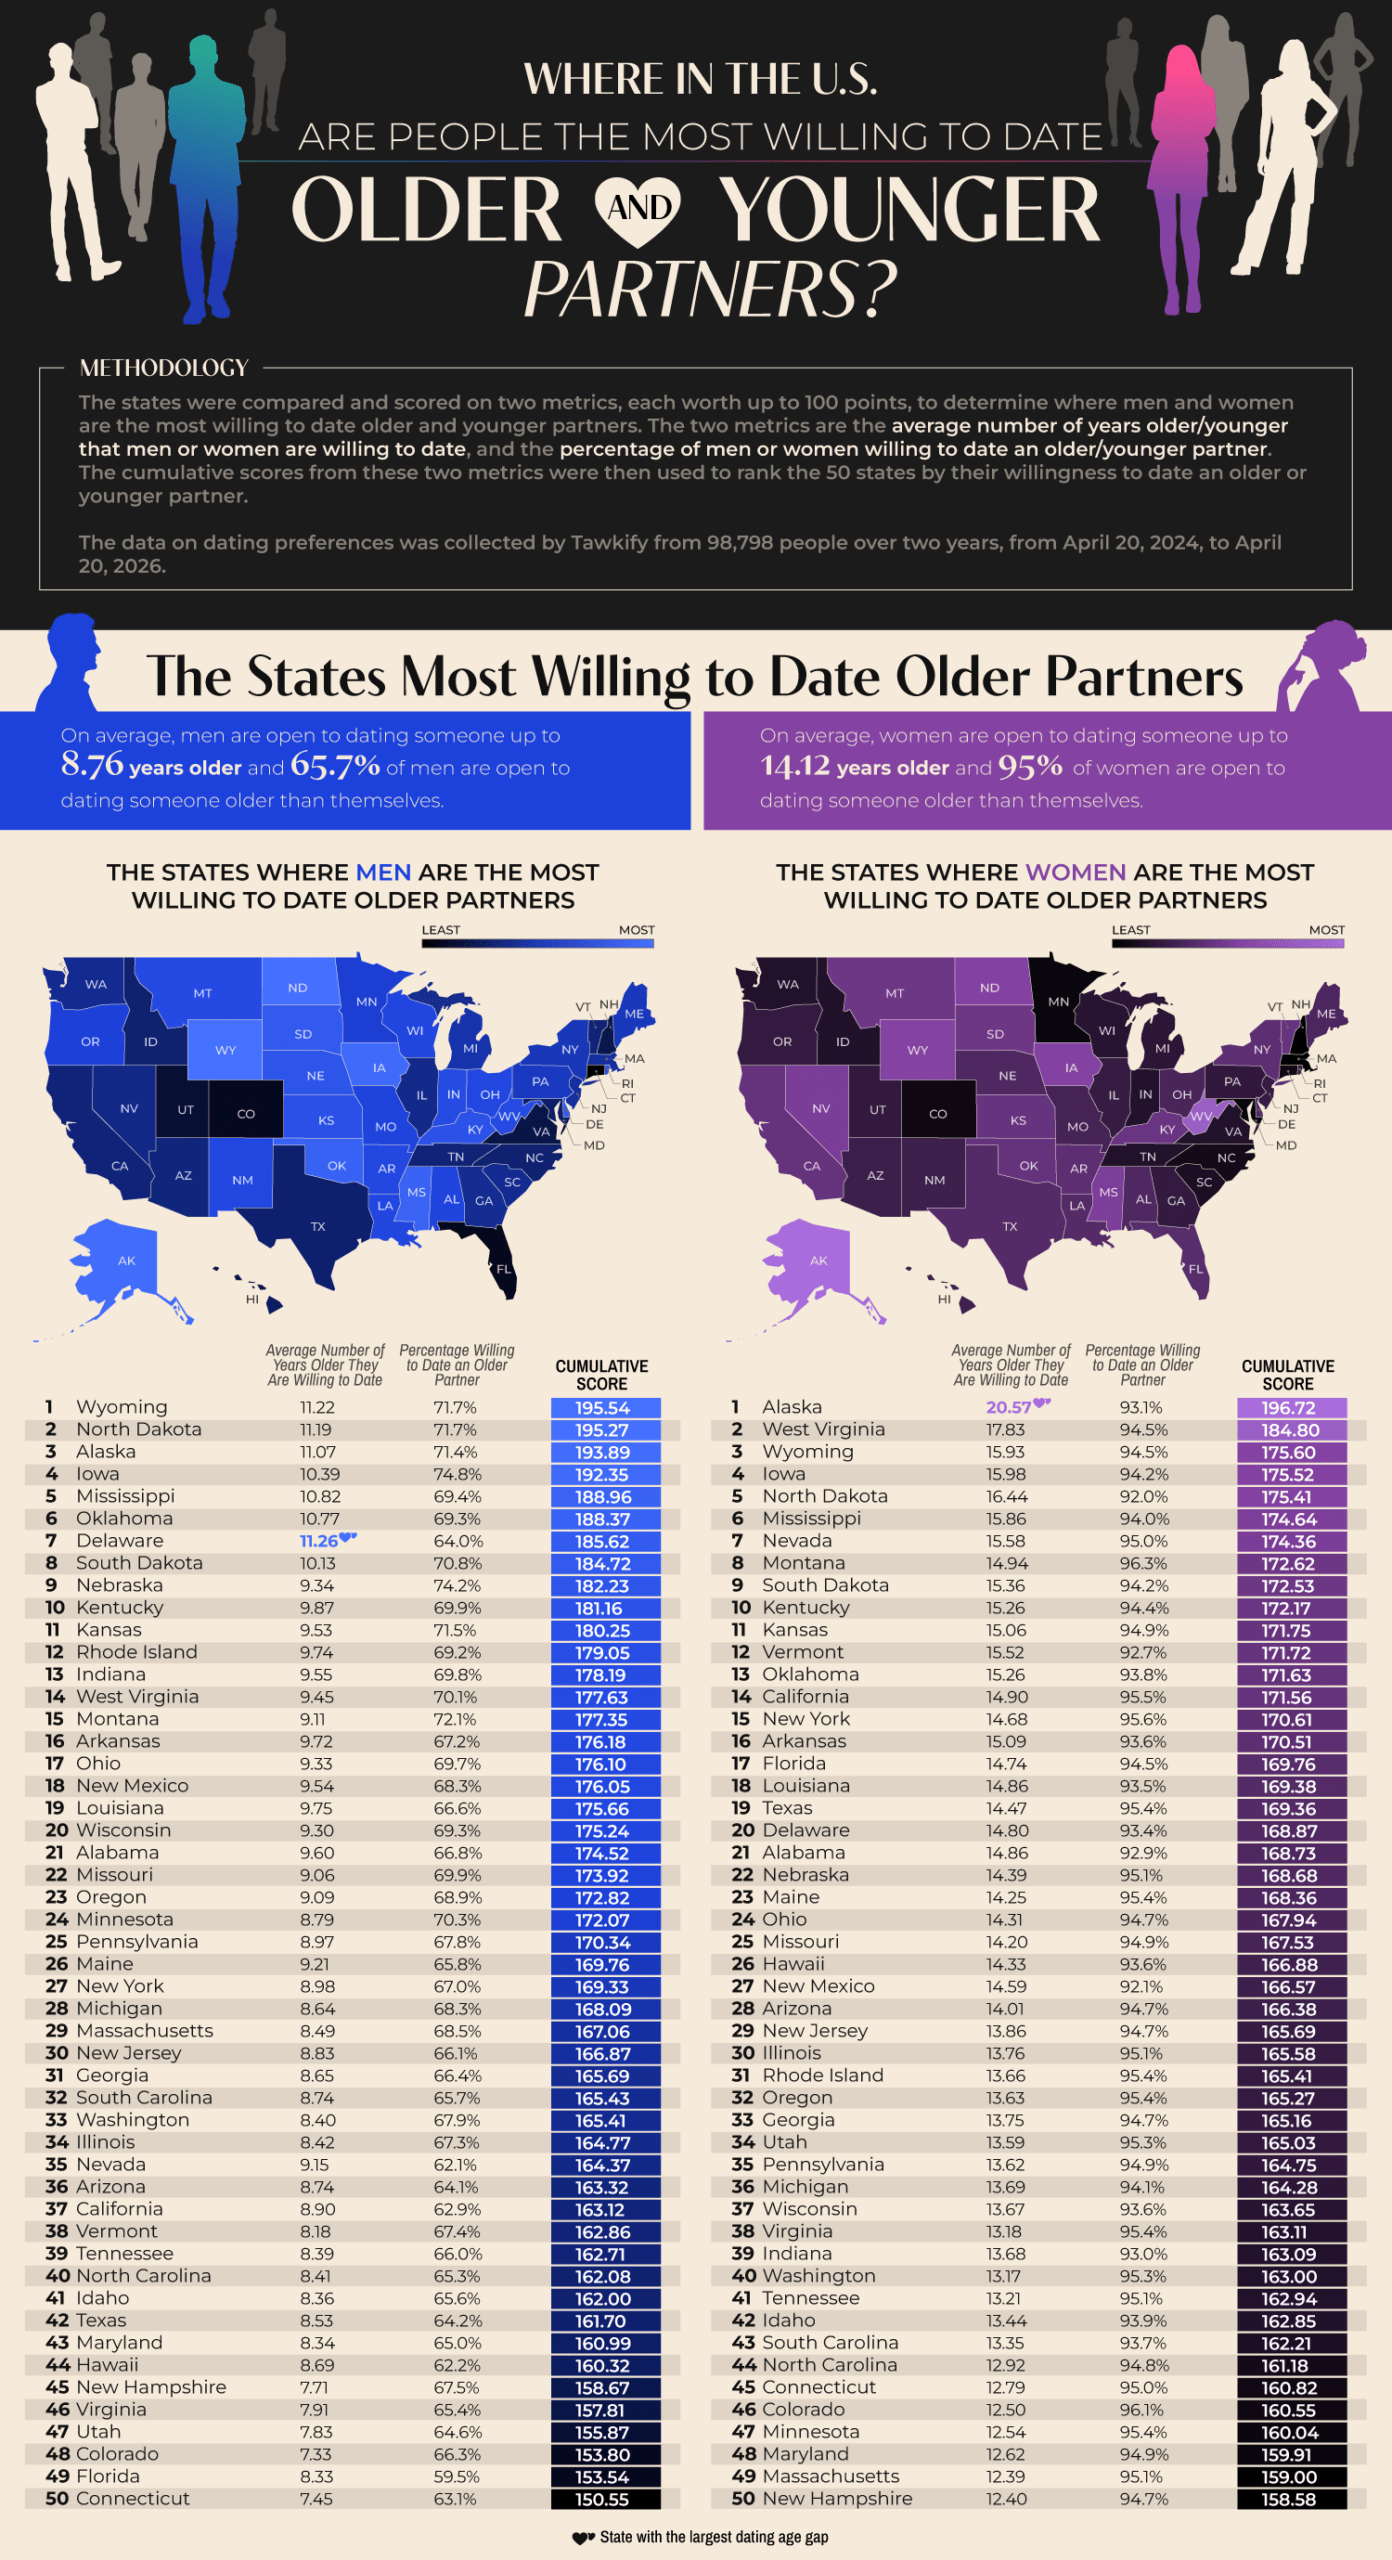
Wyoming tops the list of states with men willing to date outside their age range. 71.1% of Wyoming singles are willing to date an average of 11.22 years older than they are. North Dakota and Alaska also appeared in the top three. Delaware emerged as an interesting outlier. They have the largest average age gap in dating among men, at 11.26 years. 93.1% of Alaskan women are open to dating older partners, and they have the nation’s largest age gap by far at 20.57 years. West Virginia and Wyoming women follow in second and third. It seems that less-populated states show greater willingness to date outside their age range, which could be a very simple explanation. A smaller dating pool means singles widening their options.
As for willingness to date younger partners, Hawaii leads for both genders. 96.8% of Hawaiian men are willing to date someone younger, with 18.59 years as an acceptable age gap. This is the widest that appears in the study. 92% of Hawaiian women are open to dating younger, but their average age gap is only 9 years. Hawaii has an older-than-average population, with a median age of 41.5 years, so this limited island dating pool makes dating younger people more common. The runners-up for willingness to date younger were Nevada, Idaho, and Maine.
According to the data, women are dramatically more open to dating older than men are. 95% of women would date an older partner, compared with 65.7% of men. This pattern flips with dating younger. 96.5% of men would date someone much younger, with a national average age difference of 14.7 years. 88.1% of women would date younger men, but at a much smaller average age gap of 7.14 years. This shows that across the country, men tend to date younger partners, while women tend to date older partners. Women are consistently willing to tolerate a wider gap when dating up.
The team threw us a little fun fact from the Guinness Book of World Records, which lists Gertrude and John Janeway, married in 1927, as the largest spousal age gap of 63 years. Age-gap relationships can succeed but face challenges like judgment and assumptions about power dynamics and differing life stages. Strong communication, shared values, and aligned goals matter most in relationships, more than the number of years lived. Geography and gender seem to shape who Americans date, but the data also suggest that openness to age-gap romances often comes down to opportunity.
A study from the University of Texas at Austin found that during COVID-19 lockdowns, a simple phone call to 240 seniors over four weeks measurably reduced depression rates. Can something as simple as a phone call meaningfully ease senior loneliness? The data that Ooma collected shows that a phone call can mean the world to a senior. It’s a simple act with outsized mental and physical health benefits for older adults.
Click below to zoom.
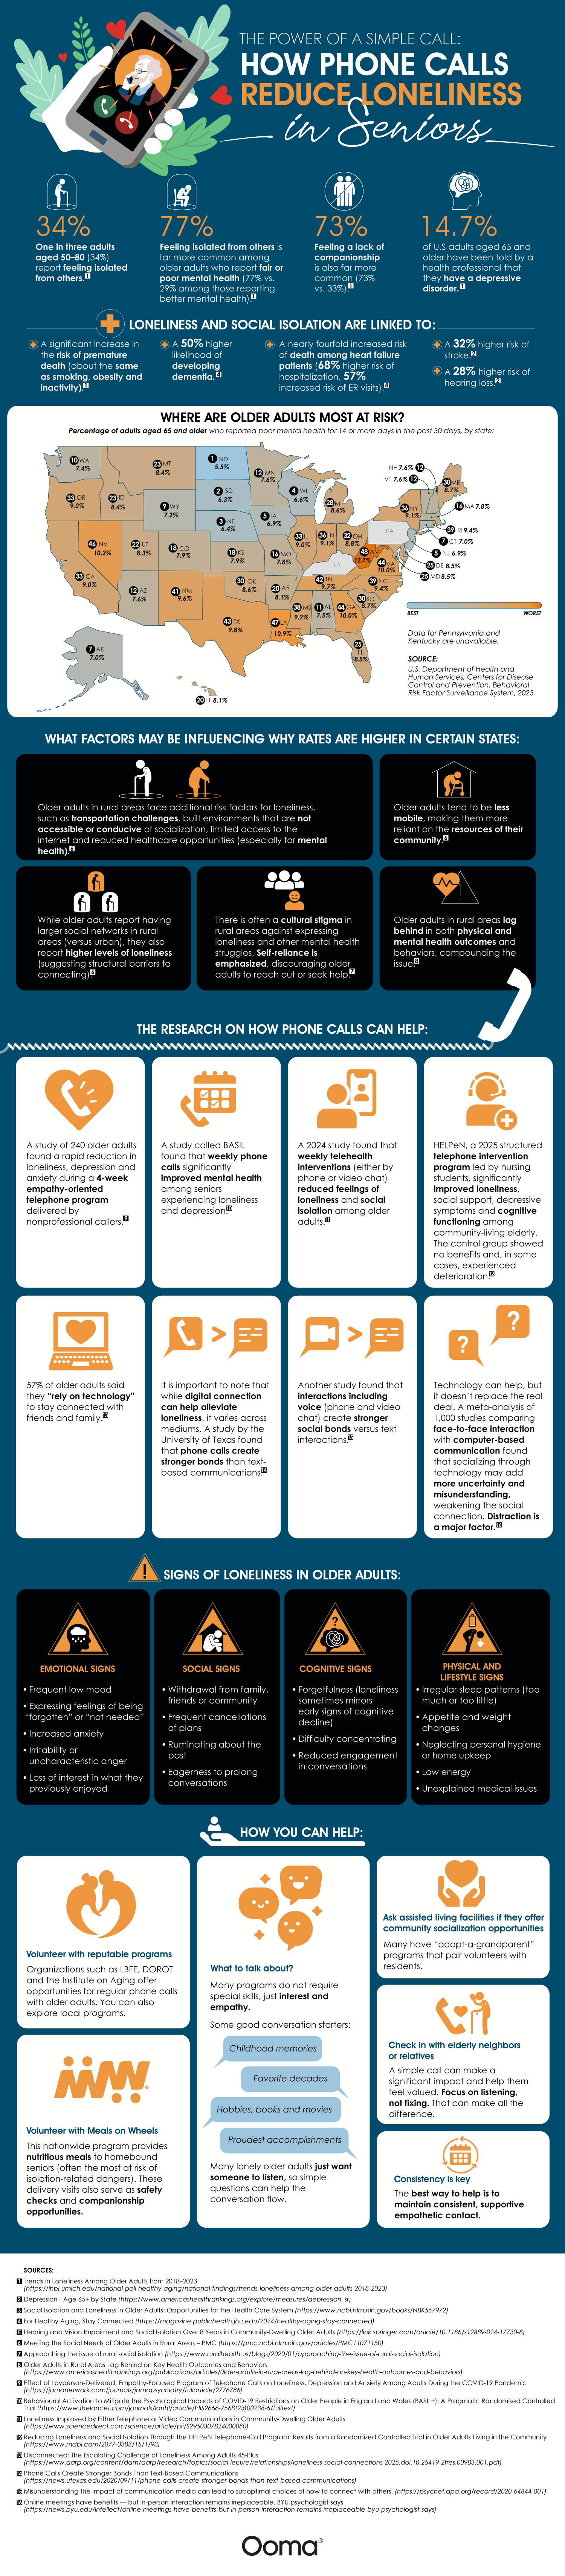
The team created a helpful map that also highlights key findings from their study. Here are a few of the most important figures:
- 1 in 3 adults aged 50 to 80 (34%) report feeling isolated.
- 77% of seniors with poor mental health report feeling isolated compared to only 29% of seniors with better mental health.
- 7% of American adults over 65 have been diagnosed with a depressive disorder.
- The map shows a wide variation in seniors reporting 14 or more poor mental health days, with a range of 5.5% among North Dakota seniors to 12.7% of West Virginia seniors.
Their data also shows that isolation is a health crisis, more dangerous than a simple mood problem. When people feel isolated, their mortality risk is comparable to that of people who are obese, inactive, or who smoke regularly. Isolated seniors have a 50% higher risk of dementia. There are nearly quadruple the death risk odds for heart failure patients who are isolated, and a 68% higher hospitalization risk. Isolated seniors are also at a 32% higher stroke risk and a 28% higher hearing loss risk. Rural seniors are the most vulnerable due to limited Internet access, transportation barriers, and a cultural stigma around expressing loneliness.
The dangers of loneliness are clear, and luckily, there are clear solutions. UT Austin’s empathetic phone call program created rapid drops in depression, anxiety, and loneliness. Weekly phone calls could improve mental health and even cognitive functioning. A 2024 telehealth study showed that both phone and video calls can have these effects.
The Ooma team also provided helpful tips that can help people spot signs of loneliness in their loved ones. If their social behavior changes, that’s a warning. This could look like withdrawal, dwelling on the past, canceled planes, and drawn-out conversations. Cognitive issues are another major red flag, like forgetfulness, trouble concentrating, and less engagement. If a senior’s sleep or appetite changes, they have persistently low energy, neglect their hygiene, or develop an unexplained ailment, this could also signal loneliness.
If you want to help fight the senior loneliness crisis, you could volunteer with the Institute on Aging’s Friendship Line, LBFE, or DOROT. Local assisted living communities might have an adopt-a-grandparent program. Volunteering for Meals on Wheels not only provides seniors with food but also offers a chance to socialize and conduct safety checks. If you are short on time, simply pick up the phone and call an elderly neighbor or relative. This study makes it clear that it’s a powerful act of kindness.
AI is embedded in workplaces worldwide by this point, and yet workers’ feelings about it vary dramatically. A study by Qualtrics examined how geography was related to feelings about AI in the workplace. They found that only 37% of workers globally believed that AI would improve their jobs. That average hides a 45-point difference between the most optimistic country, which is China, and the most skeptical, Japan.
Click here to zoom.
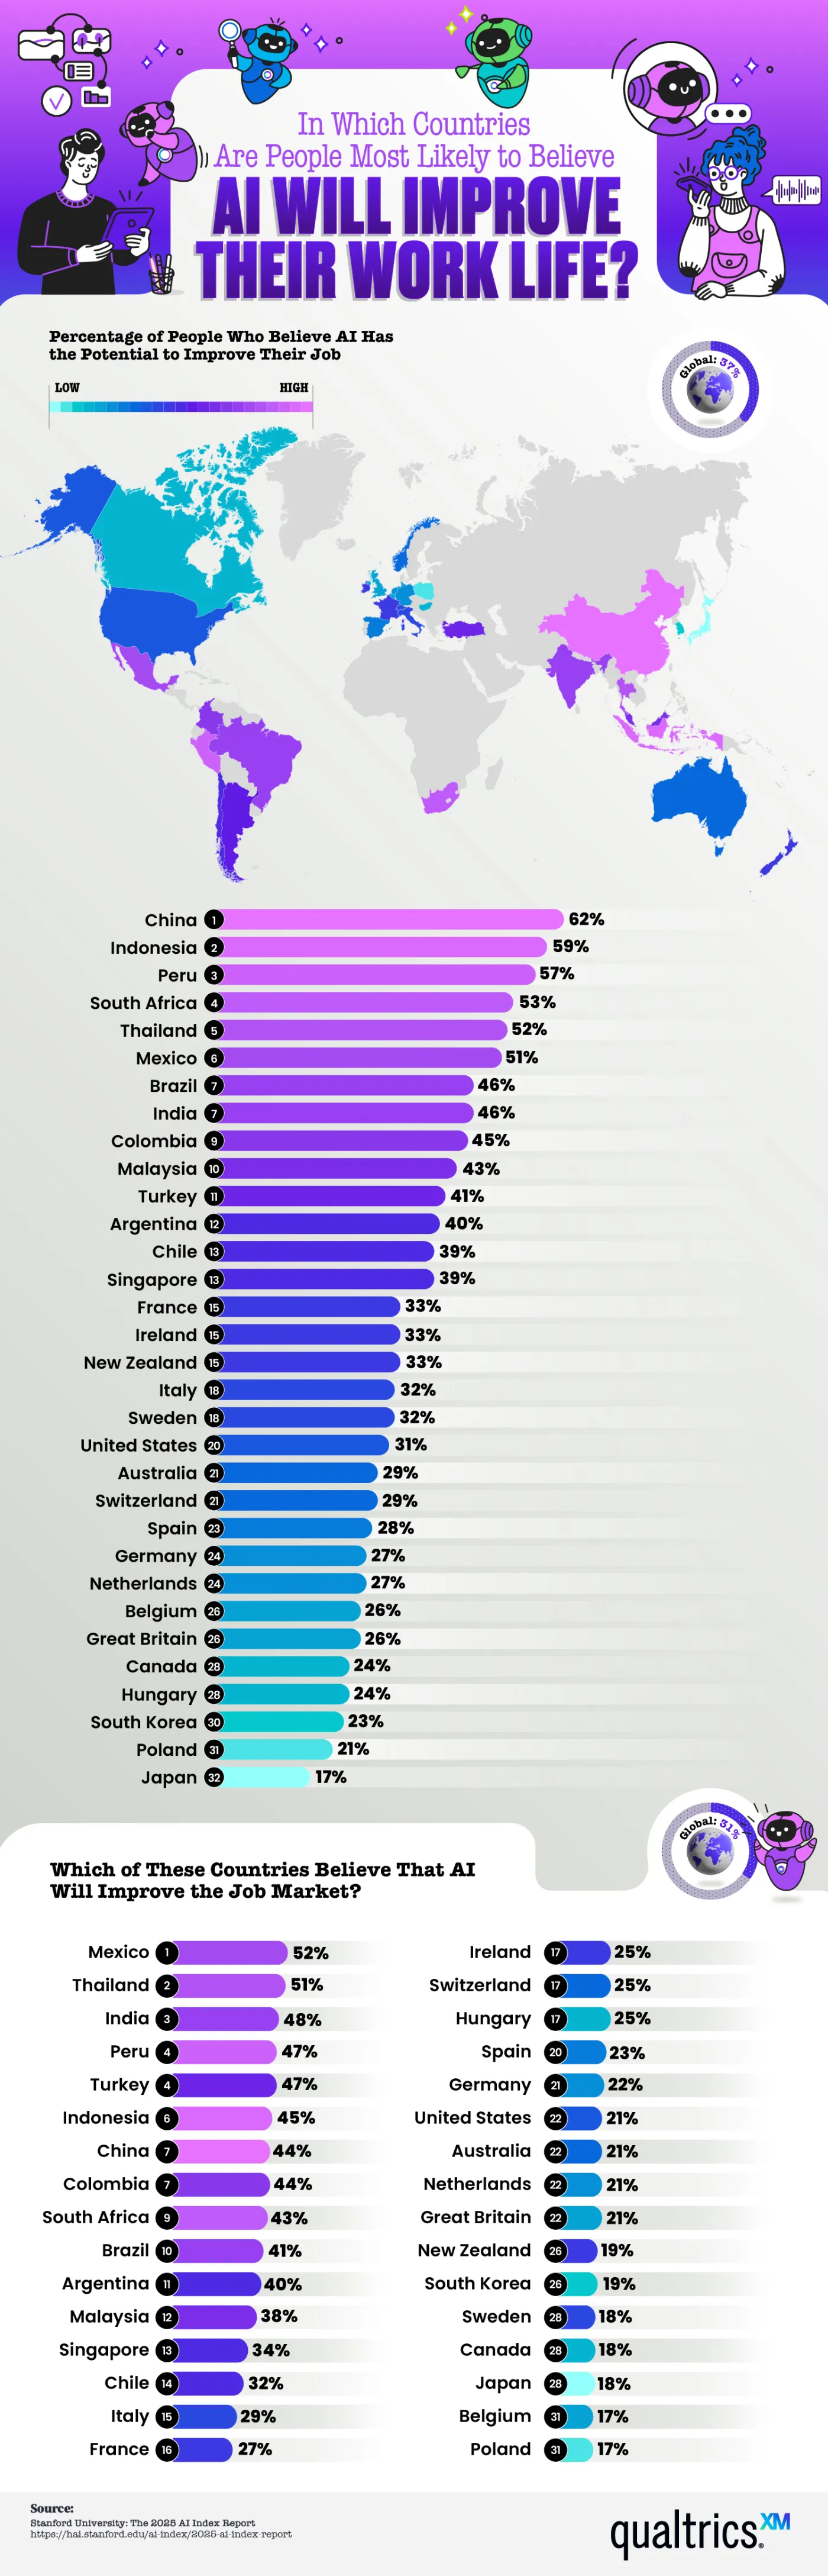
Nearly 80% of global companies report using AI in some capacity, and research indicates productivity gains, with lower-skilled workers benefiting the most. Even if this is the case, employee sentiment isn’t nearly as unified. The numbers the team shows here indicate a healthy level of AI skepticism. In fact, more than half of workers think AI will improve their lives in just 6 out of 32 countries studied. That means there are more skeptics than people excited about what AI will bring to the workplace. But why does optimism cluster in some regions while most remain skeptical?
Here are a few of the countries where optimism runs high:
- China – 62% of workers are optimistic
- Indonesia – 59%
- Peru – 57%
- South Africa – 53%
- Thailand – 52%
There is a mid-tier region with fewer optimistic workers, but still a healthy percentage. This includes Mexico, Brazil, India, Colombia, and Malaysia. Many of these countries have developing economies or a heavy state investment in AI infrastructure, as is the case in China. Workers in these places view AI as a tool to close skill gaps, raise wages, and improve living standards. These regional differences are easy to spot thanks to the map Qualtrics created, which color codes the level of optimism/skepticism.
At the other end of the spectrum, we find the highest number of skeptics in Western Europe and English-speaking countries. Here are the countries with the least faith in AI:
- United States – 31% of workers are optimistic
- Australia – 29%
- Great Britain – 26%
- Canada – 24%
- Japan – 17%
- Poland – 21%
The media narratives in these countries frame AI as a risk of automation-driven job loss, which shapes people’s perceptions even when AI adoption in their workplaces is the same as in optimistic locations. These nations are the same that rank lowest on the belief that AI will improve the job market.
Economic research suggests that AI tends to reshuffle tasks within a role rather than eliminate that job outright. New skills will be required to work with AI, and some positions will shift, but historically, new digital tools have created more roles than they’ve erased. The gap between the hard data and public sentiment in skeptical countries is definitely worth examining and tells a story.
As AI rolls out unevenly across the world’s workforce, it’s important for employers to understand where their employees actually stand on the issue. Beyond regional stereotypes or headline-driven assumptions, employers must look at facts like the data presented here to make thoughtful AI adoption decisions.
-

 Business Visualizations2 years ago
Everything Owned by Apple
-

 Business Visualizations2 years ago
America’s Most Valuable Companies Ranked by Profit per Employee
-

 Business Visualizations1 year ago
The Biggest Fortune 500 Company in Every State
-

 Business Visualizations1 year ago
The Biggest Employers by Industry
-

 Timelines2 years ago
Timeline Charts the Development of Communications Technology
-

 Business Visualizations8 months ago
The Largest Companies in America That Are Still Run by the Person Who Founded Them
-

 Charts2 years ago
Map Uncovers Countries with Most Powerful Passports
-

 Maps2 years ago
A Map to Gold and Silver