
Charts
Seven Layers of Vacation Rental Safety

Vacation rentals have opened up a whole new way to travel for people all over the world. Through platforms like Vrbo and Airbnb, travelers rent lofts, apartments, cottages, and ski chalets instead of a traditional hotel room. These options are very popular and can become a booming business for property owners. However, they come with their own set of risks to deal with. Property owners can take a well-rounded approach to guest and property safety by using Ooma’s pyramid chart, which displays the layers of vacation rental safety. They list the most important protections first and finish with insurance protection to top it all off.
Click below to zoom.
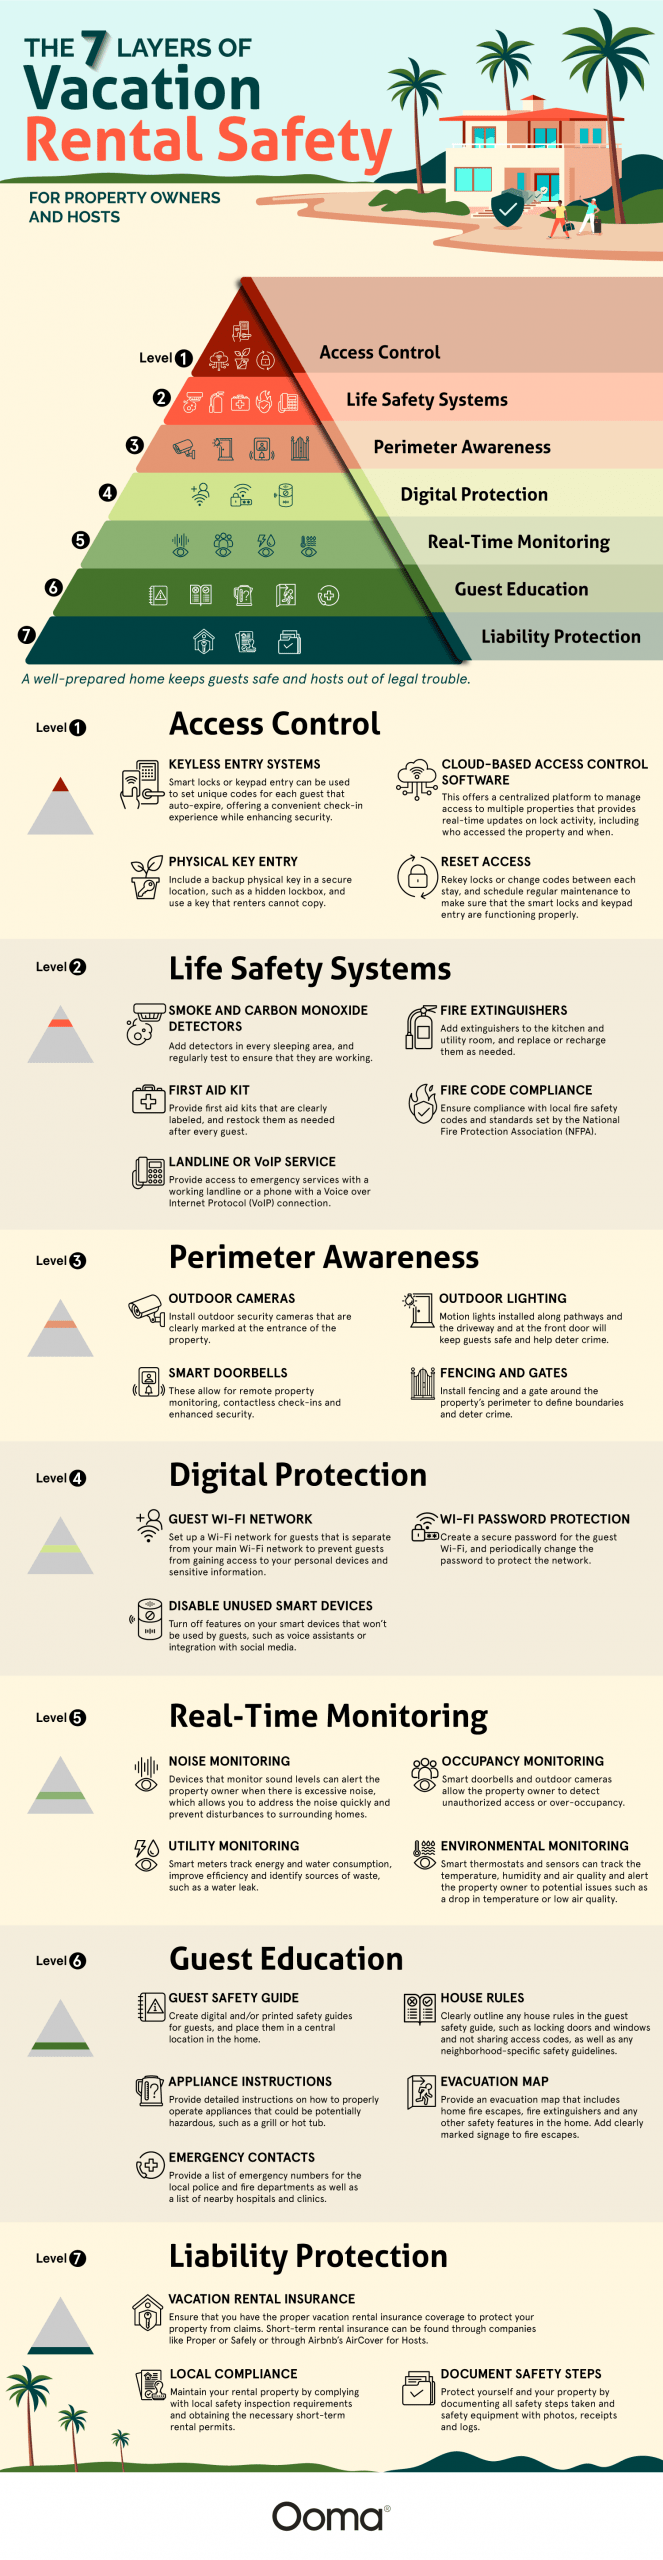
Here are the seven layers of safety according to Ooma:
- Access Control
- Life Safety Systems
- Perimeter Awareness
- Digital Protection
- Real-Time Monitoring
- Guest Education
- Liability Protection
Each layer comes with specific suggestions to implement safety precautions. Here’s the full list for property owners to check off:
- Keyless entry system, cloud-based access control software, physical key hidden away, reset lock access
- Smoke and carbon monoxide detectors, first aid kit, landline or VoIP service, fire code compliance, fire extinguishers
- Outdoor cameras, outdoor lighting, smart doorbells, fencing, and gates
- Secure Wi-Fi networks specific to guests, Wi-Fi password protection, and turn off unused smart devices
- Noise monitoring, occupancy monitoring, utility monitoring, environmental monitoring
- Guest safety guide, house rules, appliance instructions, emergency contacts, evacuation map
- Vacation rental insurance, local compliance, document safety steps
Short-term rentals come with some unique risks that owners must account for. Property damage is common when inviting strangers to stay in your home. These can be mild accidents, like stains from spills, or major issues, like appliance and utility malfunctions and damage. If guests are injured, owners are liable and must be covered by insurance. Wi-Fi networks can leave guests vulnerable to identity theft, so they must be properly secured. Guests should be aware of house rules, but may abuse them anyway, so activities like noise and occupancy levels should be monitored. Rental homes might be vulnerable to theft and squatters, too.
The team offers additional tips for each layer of safety. They suggest providing easy-to-find first aid kits for guests, following all fire code compliance, setting up outdoor cameras and motion-activated lighting, smart doorbells, turning off unused smart devices, creating a guest rule book, posting an evacuation map and emergency contacts, and documenting each step you’ve taken to provide a safe guest experience.
On top of all this, vacation rental owners need to make sure they keep up on cleanliness and safety inspections. Guests should also be aware of hazards that could cause a slip and fall accident and make sure they’ve taken due diligence in securing their property. All of these steps can help property owners run a successful vacation rental business while keeping guests safe and the property in peak condition. All vacation rental owners can learn something from the team’s layered approach to vacation rental safety.
Moving into a first apartment is a rite of passage, but the math behind making it a reality is becoming a bigger obstacle. The metros with the strongest job markets also have the steepest living costs, and over the past few years, rent in these areas has climbed faster than paychecks. Cheap rent isn’t the only solution, though. Thin wages and flat hiring shut young people out of many cities.
Rove Lab’s new analysis identifies the cities in the middle ground with the most to offer young people establishing their lives. The study examined the 100 most populous U.S. metro areas and scored each one on 10 different metrics grouped into three weighted categories.
Click below to zoom.
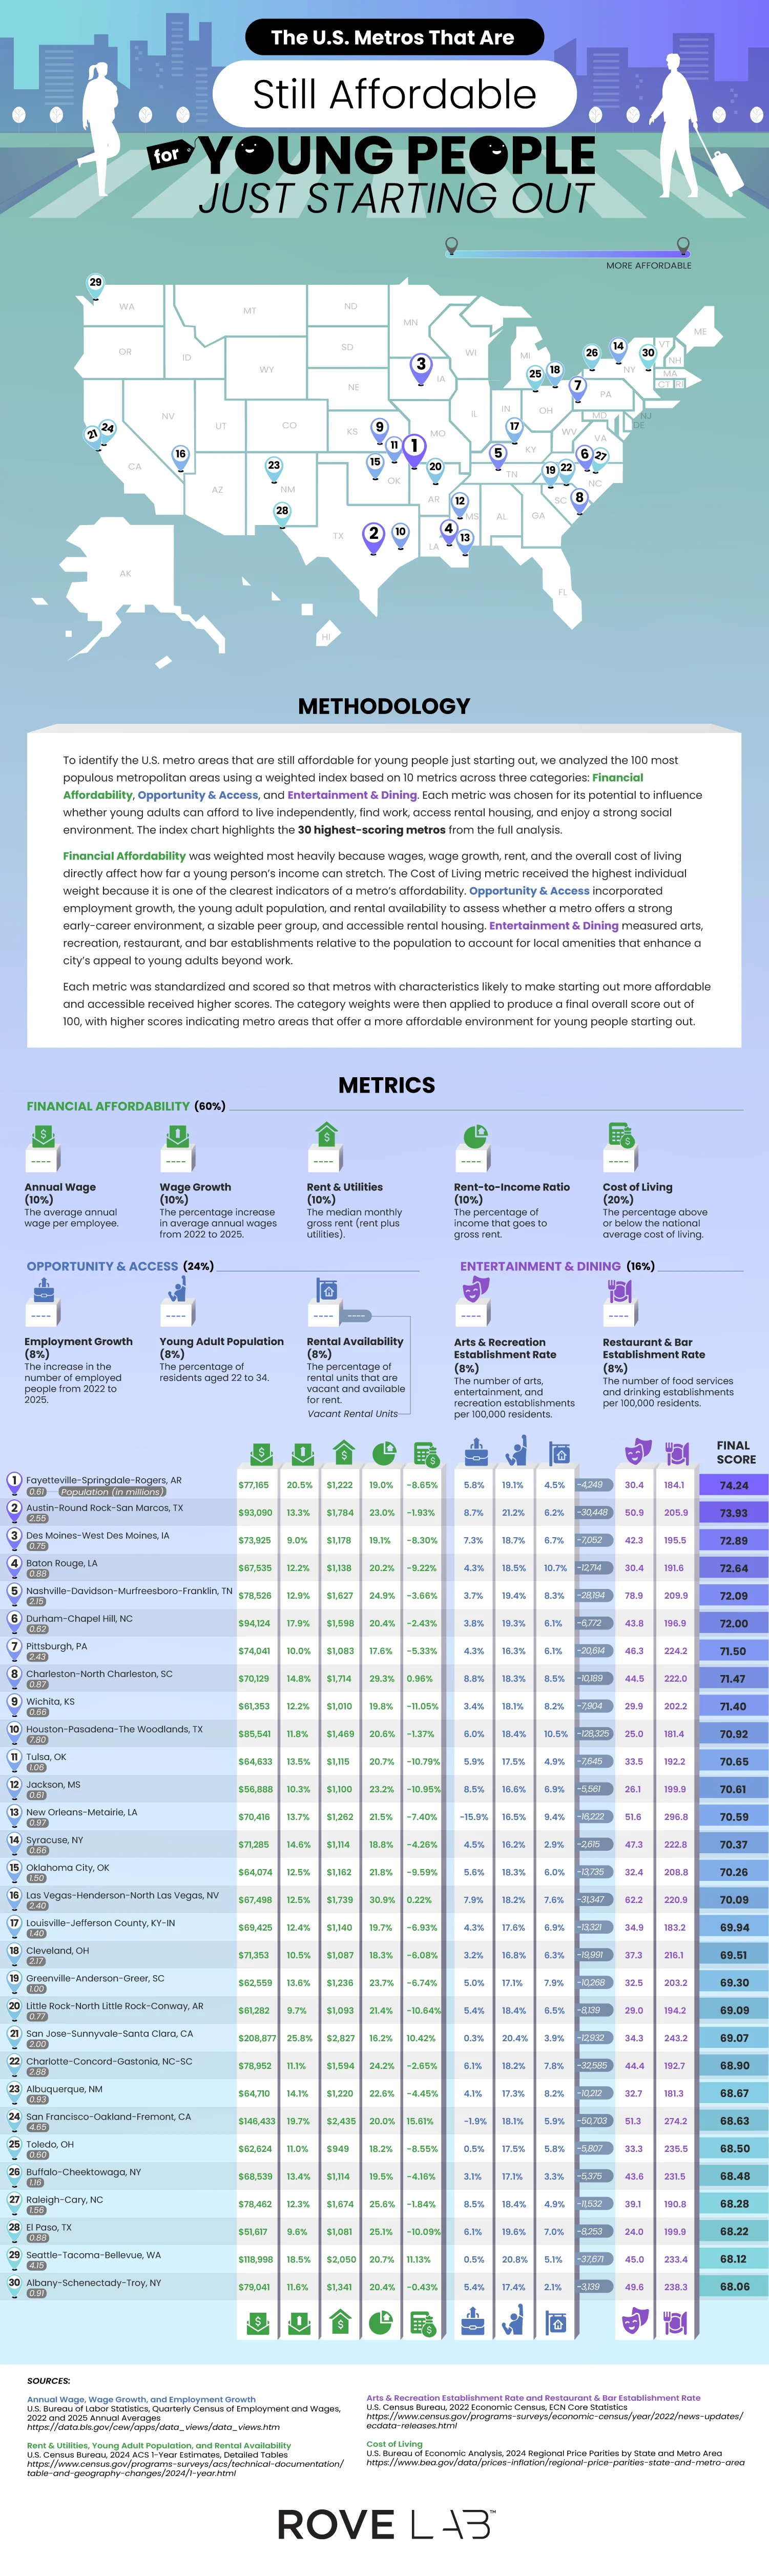
Financial affordability was the most important category, carrying 60% of the weight. This category covers average annual wage, wage growth, median rent and utility costs, rent-to-income ratio, and cost of living relative to the national average. Cost of living alone received 20% of the weight, the heaviest single metric in the study. Opportunity and access accounted for 24% and included employment growth, number of residents between 22 and 34, and amount of rental vacancy. The final 16% went to entertainment and dining, tracking the number of arts and recreation venues and restaurants and bars per 100,000 residents. Each metric was standardized, scored, and weighted into a final number out of 100.
The winning city was Fayetteville-Springdale-Rogers, Arkansas, with a score of 74.24. This isn’t an obvious winner until you look at the numbers. Wages increased by 20.5% from 2022 to 2025, with the average wage at $77,165 and a cost of living that’s 8.65% below the national average. This combination creates a rent-to-income ratio of 19%, leaving young people with money to save, potentially for the elusive dream of homeownership. Fortune 500 companies, Walmart, J.B. Hunt, and Tyson, have a home in the area and likely explain wage strength.
Austin-Round Rock-San Marcos followed with a 73.93 score, driven by a thriving tech sector that’s seen 8.7% employment growth, and the area offers 30,000 vacant rental units for newcomers. Des Moines, Baton Rouge, and Nashville round out the top five.
A few cities earned high rankings thanks to low housing costs. Pittsburgh was seventh overall with a rent-to-income ratio of 17.6%. Wichita, ranked ninth, has low rent and utilities and a low cost of living that’s 11.05% below average. Toledo, number 25 on the list, has the cheapest housing of all cities on the list, with an average of $949 a month.
The most surprising cities on the list are Californian. San Jose-Sunnyvale-Santa Clara ranks 21st, and San Francisco-Oakland-Fremont lands 24th, despite costs of living well above the national average. Salaries do the heavy lifting, averaging $208,877 and $146,433, respectively. This pulls down San Jose’s rent-to-income ratio to 16.2%, the lowest on the list.
Student Choice has published the 2026 updated version of its study, ranking the most popular college degrees by return on investment after five years in the workforce. The team’s premise is timely as they examine a hot topic: the cost of higher education. The average cost of college now exceeds $43,000 per year, so entering the workforce with these student loans became a high-stakes game. The analysis pairs the top 25 majors in 2026, based on a previous Student Choice study, with earnings data from the U.S. Bureau of Labor Statistics to calculate how much a graduate earns in their first five years relative to their four-year tuition investment. They illustrated their findings by ranking 20 degree types compared to 40 common occupations.
Click below to zoom.
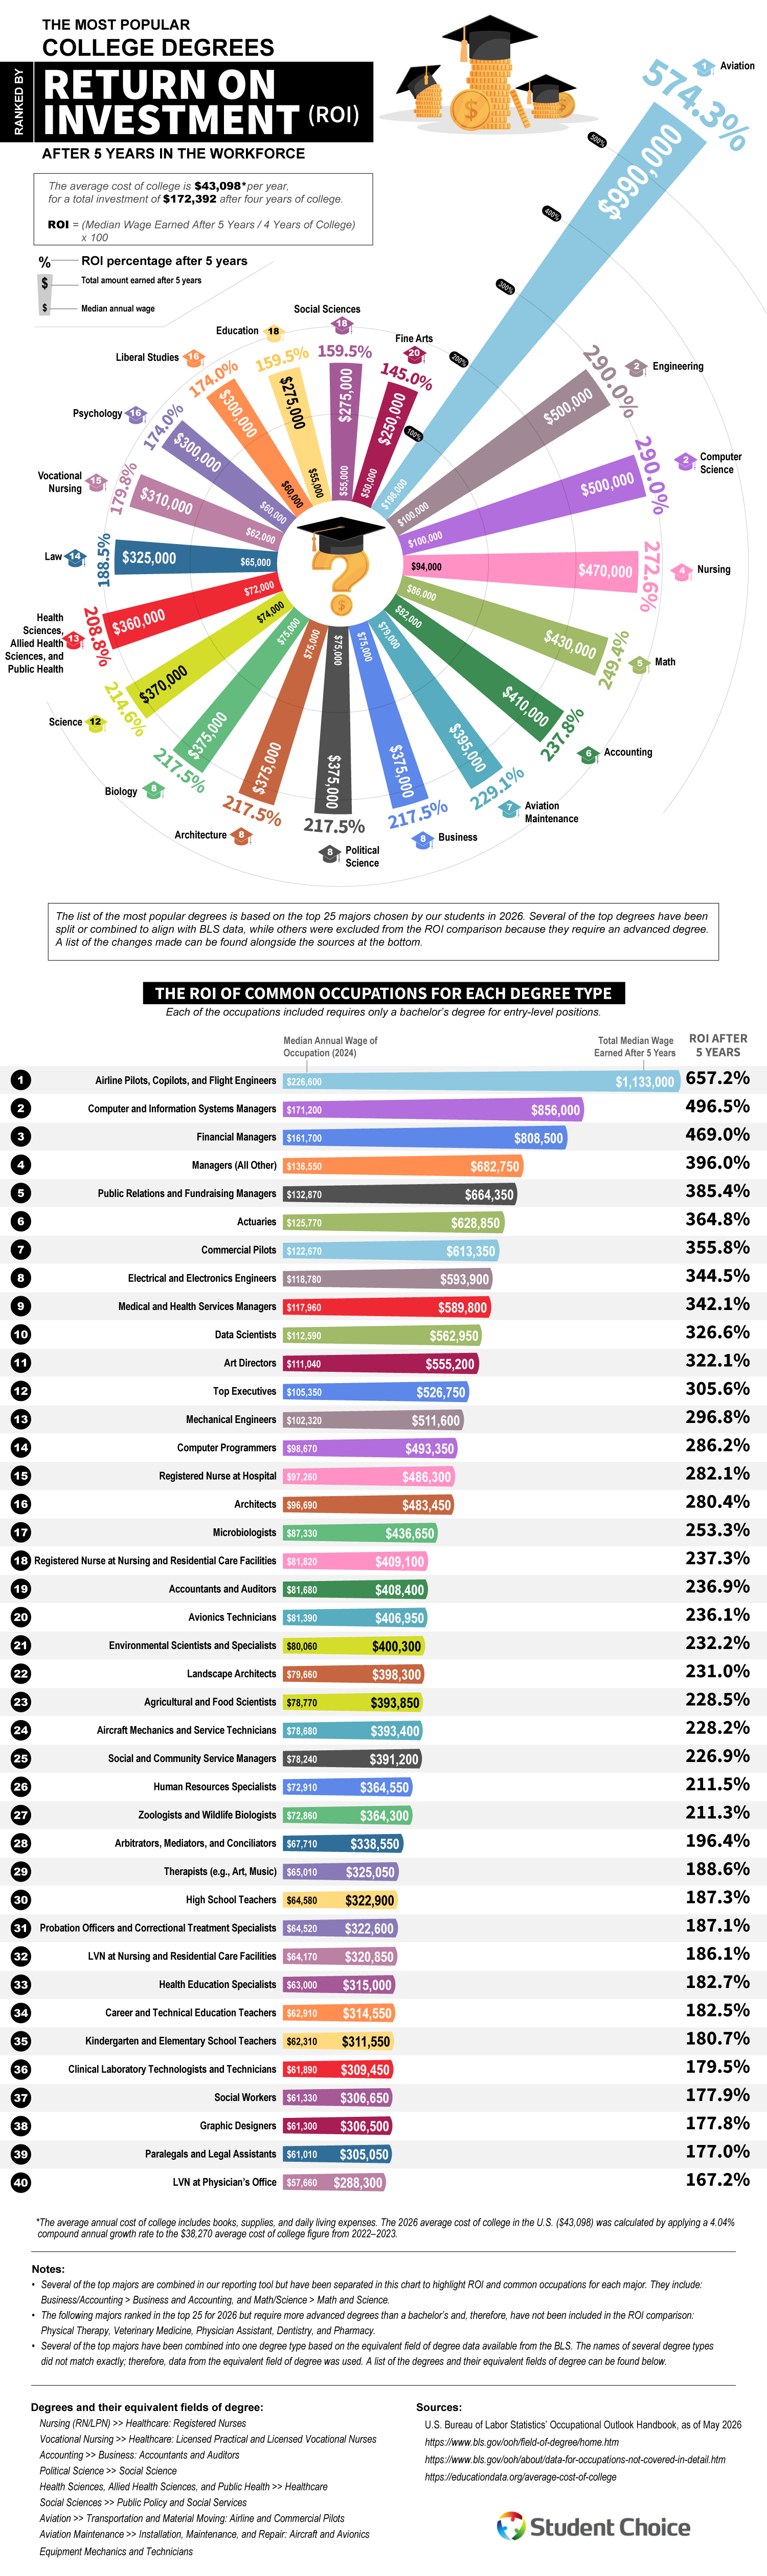
The team used a simple methodology. The average cost of college is $43,098 per year for a total investment of $172,392 for four years, with ROI calculated as median wages earned over five years divided by the four-year college cost. Majors that require advanced degrees like physical therapy, veterinary medicine, physician assistant, dentistry, and pharmacy were excluded from the ROI comparison even though these majors rank in the top 25.
Aviation tops the rankings chart, claiming the leading spot by a wide margin because of its astounding 574.3% ROI after five years, boosted by the median annual wage of $198,000. The field’s popularity is likely due to high pay and a looming pilot shortage as veteran airline workers retire. Engineering and computer science tied for second place at 290% each with median wages of $100,000 a year.
Healthcare and quantitative fields round out the upper tier. Nursing ranks fourth with an ROI of 272.6%, followed by math at 249.4% and accounting at 237.8%. Business, political science, architecture, and biology all tie for eighth at 217.5%, based on a $75,000 median wage. Education and social sciences sit near the bottom of the list at 159.5%, and fine arts at the bottom at 145%.
The study’s most helpful section might be the table that shows how career choice within a major can dramatically outperform the degree’s baseline. Aviation graduates who became airline pilots, copilots, or flight engineers reached a 652.7% return on a median wage of $226,600. Computer and information systems managers hit 496.5%, financial managers reached 469%, and public relations and fundraising managers reached 385.4%. Even lower-ranked majors can have exceptions. For example, fine arts majors who become art directors have a 322.1% return with a median salary of $111,040. Math majors working as actuaries earn 364.8%.
Overall, though, this study shows us that getting a degree pays off. Even accounting for student debt, the data suggests that degrees can double or triple the initial investment within five years. While most people will work for about four decades after student life, the returns will continue to compound. There is a growing preference for specialized, career-focused degrees with clear pathways into established professions so students can enjoy the ROIs we see here.
The invisible digital infrastructure is all around us. It powers every bank login, online order, every text sent, and every social media update posted. Vast networks that many of us rarely think about make these actions possible. Access to the digital infrastructure shapes a population’s economic standing and it even keeps entire governments running smoothly. Therefore, it’s no surprise that some countries spend huge sums to stay competitive in the digital infrastructure sector and there are clear winners as we can see in Ooma’s new study.
Click below to zoom.
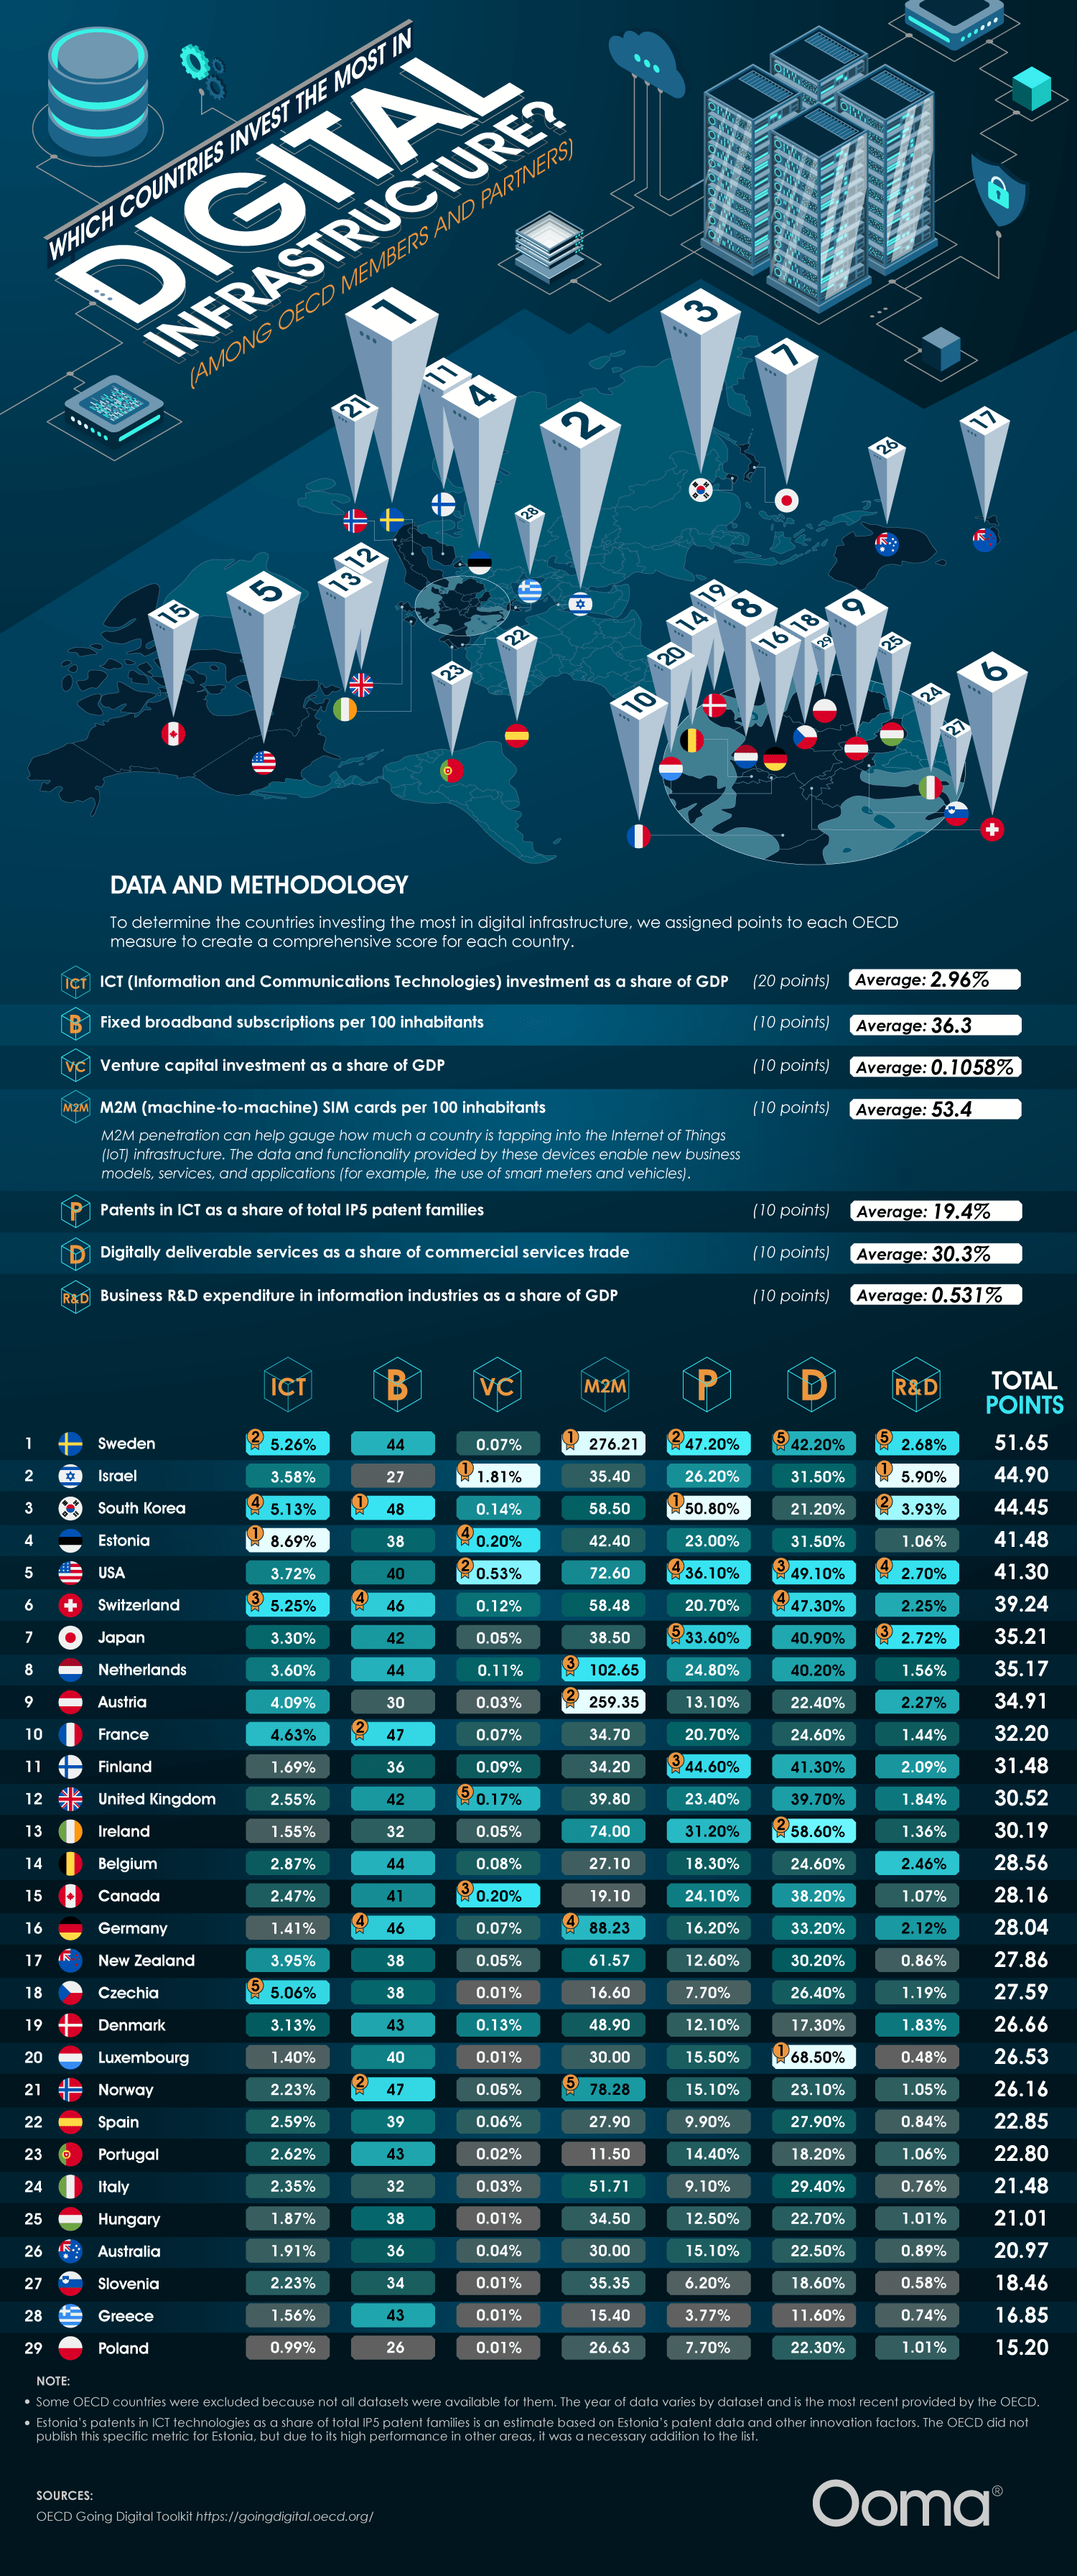
Think of this way: rather than roads and bridges, broadband networks, data centers, and cloud systems, the key to mobile connectivity is a country’s most valuable asset, which powers AI servers and social media. Advanced digital infrastructure correlates with higher GDP growth, higher productivity, a viable remote workforce, and a more digitally skilled workforce. These systems also allow faster access to government services, which can even be lifesaving since they offer quicker communication during emergencies like natural disasters.
The team’s study found 5 countries leading this digital infrastructure race. Sweden is in first place now with strong assets across the board, led by broadband subscriptions and business R&D spending. Israel is in second place with outsized venture capital relative to their GDP and heavy research funding into digital infrastructure. South Korea is in third, powered by ICT patents and top-tier broadband reach. Believe it or not, Estonia edges out the U.S. in fourth place. They’re a global digital pioneer with the most ICT investment as a share of GDP. The U.S. ranks #5, driven by digitally deliverable services and venture capital. The team used a points-based score across seven OECD measures, which include ICT investment, broadband, venture capital investment, M2M SIM cards, ICT patents, digital services trade, and business R&D.
These investments have a number of real-world impacts. In Estonia, they have nearly all their government services available online and a digital ID that can be used for everything from remote voting to public transport. Sweden has a highly developed e-commerce sector, universal household Internet connectivity, and, as a result, Stockholm is Europe’s financial hub. In Israel, the National Digital Agency and the Digital Israel initiative weave tech across education, government, and healthcare, transforming the country into a startup magnet. South Korea has one of the fastest Internet speeds globally and they dominate consumer electronics, competitive gaming, and semiconductors.
Countries investing in digital infrastructure are positioned to be world superpowers. Businesses in these countries benefit from fast communication and a digitally literate workforce. But seamless connectivity shouldn’t depend on geography. Every country and all people can benefit from a more digitally connected world, so the more countries that improve their digital infrastructure, the better. The leading countries on this chart can serve as role models while countries further down the list highlight areas for improvement and potential investment.
-
 Business Visualizations2 years ago
Everything Owned by Apple
-
 Business Visualizations2 years ago
America’s Most Valuable Companies Ranked by Profit per Employee
-

 Business Visualizations2 years ago
The Biggest Fortune 500 Company in Every State
-
 Business Visualizations1 year ago
The Biggest Employers by Industry
-
 Charts2 years ago
Map Uncovers Countries with Most Powerful Passports
-
 Business Visualizations12 months ago
The Largest Companies in America That Are Still Run by the Person Who Founded Them
-
 Timelines2 years ago
Timeline Charts the Development of Communications Technology
-

 Timelines2 years ago
The Evolution of Baby Names: A Century of Trends