Business Visualizations
Popular Chip Brands Ranked by the Percentage of Air in Their Bags
When shopping, there’s actually quite a bit of misleading packaging out there that you need to be careful of. When it comes to snacks, you’ve surely noticed that when you open the bag or canister of tasty chips, the packages aren’t always exactly full.
Here’s a look at several popular brands of potato chips, and how much “air” is typically in each package. The reason for this is a process called “slack fill,” which some even think makes the snacks have a better taste. By allowing this space in the packaging, the package is better protected from damage during transit, according to manufacturers.
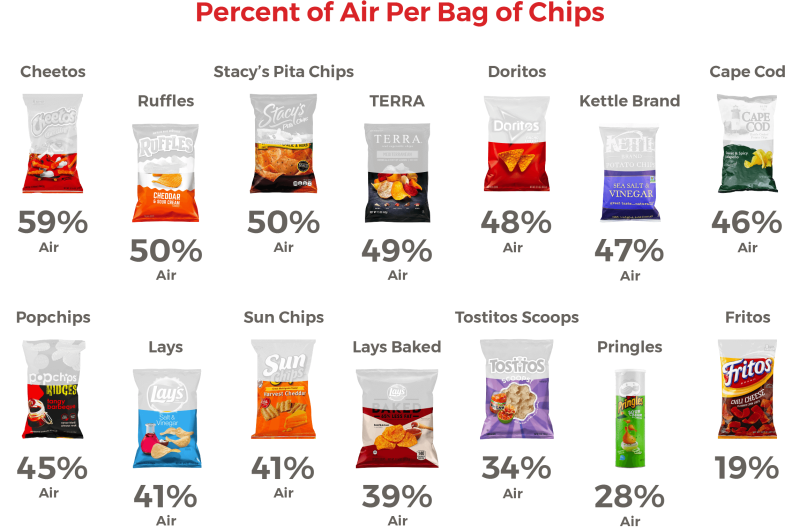
Based on this, a bag of Cheetos has the most air at 59%. The lowest shown here would be Fritos at 19%.
This pictorial fraction chart visualization was created by Reddit user /u/doughilarious and was originally shared in the /r/DataisBeautiful Subreddit.
Click below to zoom
Here’s how they break down as far as air in the bag goes:
- Cheetos: 59% air
- Ruffles: 50% air
- Stacy’s Pita Chips: 50% air
- TERRA: 49% air
- Doritos: 48% air
- Kettle Brand: 47% air
- Cape Cod: 46% air
- Popchips: 45% air
- Lays: 41% air
- Sun Chips: 41% air
- Lays Baked: 39% air
- Tostitos Scoops: 34% air
- Pringles: 28% air
- Fritos: 19% air
By putting this extra space in the bag, chips are given a longer shelf life, moisture is kept away, and it keeps the chips whole. Keeping the moisture away is incredibly important, because it allows the snacks to stay nice and tasty until you’re ready to eat them.
The prices on these different brands can vary as well, so where are you really getting the best bang for your buck when it comes to potato chips? What do you think?
Business Visualizations
Ranking States by Workplace Cleanliness
The team at Stratus Building Solutions reveals which states have the cleanest and dirtiest workplaces in a new study. Cleanliness is often an overlooked but powerful influence on workers’ health, happiness, and productivity. People who work in an office spend many hours there and have a right to a clean, safe space to work, whether that’s at their desk, in the breakroom, or in the bathroom. The team’s study reveals that cleanliness depends on more than company policy and culture. It’s impacted by resources and state laws. While some states mandate rules that boost workers’ health and safety, other locations lack such protections and put workers at risk.
Click below to zoom.
The team created a scoring system based on some key criteria. First was the number of OSHA violations. OSHA is the Occupational Safety and Health Administration, which sets federal workplace safety standards, including sanitation standards. A state with a high number of OSHA sanitation violations is a clear sign of dirty workplaces. These violations could include unclean restrooms, inadequate waste disposal, or the presence of mold and bacteria. The team also examined the number of janitors per capita, population density, air pollution, and sick leave laws in each state.
The team found that these states were the cleanest with the highest scores:
- Nebraska
- Colorado
- North Dakota
- South Dakota
- Washington
- Missouri
- Montana
- Idaho
- Michigan
- New Mexico
The top scorers had low rates of OSHA violations, clean air, and high janitor-to-population ratios. State laws mandating sick leave also play a major role, as workers are more likely to stay home rather than bring germs to work.
These were the states that struggled the most with these standards:
- Tennessee
- North Carolina
- Mississippi
- Virginia
- Connecticut
- Oregon
- Nevada
- Rhode Island
- Alabama
- New Jersey
- Pennsylvania
Many of these states are on the dirty end of the spectrum, lacking paid sick leave. Tennessee, Mississippi, and North Carolina do not have laws on paid sick leave, which, when combined with the absence of handwashing stations and disinfecting services, makes the workplace a petri dish for germs. We also see heavily populated states like New York and New Jersey on the low end of the spectrum because more people means a greater challenge to clean up waste and keep germs at bay. High populations also mean bigger cities and more air pollution. We do see, however, that lower population density doesn’t necessarily mean cleaner workplaces, as Vermont was near the bottom of the list and has a small population.
Clean workplaces are healthy workplaces. Dust, germs, and air pollution lead to gastrointestinal and respiratory problems among workers. Simple precautions like regularly disinfecting surfaces, installing handwashing stations, and removing dust can boost the cleanliness of the office and the health of workers. Healthy workers mean better productivity and greater safety for all. Not only will a clean space improve worker experience, but OSHA violations can be very costly. The team’s study provides fascinating insights into what affects workplace cleanliness.
Business Visualizations
New Study Examines Language Used to Let Employees Go
Letting an employee go is an unpleasant experience for everyone involved, but language has the power to guide the emotions surrounding an interaction. While the right words won’t erase the bad side of being let go, they can help the employee in question understand why the situation is happening and make them feel seen and heard. Preply leaned into the language aspects in these situations with a study examining the most common phrases and words used when letting an employee go and how employers and employees felt about the situation.
Click below to zoom.
Overall, the team found that these were the most common phrases used:
- Letting you go
- Effective immediately
- Terminating your employment
- This isn’t working out
- No longer require services
- Parting ways
- Ending your employment
- No longer needed
- Relieved of duties
- Ending our working relationship
Managers and employees seem to agree that lack of empathy and responsibility were the most common complaints about the process. One in six managers say they regret the words they chose when firing someone, and 92% feel they need more training on how to handle such situations. Employees wanted their managers to focus on clarity, compassion, empathy, and honesty when firing an employee.
The team studied changes that both managers and employees would like to see in the firing process.
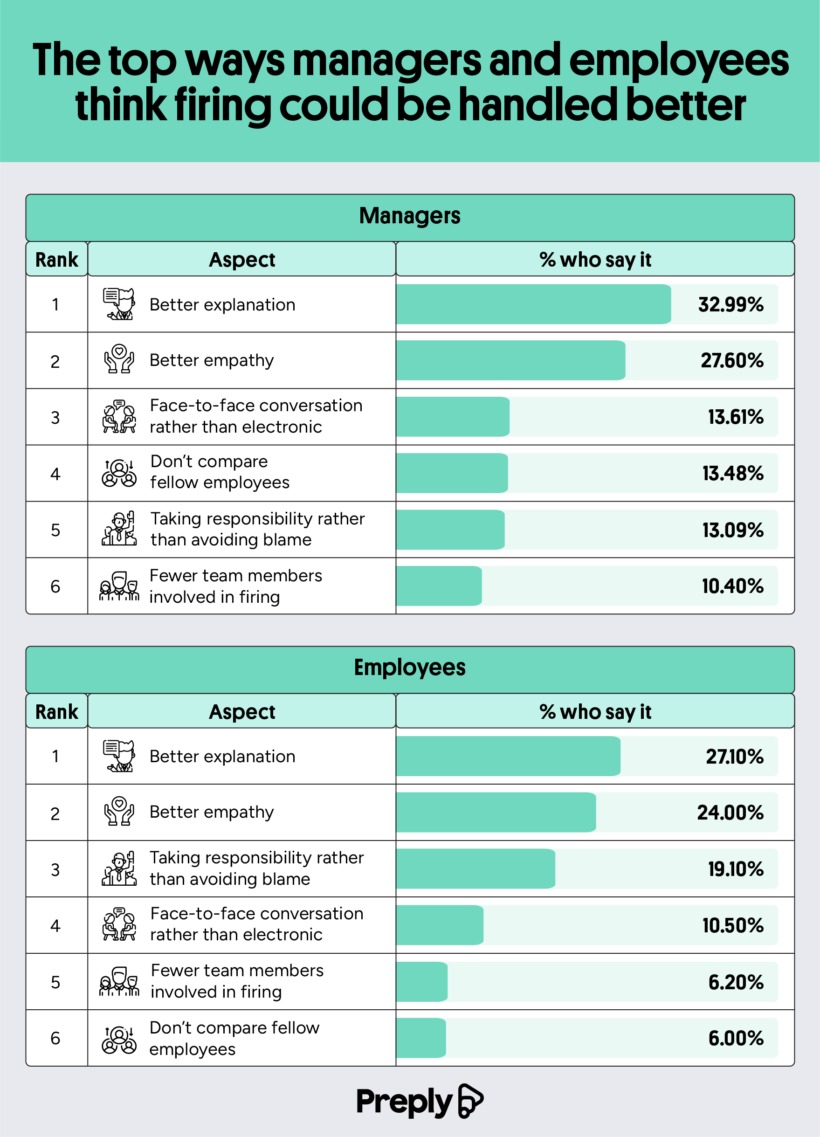
These are the six things employees want to see improved:
- Better explanation
- Better empathy
- Taking responsibility rather than avoiding blame
- Face-to-face conversation rather than electronic
- Fewer team members involved in the firing
- Don’t compare fellow employees
Here’s how that compares to changes managers would like to make to the process:
- Better explanation
- Better empathy
- Face-to-face conversation rather than electronic
- Don’t compare fellow employees
- Taking responsibility rather than avoiding blame
- Fewer team members involved in firing
These are similar answers, but we can see that the two groups ranked their importance differently. Overall, 92% of Americans think managers could benefit from some language training when it comes to firing someone. Empathy and honesty were high on the list of employee wishes, indicating that understanding can help give them closure on the job, and empathy softens the blow. Not many managers would prefer a face-to-face meeting. Only 1 in 6 prefer this to virtual meetings, which seem to be the most common option.
Only 55% of managers have received training on how to fire someone, and with many of them regretting their language choices, it seems that many managers would benefit from some education in business language and communication. Notice that many of the top phrases are more professional ways to say “fired,” like “letting you go,” “terminating,” and “no longer require.”
When managing a team, empathy and clear language are crucial. These skills can help managers excel at many tasks beyond having to let an employee go. But when a situation like firing someone is emotionally charged, the language used becomes more important than ever. Hopefully, the team’s study can help managers reflect on how they go about the process.
Business Visualizations
Study Examines the Ways Americans Resign from Jobs
Over 1,000 Americans responded to a survey from the Preply team that studied how Americans communicate when they quit their jobs. In 2025, over 3 million Americans quit their jobs, clearly indicating resigning is a common occurrence. But this study reveals that people have different approaches to quitting, as well as some commonalities. The team’s analysis encompasses the methods used to resign as well as the tone, language, and feelings surrounding the resignation.
Click below to zoom.
Most Americans reported a verbal resignation. 76% of the survey responders used this direct and personal approach to quit their jobs, while only 9% gave a handwritten notice of resignation. That’s surprisingly fewer than the number who “ghosted” their employer at 19%. Around 10% of workers quit via text, leading to 43% reporting that their resignation only lasted a few minutes. Quitting can be awkward and uncomfortable, so it makes sense that people want to get the conversation over with. Those who quit in letter or text said they sent “just a few words.”
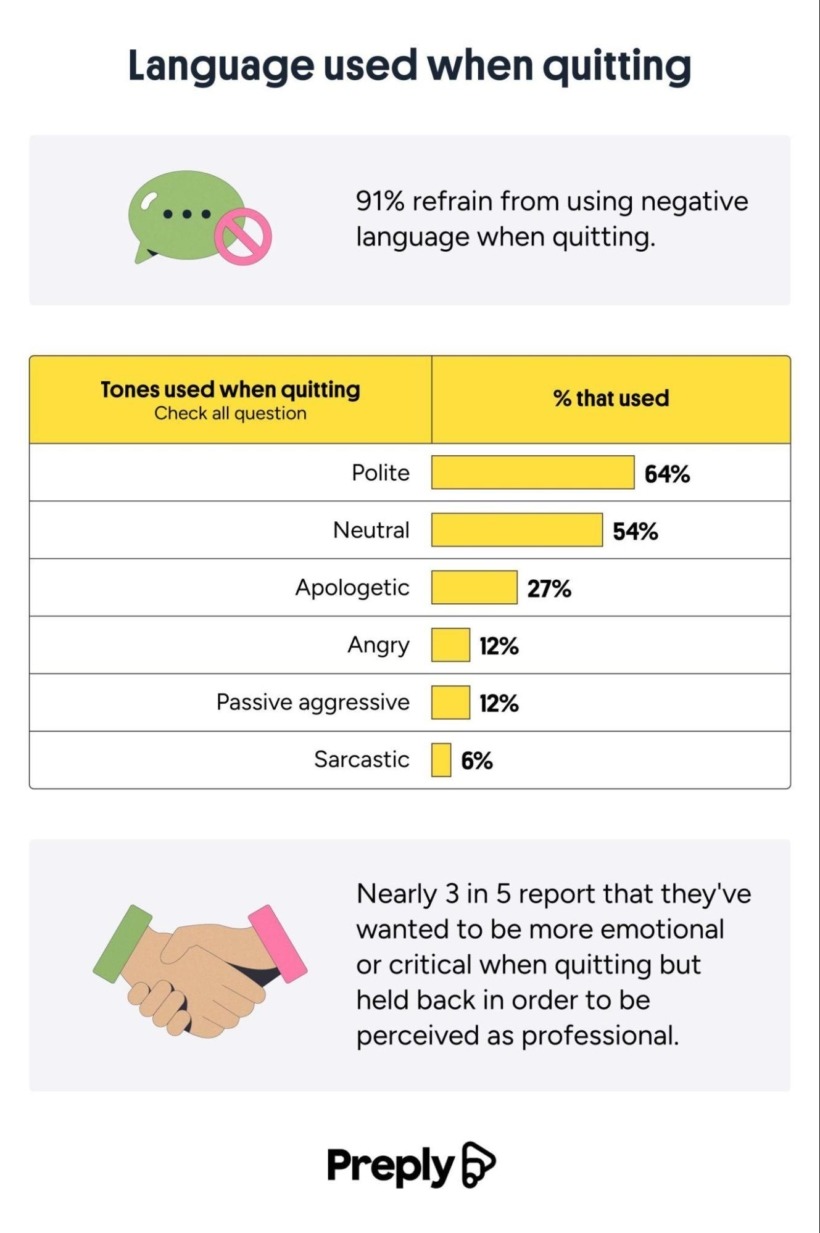
The next aspect the team considered was the tone and language used in the resignation. Naturally, many employees would want to avoid burning bridges when they quit. 91% of employees said they avoided using negative or critical language when resigning. 64% said they were conscious of using a polite tone, and 27% went as far as using apologetic tones and words. 60% of employees had to suppress their negative emotions and refrained from stating the critical reasons that led to their resignation.
There were some differences among ages and genders as well. Gen Z was the most restrained when resigning, with 61% stating that they held back emotions during the process. Boomers and Gen X were similar at 59% and 58% respectively. Millennials held back the least at 57%. As for gender, 63% of women said they suppressed their emotions and 53% of men reported the same. The team found that when employers offered exit interviews, 40% of workers felt more comfortable expressing their honest experiences at the company, which is important for companies that take worker experience and company culture seriously.
Most people said they avoided language, but here’s the specific breakdown of the tones they used when they quit:
- Polite – 64%
- Neutral – 54%
- Apologetic – 27%
- Angry – 12%
- Passive-aggressive – 12%
- Sarcastic – 6%
While people may hold back their negative feelings when resigning, that doesn’t mean these employees are above cutthroat tactics. One in eight people said they chose to resign at a time when they knew it would cause the most disruption and harm at work. Gen Z was the most likely to do this, and men were more likely than women. One in ten left negative or scathing reviews of their former company on sites like Glassdoor. Healthcare workers were the most likely to do this. These reviews often included negative words like “disorganized”, “stressful”, and “frustrating.” These written reviews often express things employers weren’t comfortable saying in person.
The trends and findings in this study provide a well-rounded look at a common experience, revealing surprising similarities among people in very different situations.
-

 Business Visualizations1 year ago
Everything Owned by Apple
-

 Business Visualizations1 year ago
America’s Most Valuable Companies Ranked by Profit per Employee
-

 Business Visualizations11 months ago
The Biggest Fortune 500 Company in Every State
-

 Business Visualizations8 months ago
The Biggest Employers by Industry
-
 Maps2 years ago
Penis Lengths Around the World
-
 Timelines2 years ago
A History of the Oldest Flags in the World
-

 Business Visualizations2 years ago
New Animated Map Shows Airbnb’s Fully Booked Cities Along the 2024 Eclipse Path of Totality
-

 Business Visualizations2 years ago
Everything the Luxury Giant LVMH Owns in One Chart


