
Maps
A Visual Guide to the World’s Largest Bodies of Water

Did you know that about 71% of Earth’s surface is covered with water? Between the large salt water oceans and long fresh water rivers, water makes up a significant part of our planet. Some particular bodies of water like the Pacific Ocean make up the majority of water on Earth. This visualization from TowerPaddleBoards.com illustrated 50 of the largest bodies of water on Earth.
Click below to zoom

The graphic depicts the Earth’s oceans, 15 largest seas, 15 largest lakes, and 15 largest river systems in an interesting way. It illustrated the outlines of each body of water and includes a photograph of the water system within the boundaries. The visualizations of the river systems also include the streams connected to the systems.
These are the 10 largest bodies of water in the world:
- Pacific Ocean: 60 million square miles
- Atlantic Ocean: 41 million square miles
- Indian Ocean: 27.2 million square miles
- Southern Ocean: 7.8 million square miles
- Arctic Ocean: 5.4 million square miles
- Philippine Sea: 2.1 million square miles
- Coral Sea: 1.8 million square miles
- Arabian Sea: 1.4 million square miles
- South China Sea: 1.3 million square miles
- Weddell Sea: 1 million square miles
The Pacific Ocean makes up about 46% of the water surface on Earth and 32% of the planet’s total surface. It’s larger than all of the land area on Earth combined! It is also home to the Mariana Trench, the deepest oceanic trench on Earth with a maximum known depth of 36,037 feet.

In some U.S. cities, a night out costs over twice as much as a night in, and in some locations, up to three times as much! A study from Rove Lab gathered data and compared doing the same date-night activity at home versus out across the 50 most populous U.S. cities.
Rove Lab compared the cost of two fixed dates. A night out included dinner for two at a restaurant, four beers at a pub, two five-mile taxi rides, and two movie tickets. A night in included ingredients for a home-cooked steak dinner, four store-bought beers, and a $5.99 stream rental. They used local prices from LivingCost.org and calculated a “premium for going out” in each city, which represents how much more a night out costs than a night in.
Click below to zoom.
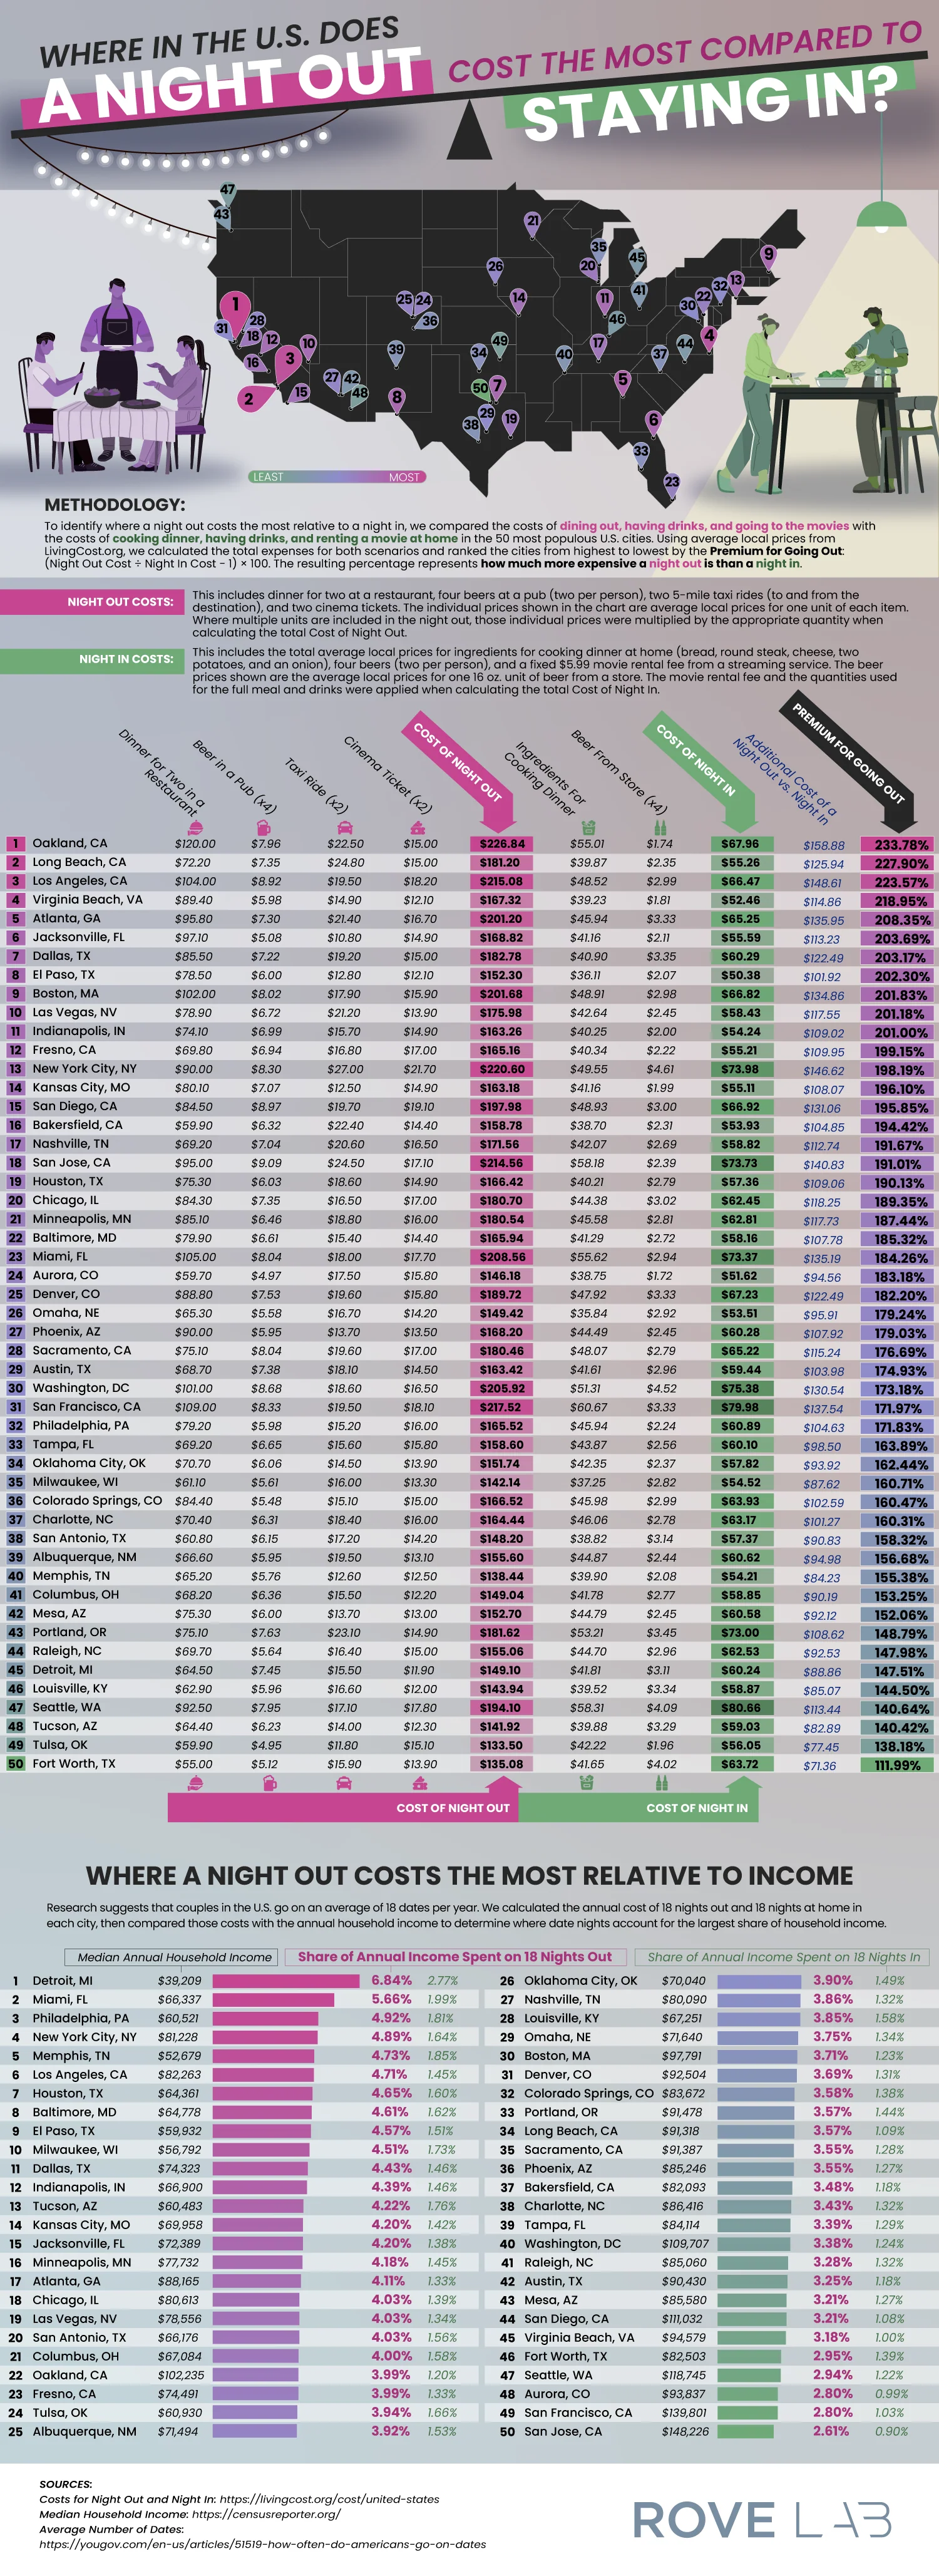
Oakland, California tops the list as the most expensive location for a date night. Dinner, drinks, a movie, and a taxi will cost $226.84 there compared to the $67.96 you’d spend on a night in. That’s a 234% premium for going out. Long Beach and Los Angeles were followed behind with premiums over 220%. Virginia Beach and Atlanta round out the top 5, and Jacksonville, Dallas, El Paso, Boston, and Las Vegas complete the top 10.
Some of the results are a little surprising. You might expect New York City to breach the top ten, and it does have the second-most expensive night out at $220.60, but it ranks only 13th because staying in is expensive there as well, so it has a lower premium. San Francisco and San Jose dropped in ranking for the same reason. At the other end of the list, Fort Worth offers the most affordable night out at a 112% premium.
Another ranking in the study might be even more revealing. Research shows U.S. couples have about 18 dates per year, so Rove Lab calculated what share of each city’s median household income goes to these dates. Detroit residents take the hardest hit. 18 nights out cost about $2,684, or 6.84% of a median income, compared with 2.77% for 18 nights in. Miami, Philadelphia, and New York City also rank highly on this metric.
San Jose is at the opposite end of the spectrum. It has one of the most expensive nights out, but high median incomes mean 18 dates take up only 2.61% of a typical household’s earnings. Local prices and incomes vary dramatically, so a city that looks expensive by one metric can look affordable based on another.
The team’s article included two full tables of data. The first lists all 50 cities with item-by-item prices, totals, the dollar difference, and the premium percentage. The second table shows each city’s median income compared to nights out vs. nights in. A summary of findings includes tips for making the most of an affordable night at home. This data might make couples think twice about how they spend their date nights and whether or not they want to adjust their budgets.
Most travelers pack a few assumptions about other cultures alongside their passport. They might believe everyone in Europe greets each other with a kiss on the cheek, or that showing up a little late is chic, or that warmer languages and climates mean warm, touchy greetings. Preply surveyed 1,600 people across 27 countries, suggesting that many traveler instincts are wrong.
The Root of Assumptions
Preply first examined how people judge cultures before they arrive and participate in them. 3,608 adults in six countries rated how different languages sound. French won for sounding romantic (54%), and Italian was close behind at 43%. Portuguese and Spanish led for warmth, while English came in last at just 7%. The article argues that these impressions of language often shape a visitor’s real-world expectations, even if it doesn’t match etiquette, or indeed, reality.
Greetings: Let the Other Person Lead
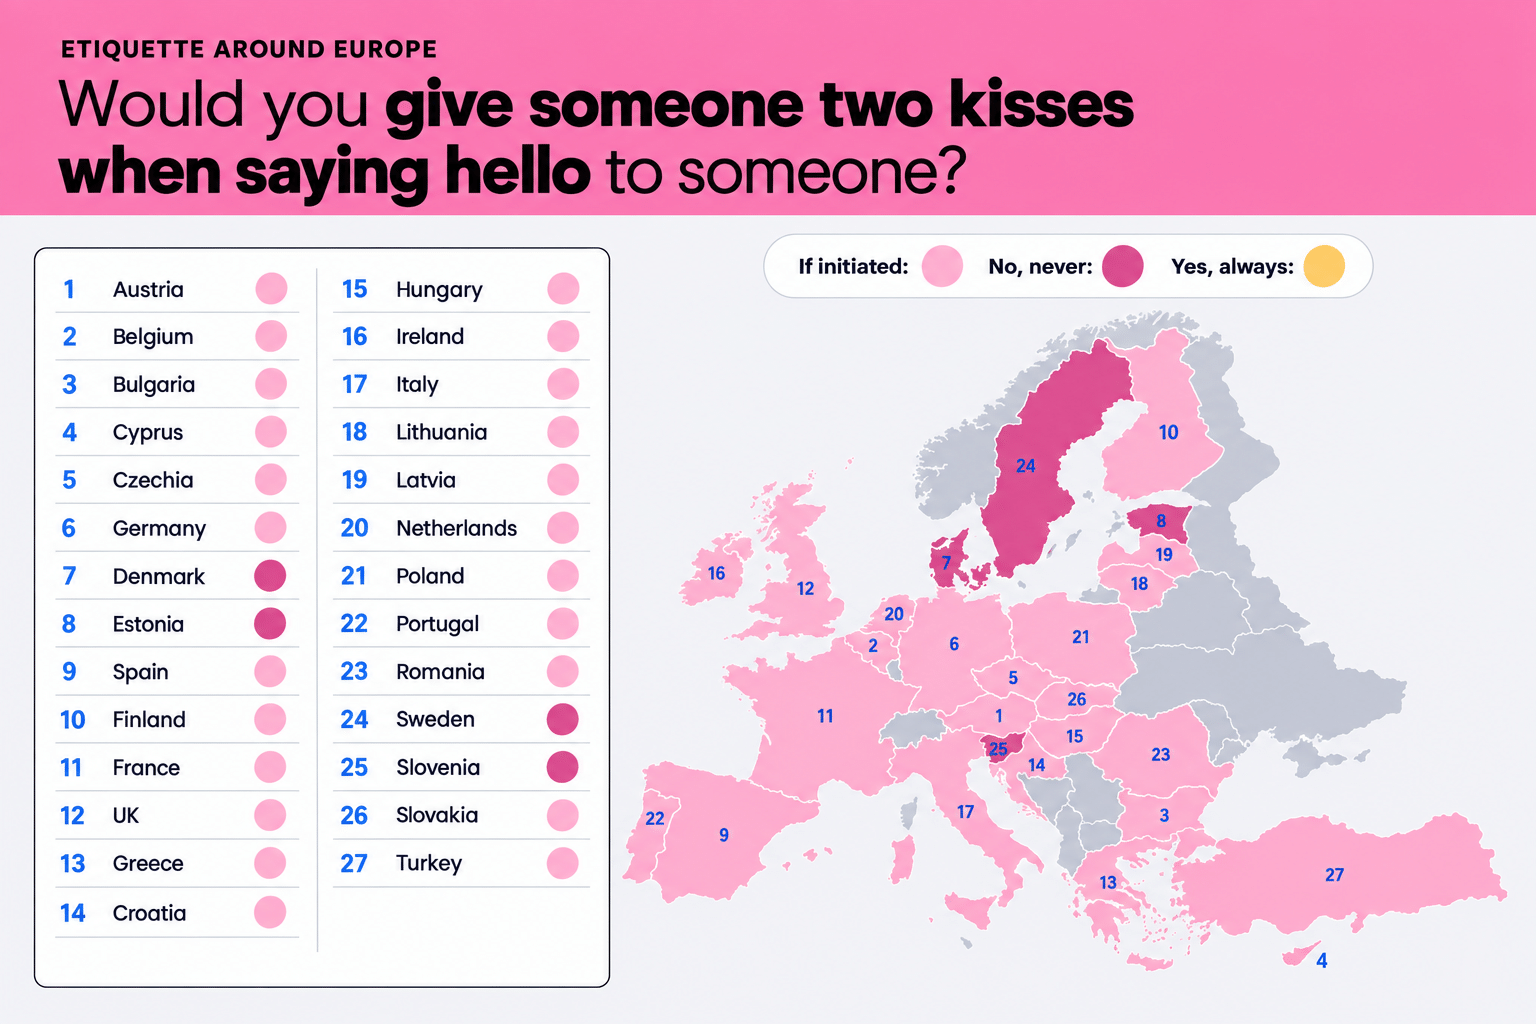
The double cheek kiss is Europe’s most famous greeting, but no one appears comfortable initiating it. In 23 out of 27 countries, most respondents said they’d only go in for it if the other person did first. Not a single country had a majority willing to initiate the double-cheek kiss. In Estonia, Denmark, Slovenia, and Sweden, people never do the cheek kiss. The article’s map shows exactly how each country lines up.
Click below to zoom.
Shoes: Leave them at the Door
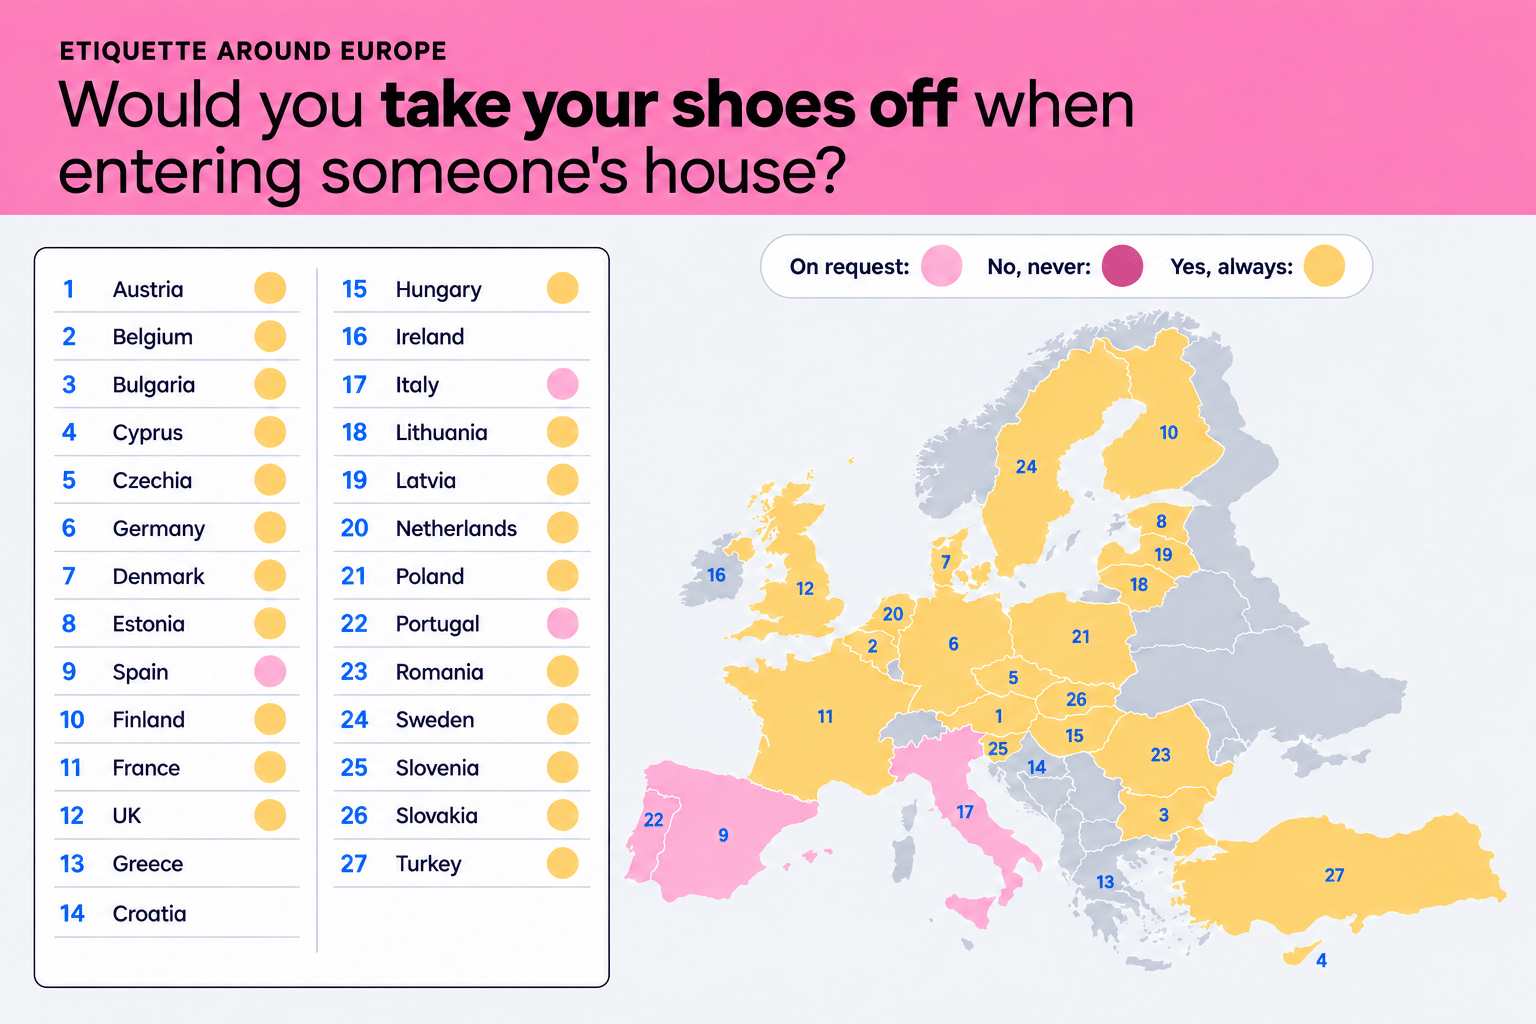
In 24 of 27 countries, the majority of people remove their shoes in someone else’s home. This was unanimous in Sweden, where 100% of respondents said they do this. Poland was close behind at 82%. Spain, Italy, and Portugal are outliers, but the Preply team had a theory about why. There’s a generational split. Under-35s take their shoes off automatically, and people aged 35 to 54 wait for their host to ask them to remove their shoes. Another map shows these preferences across continents.
Click below to zoom.
Gifts: Bring Them in Most Cases
Over half of European respondents treat bringing a small gift to a gathering as standard, and a third save this for special occasions. Finland is the only country where people said they’d never bring a gift to any social gatherings. Married respondents were 12% more likely than single people to show up with something in hand.
Food: Rules Here Are Unanimous
The survey’s only unanimous result centered on food etiquette when eating someone else’s cooking. All 27 countries saw it as a sign of respect to eat all the food on your plate. Men were a little more likely (82%) to clear their plates than women (75%).
Punctuality: Fashionably Late Doesn’t Exist
In 23 countries, the clear preference was for guests to arrive on time. Greece is the most emphatic on this point at 78%. Four countries leaned toward arriving a bit early: Czechia, Germany, Poland, and, believe it or not, France. Single people were more likely to run late, and men were more likely than women to arrive at events early.
Why Etiquette Matters
People care about etiquette and pay attention to it. The #etiquette hashtag on TikTok has 4.4 billion views, and searches on how to have good etiquette are up 373%. While etiquette is important, it does vary among countries and cultures, so maps like Preply’s creations are a helpful guide for travelers.*
As new technologies transform industries and create new skills demand, this analysis from Altium ranks states by how well their workforces are positioned to meet the future and a changing economy. The article, graphs, and maps show that tech readiness doesn’t always match a high-tech reputation.
Click below to zoom.
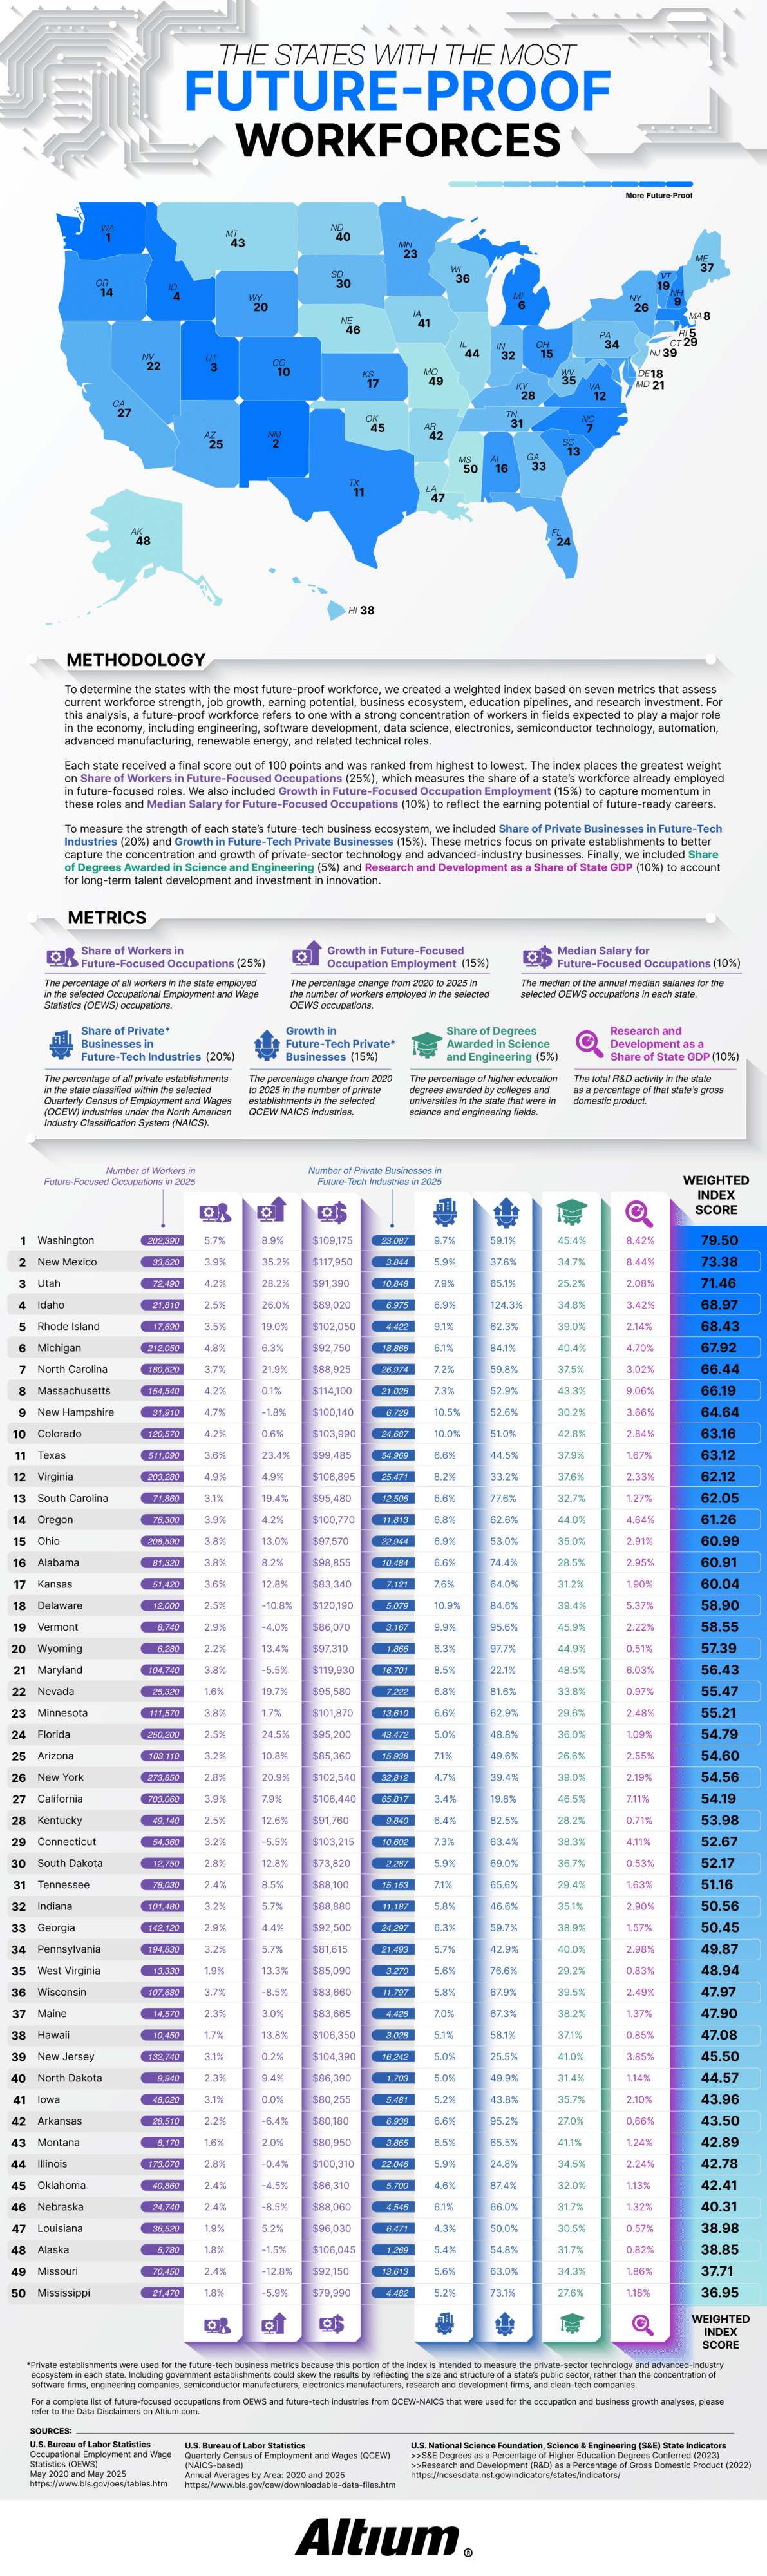
Altium defined a future-proof workforce as one with a large share of workers in fields expected to drive economic growth over the next few decades. The study tracked 30 occupations using data from the Bureau of Labor Statistics, including electrical and computer hardware engineers, software developers, data scientists, solar installers, semiconductor processing technicians, CNC programmers, and wind turbine technicians. The team considered 27 “future-tech” industries from aerospace to renewable energy to semiconductor manufacturing and R&D services.
Each state received a score out of 100 based on seven weighted metrics. The largest factor at 25% was the share of workers already employed in future-focused positions. The share of private businesses in future-tech industries was worth 20%. Employment growth and business growth from 2020 to 2025 counted for 15%. Median salary and research and development as a share of state GDP each accounted for 10%, and the share of science and engineering degrees made up the final 5%.
Washington took first place with a score of 79.50. Nearly 6% of the workforce there holds future-focused jobs and earns a median salary of $109,175. Washington’s future-tech businesses grew 59.1% over five years. The article credits the state’s concentration of software and aerospace employers, noting that Washington leads the nation in aerospace sales, exports, and employment.
The runner-up is more surprising! New Mexico ranked second, thanks to its 35.2% growth in future-focused employment. That’s the fastest growth rate in the country. Thanks to national laboratories and an expanding aerospace sector, it has one of the highest median salaries in the study at $117,950. Utah, Idaho, and Rhode Island round out the top five rankings. Idaho stood out for business expansion, with future-tech businesses growing by an eyebrow-raising 124.3%.
The study’s most confusing findings relate to California. The state employs 703,060 people in future-focused occupations, more than any other state, yet it only ranks at #27. Although California is strong in engineering education and R$D investment, future-tech industries make up only 3.4% of its private businesses. Its five-year business growth rate of 19.8% is the lowest in the nation.
Smaller states benefited when technology made up a larger slice of their economies. Rhode Island’s future-tech businesses represent 9.1% of its private sector and grew 62.3%. New Hampshire ranked ninth with the highest future-tech business share in the top ten at 10.5%. Rounding out the top ten were Michigan, North Carolina, Massachusetts, and Colorado.
Mississippi finished last with a score of 36.95, followed by Missouri, Alaska, Louisiana, and Nebraska. Several of these states saw a decline in future-focused occupations. The key takeaway is that a state’s headcount or Silicon Valley reputation alone doesn’t define its readiness for the future. A growing technical workforce and a dense base of tech businesses best position a state for the future.
-
 Charts2 years ago
Map Uncovers Countries with Most Powerful Passports
-
 Business Visualizations2 years ago
The Biggest Fortune 500 Company in Every State
-

 Business Visualizations1 year ago
The Biggest Employers by Industry
-
 Business Visualizations1 year ago
The Largest Companies in America That Are Still Run by the Person Who Founded Them
-
 Charts2 years ago
Study Highlights Disparity Between Homelessness Rates and Empty Housing
-
 Misc Visuals2 years ago
Exploring Science Fiction Technology That Became a Reality
-

 Charts1 year ago
New Study Reveals Details About American Intimacy
-
 Charts2 years ago
Study Determines Cities with Biggest Home Price Increases After COVID-19