
Misc Visuals
Discover the Movies Best for English Language Learning

Whoever said learning English is difficult and boring hasn’t seen this new study from Preply. It turns out that watching movies can help you improve your English learning, hooray! What better way to learn while having fun than sitting down with a bucket of popcorn and a good movie? Immersing yourself in popular media is a proven way to improve your real-world use of a language. Films can help you practice filling in comprehension gaps using context clues and studying facial expressions and body language for cues. Preply offers us a comprehensive watch guide of the best and worst films for learning English. They analyzed the 150 highest-grossing movies to present popular and enjoyable choices. Their score is based on the average number of words per minute, the difficulty of the vocabulary used, and the ease of watching with subtitles, which makes it easier to follow along.
Click below to zoom.
![Best movies for English language learning [Study]](https://thechartistry.com/wp-content/uploads/2026/04/movies-best-for-English-learning.png)
The team found that the best films for learning English are:
- Dawn of the Planet of the Apes
- Maleficent
- The Hobbit: Battle of the Five Armies
- Spider-Man 3
- The Hunger Games
Dawn of the Planet of the Apes has a low word count per minute and a simple vocabulary. This action-packed film should be easy to follow for those who don’t understand every word. The same is true of the Disney film, Maleficent, a retelling of Sleeping Beauty from the villain’s point of view.
Popular films that will give English language learners the most trouble are:
- The Wandering Earth
- Oppenheimer
- Barbie
- Shrek 2
- Finding Dory
This list has a few surprising results. While it’s no surprise to see the long, heavy, historical drama Oppenheimer on the list, it is funny to see it beside its famous marketing partner, Barbie, a much lighter film that released on the same day. But Barbie is chock-full of banter and musical numbers that add up to a high word count per minute and a frenetic movie for English learners to keep up with. This is the same reason animated films like Shrek 2 and Finding Dory made the list.
The team’s research points to fantasy and adventure films as the best genre for English learning, due to the large, dramatic, action-filled visuals that can help cue the meaning of dialogue. Epic quests and romantic films make for the best storylines. In keeping with these findings, they determined that the franchises best for learning English are The Hobbit films, the Spider-Man series, and the James Bond films. The team also separately emphasized films with high and low word-per-minute rates, which indicate how easy it will be to read the subtitles. Finding Dory is the most difficult to follow (thanks to the chatterbox of a fish in the starring role), and once again, Dawn of the Planet of the Apes comes up on top. This list is a great study tool for English students and one that ESL teachers should bookmark for lesson plans.
Student Choice has published the 2026 updated version of its study, ranking the most popular college degrees by return on investment after five years in the workforce. The team’s premise is timely as they examine a hot topic: the cost of higher education. The average cost of college now exceeds $43,000 per year, so entering the workforce with these student loans became a high-stakes game. The analysis pairs the top 25 majors in 2026, based on a previous Student Choice study, with earnings data from the U.S. Bureau of Labor Statistics to calculate how much a graduate earns in their first five years relative to their four-year tuition investment. They illustrated their findings by ranking 20 degree types compared to 40 common occupations.
Click below to zoom.
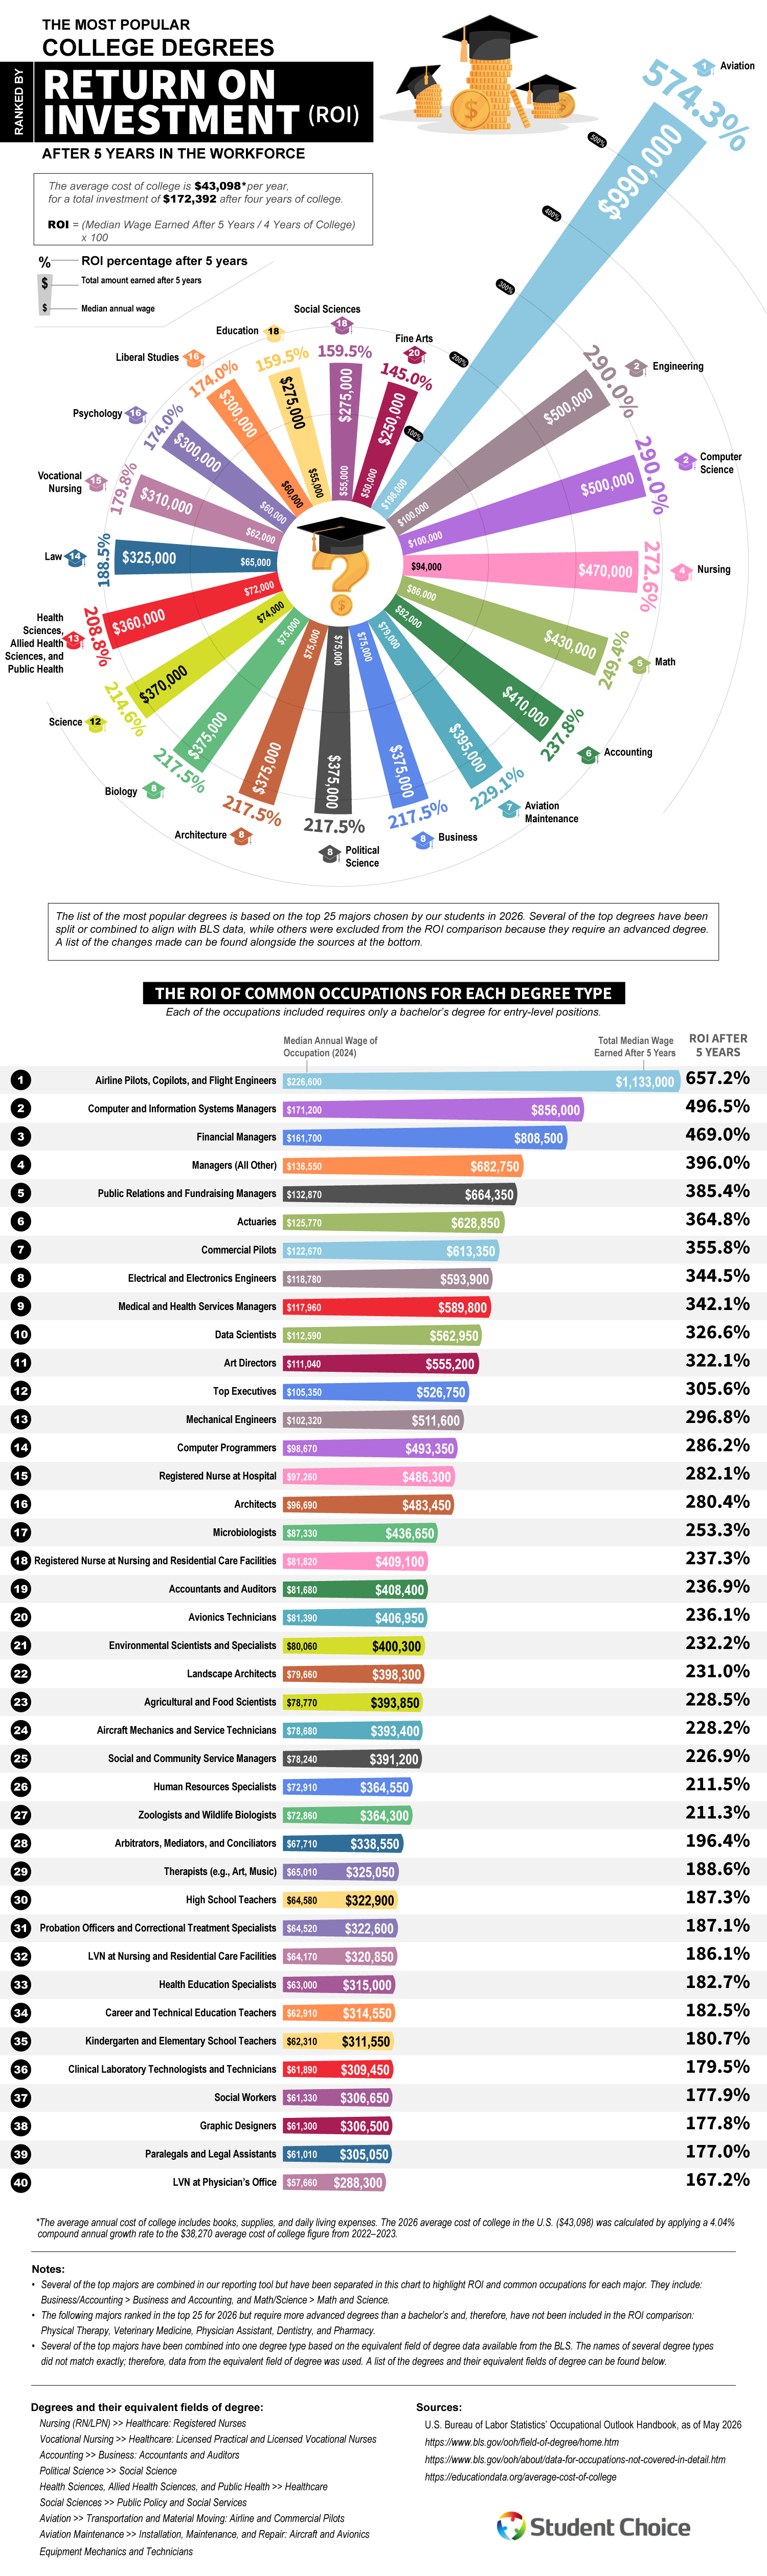
The team used a simple methodology. The average cost of college is $43,098 per year for a total investment of $172,392 for four years, with ROI calculated as median wages earned over five years divided by the four-year college cost. Majors that require advanced degrees like physical therapy, veterinary medicine, physician assistant, dentistry, and pharmacy were excluded from the ROI comparison even though these majors rank in the top 25.
Aviation tops the rankings chart, claiming the leading spot by a wide margin because of its astounding 574.3% ROI after five years, boosted by the median annual wage of $198,000. The field’s popularity is likely due to high pay and a looming pilot shortage as veteran airline workers retire. Engineering and computer science tied for second place at 290% each with median wages of $100,000 a year.
Healthcare and quantitative fields round out the upper tier. Nursing ranks fourth with an ROI of 272.6%, followed by math at 249.4% and accounting at 237.8%. Business, political science, architecture, and biology all tie for eighth at 217.5%, based on a $75,000 median wage. Education and social sciences sit near the bottom of the list at 159.5%, and fine arts at the bottom at 145%.
The study’s most helpful section might be the table that shows how career choice within a major can dramatically outperform the degree’s baseline. Aviation graduates who became airline pilots, copilots, or flight engineers reached a 652.7% return on a median wage of $226,600. Computer and information systems managers hit 496.5%, financial managers reached 469%, and public relations and fundraising managers reached 385.4%. Even lower-ranked majors can have exceptions. For example, fine arts majors who become art directors have a 322.1% return with a median salary of $111,040. Math majors working as actuaries earn 364.8%.
Overall, though, this study shows us that getting a degree pays off. Even accounting for student debt, the data suggests that degrees can double or triple the initial investment within five years. While most people will work for about four decades after student life, the returns will continue to compound. There is a growing preference for specialized, career-focused degrees with clear pathways into established professions so students can enjoy the ROIs we see here.

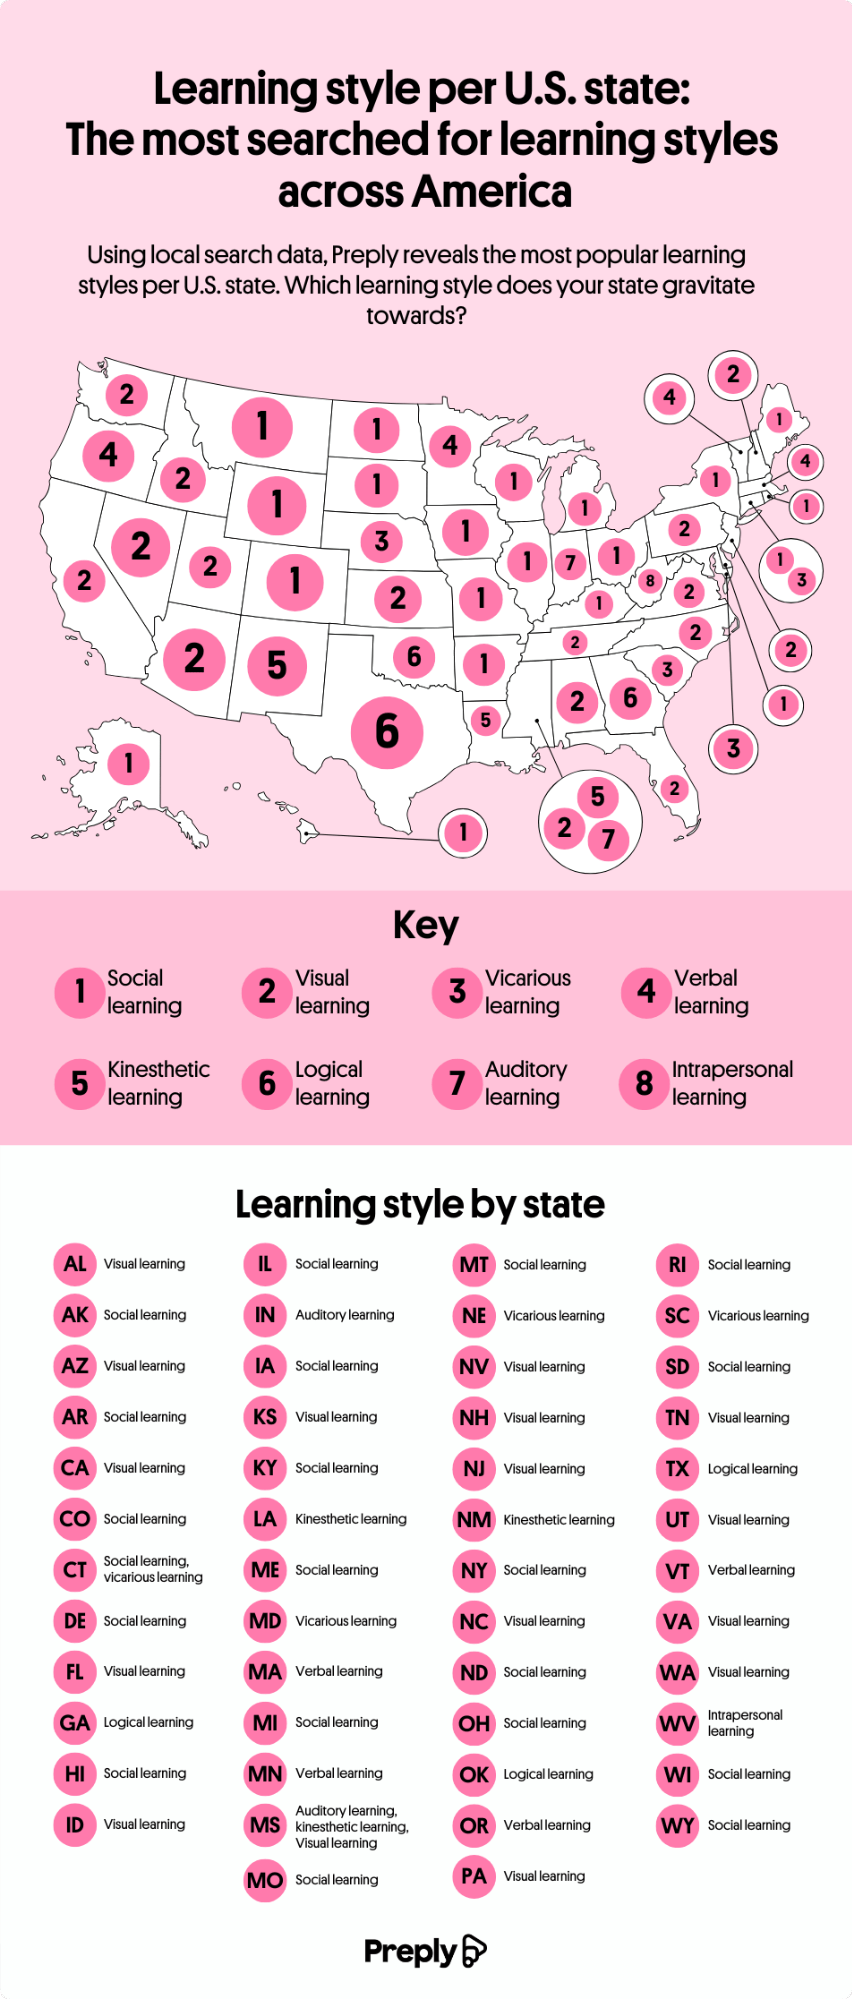
Why do some people absorb new information like a sponge while others labor for hours over a textbook? According to a study by Preply, the answer lies in their learning style. The team set out to map which styles dominate across the United States. Preply emphasizes the importance of its study by citing research showing that more than half of Americans spend under two hours a day studying, with teenagers reporting feeling distracted. At the same time, the majority of Americans believe that different learning styles exist. To identify which styles are most common and where, Preply analyzed a year of Google Trends data across 50 states to map the dominant learning style in each.
Click below to zoom.
A Nation of Social Learners
The study’s standout finding is that 40% of Americans are social learners, making it the single most common learning style in the country. Social learners take in information through interaction and conversation. According to the map, 20 states favor the study-buddy approach, including Connecticut and New York.
Visual learning came in second place. These learners thrive on aids like flowcharts, maps, doodles, and color-coded notes. Preply found that visual learners are concentrated in California, Florida, and Washington. Together, social and visual learners account for more than 70% of Americans.
The Less Common Learning Styles
The remaining six styles in Preply’s study, verbal, vicarious, kinesthetic, logical, auditory, and intrapersonal, are much less prevalent, making up just 34% of preferences combined. Verbal and vicarious learning tie as the third most popular style, but together account for only about 8%. The map reveals some notable patterns. While the West skews heavily toward visual learners, the eastern half of the country shows more variance. Massachusetts and Vermont residents lean toward verbal learning, while Connecticut and New Yorkers favor social learning.
A few individual states stand out as outliers. Auditory learning, which is learning through hearing information, leads in only two states: Mississippi and Indiana. West Virginia is the only state in the country that favors intrapersonal, solitary learning. This is the least preferred learning style nationwide.
What We Can Learn from These Findings
Preply began their study with a seed list of widely recognized learning styles drawn from educational resources, then measured popularity using Google Trends data from 12 months across 50 states. Where multiple styles ranked equally in a state, the team treated them as equally popular. The point Preply drew from this data is the recognition that how you learn is a useful step toward more effective studying, particularly in a country where study time is short and distractions are plentiful.
What emerges from the team’s map is a portrait of a country that isn’t uniform. No single learning style dominates everywhere, and neighboring states can be quite different from one another. This study serves as a reminder that study habits are shaped by geography, culture, and personal preference. The Preply study is another in a long line of ideas about how people learn, drawing on theories from Aristotle to Howard Gardner, to Neil Fleming.

Compatibility is usually our biggest driver in the search for a romantic partner, but it turns out that age is still a major part of that compatibility. Tawkify’s matchmaking service surveyed about 98,798 Americans over two years, asking whether they’d date someone older and younger and how far outside their own age range they’d go. The data reveal both geographic and dating patterns, with a recurring pattern: smaller dating pools push singles to date across wider age ranges.
Click below to zoom.
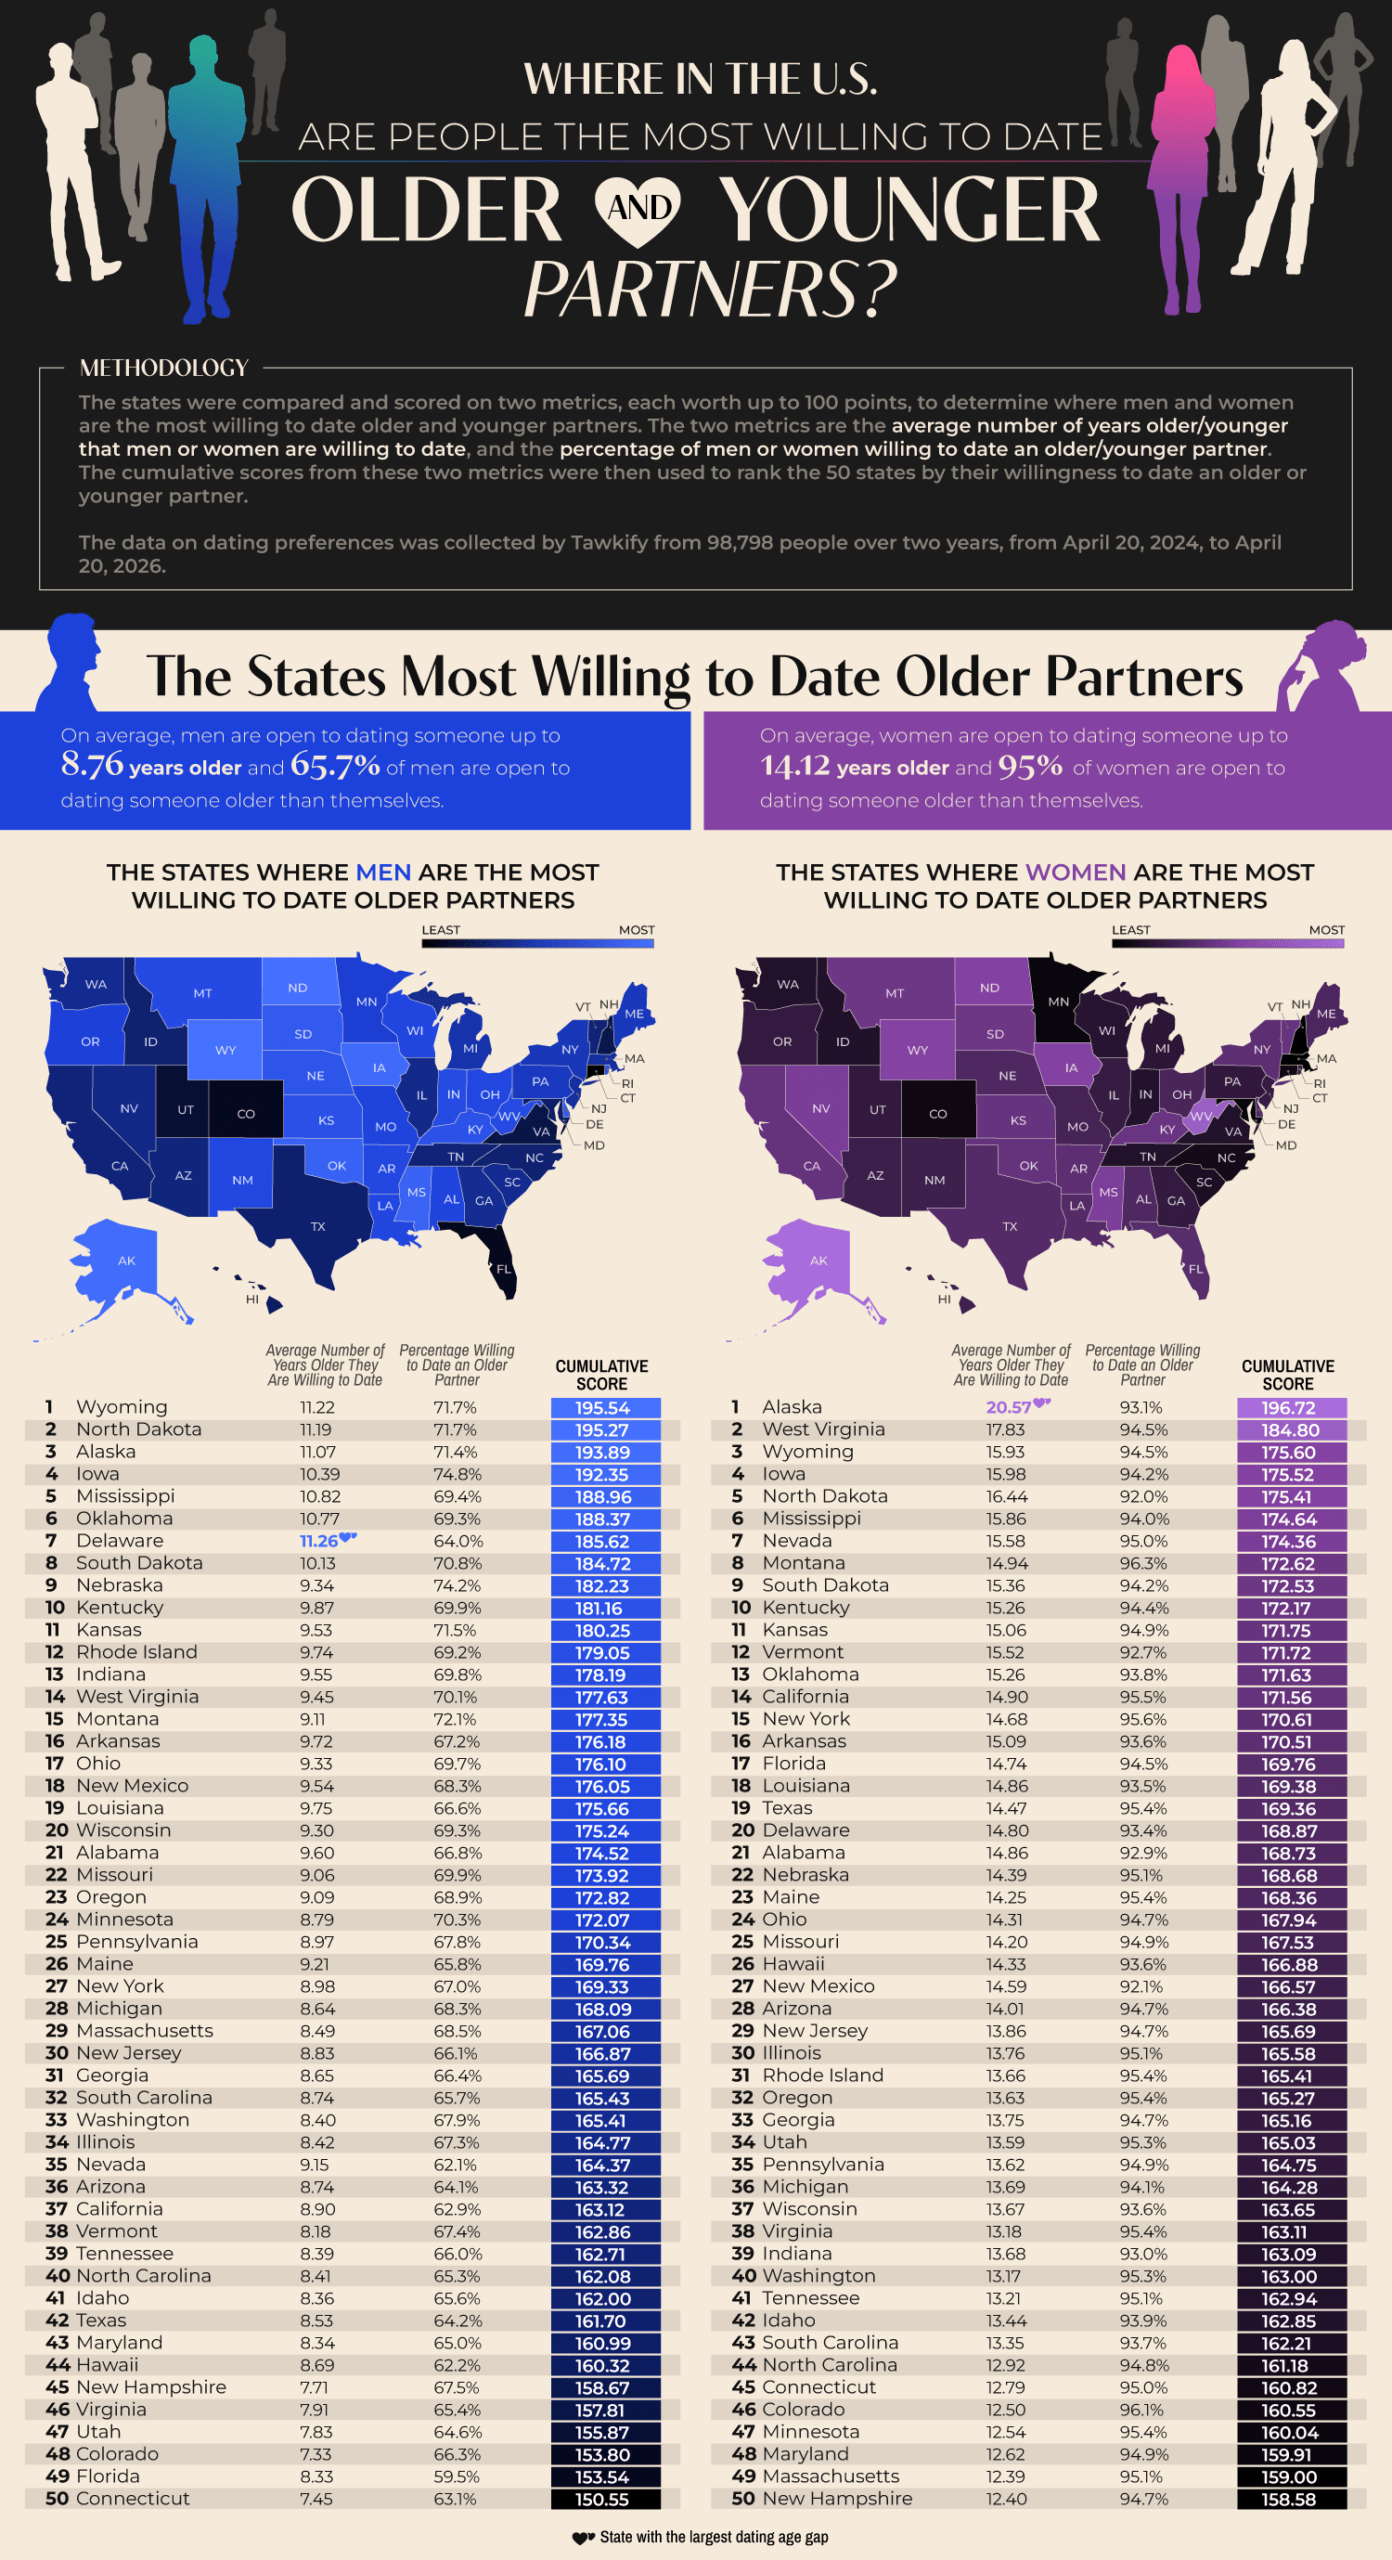
Wyoming tops the list of states with men willing to date outside their age range. 71.1% of Wyoming singles are willing to date an average of 11.22 years older than they are. North Dakota and Alaska also appeared in the top three. Delaware emerged as an interesting outlier. They have the largest average age gap in dating among men, at 11.26 years. 93.1% of Alaskan women are open to dating older partners, and they have the nation’s largest age gap by far at 20.57 years. West Virginia and Wyoming women follow in second and third. It seems that less-populated states show greater willingness to date outside their age range, which could be a very simple explanation. A smaller dating pool means singles widening their options.
As for willingness to date younger partners, Hawaii leads for both genders. 96.8% of Hawaiian men are willing to date someone younger, with 18.59 years as an acceptable age gap. This is the widest that appears in the study. 92% of Hawaiian women are open to dating younger, but their average age gap is only 9 years. Hawaii has an older-than-average population, with a median age of 41.5 years, so this limited island dating pool makes dating younger people more common. The runners-up for willingness to date younger were Nevada, Idaho, and Maine.
According to the data, women are dramatically more open to dating older than men are. 95% of women would date an older partner, compared with 65.7% of men. This pattern flips with dating younger. 96.5% of men would date someone much younger, with a national average age difference of 14.7 years. 88.1% of women would date younger men, but at a much smaller average age gap of 7.14 years. This shows that across the country, men tend to date younger partners, while women tend to date older partners. Women are consistently willing to tolerate a wider gap when dating up.
The team threw us a little fun fact from the Guinness Book of World Records, which lists Gertrude and John Janeway, married in 1927, as the largest spousal age gap of 63 years. Age-gap relationships can succeed but face challenges like judgment and assumptions about power dynamics and differing life stages. Strong communication, shared values, and aligned goals matter most in relationships, more than the number of years lived. Geography and gender seem to shape who Americans date, but the data also suggest that openness to age-gap romances often comes down to opportunity.
-
 Business Visualizations2 years ago
Everything Owned by Apple
-
 Business Visualizations2 years ago
America’s Most Valuable Companies Ranked by Profit per Employee
-
 Business Visualizations1 year ago
The Biggest Fortune 500 Company in Every State
-
 Business Visualizations1 year ago
The Biggest Employers by Industry
-
 Charts2 years ago
Map Uncovers Countries with Most Powerful Passports
-
 Business Visualizations10 months ago
The Largest Companies in America That Are Still Run by the Person Who Founded Them
-
 Timelines2 years ago
Timeline Charts the Development of Communications Technology
-
 Maps2 years ago
A Map to Gold and Silver