Charts
How Many Crayola Crayon Colors Are There? A Lot.
This may be the most colorful visualization of history we’ve ever seen! This chart shows every single color of Crayola crayon ever made. Given the company’s long history, that’s an impressive and long list of colors! Over the years they’ve made many special and limited editions sets of crayons, so you may not have realized that the company has made over 400 crayon colors. And yet, it’s true! Since the first set of crayons was made back in 1903 with a simple set of 8 colors, the company has become a childhood staple and experimented with all kinds of different colors, styles, and twists on the wax crayon. You can see it for yourself on the visualization:
Click below to zoom
Scanning over these colors is a real trip down memory lane. Crayola doesn’t have all these colors in circulation anymore. You might remember glitter crayons from childhood or the neon set. Or what about scented crayons that smelled good enough to eat? Many people feel nostalgic over the smell of Crayola’s which comes from a substance called stearic acid, which is derived from beef fat. Unfortunately, you can’t buy every color in the graph fresh and new (though plenty of people sell them used for collectors.) Crayola does sell a huge set of 120 crayons for a well-rounded set of what they offer. Only the most avid collectors might experience all 400 colors, but we can come close with the colorful visual of the long history of Crayola!
Charts
What Percentage Do Popular Side-Gig Apps Take from Each Sale in the U.S.?
An article from LLC Attorney.com offers one of the most detailed, data-rich comparisons of how much major gig and marketplace platforms extract in fees from workers’ earnings versus how much the workers keep. This article goes beyond anecdotal evidence and offers practical insights alongside raw data. Every freelancer, business owner, and part-time gig worker should understand the information presented here so they can wisely choose where to sell their products and services.
Click below to zoom.
The article’s most important message is that platforms vary widely in how much they take from earnings. These differences can have a big impact on the workers’ bottom line. Here are some examples:
Rideshare Apps: Major platforms like Lyft and Uber typically take about 25% to 30% of passenger fares, and in some cases more for low-priced trips. Drivers do get to keep 100% of tips.
Delivery Services: Delivery gig earnings are reported as base pay plus tips. Workers receive the full tip amount, but pay varies by platform and market demands.
Creative Marketplaces: Platforms like Etsy charge a 6.5% transaction fee on their total sale price, plus a payment processing fee of around 3%. There are also optional advertising fees, so the total fee is about 10%. Poshmark takes 20% of sales over $15.
Pet Care Apps: Some pet care apps, like Rover, take about 20% of earnings in fees, while Wag takes a significantly higher portion, around 40%.
The article also discussed lodging and rental platforms. Hosts on Airbnb pay a 3% host service fee, plus a guest service fee of approximately 14% to 15%. Platforms like Vrbo and Booking.com have variable fee structures that usually land between 10% and 25%, depending on the model.
What makes this article especially useful is the visual chart, which lets you quickly peruse and compare dozens of apps. If a worker juggles multiple platforms, let’s say they’re a DoorDash delivery driver, have an Etsy shop, and flip items on Poshmark, they can compare all these platforms quickly and decide which are the most profitable. This is also crucial information to help people set prices effectively.
The article places these fees in the context of the gig economy boom. Millions of people supplement their income and build independent businesses using these apps. About 16.6% of side hustlers report delivery or ride-sharing gig work as their part-time side hustle, with an online shop and freelancing close behind. Recent surveys show that 70% of Americans earn extra cash through side gigs, often via the apps listed in the chart. Even so, many users underestimate the extent of platforms’ control over visibility, fees, and pricing.
Understanding each platform’s fee structures is integral to a financial platform. These fees and the pricing workers set can have a strong influence on whether a side hustle is profitable. The information presented here is a decision-making tool that combines clear, comparative data with important context to help side hustlers succeed in their ventures.
Charts
Highlighting 30 Safety Features Every Senior Should Know
While aging can bring positive life changes, such as retirement and the freedom to spend more time on hobbies, travel, and visiting family, it also presents unique challenges. Ooma presents a safety guide for seniors, highlighting 30 tips to help them age safely, stay connected, and maintain independence. Instead of a simple list of helpful gadgets, the team created a roadmap to help seniors navigate a rapidly changing world with confidence.
Click below to zoom.
One of the most crucial sections focuses on digital safety and online scam protection. Seniors can use the Internet to learn new things and connect with others, but it’s also full of risks and schemes where criminals prey on uninformed elders. The article explains how to avoid scams with password managers and multi-factor authentication. These tips on strong password creation and extra protection can drastically lower the risk of identity theft and financial loss due to scams.
The following section focuses on physical safety and emergency response. While most of us know to call “911” in an emergency, many of us are unaware of Enhanced 911 (E911), which automatically sends a senior’s address to responders. This is critical if the senior who placed the emergency call cannot speak. A medical ID displayed on a smartphone lock screen can help EMS workers begin treatment instantly and save more lives. Fall detection devices make good use of these services by automatically sharing location and calling for help. These affordable, simple tools can save a senior’s life.
Next, the chart moves on to home security. Smart security cameras and motion-activated systems don’t have to be complicated. They can help seniors reduce stress and increase their peace of mind. Smart doorbells and two-way audio allow them to communicate with visitors without having to go to the door. Environmental monitoring devices are essential for detecting poor air quality and dangerous temperature conditions. Practical advice and the article’s compassionate tone remind readers that safety offers seniors independence.
In that same spirit of independence, the article turns to accessibility. These include visual/hearing alerts, simpler phone interfaces, and medication reminder apps. These tools address health issues that affect all seniors, like hearing loss, vision changes, and memory challenges. These apps and aids will help seniors develop healthy daily routines, reduce frustration, navigate the world, and make the most of their lives.
Lastly, the guide addresses phone safety and scam calls. Seniors can use caller ID authentication and call blocking to reduce fraudulent calls. Unfortunately, seniors are often victims of these scams. While education is also essential for helping seniors navigate these calls, modern VoIP technology and other features make the process much easier. A caller’s sense of urgency can sway them, so these tools can help them avoid the calls altogether.
The team’s tips empower seniors and their loved ones, helping them prepare for the future. This list is a conversation starter to help families plan for independent seniors to live safely and healthily.
Charts
The Home Improvement Projects with the Strongest ROI
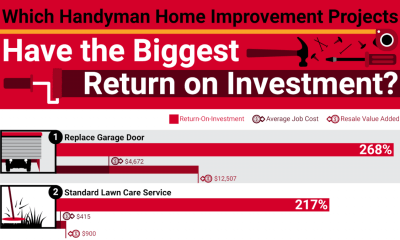
Deciding which home improvement projects are worth your time and money can yield big payoffs. Whether you think you’ll sell yourself soon or want to increase your comfort and value, you can use this new study from Ace Handyman Services to decide which projects to tackle. Their article “Which Handyman Home Improvement Projects have the Biggest ROI?” pinpoints the upgrades and repairs that will give you the greatest return on investment.
Click below to zoom.
The study focuses on cost-effective projects that offer a tangible increase in home value. These projects will improve the home’s functionality and make it look more cared for. Both qualities are appealing to potential buyers. Some of the top upgrades the team lists are garage door replacement, new entry doors, refinishing floors, fixing siding, and painting the walls. Landscaping and proper lawn care also go a long way toward increasing curb appeal. Nationwide surveys show that simple cosmetic upgrades can add over 100% of the project’s cost to the home’s value. This is particularly true if you paint in neutral or modern colors.
Experts also point to kitchen and bathroom improvements as good, modest cost investments. Replacing fixtures and cabinets can make a big difference. National data points to small-scale kitchen remodels recouping 80% to 96% of their costs, which is a much better ROI than big, expensive remodeling overhauls. We see in the team’s data that flooring and exterior upgrades also have a major impact. Well-maintained and upgraded floors are often worth more than the cost to do the project. New hardwood floors or sanding and refinishing floors add around $5,000 of resale value. A lawn care service has an enormous ROI of 217%, underscoring the massive impact of curb appeal. Upgraded landscaping can add $9,000 in value, and even simple landscape lighting can add around $4,000. You could also consider adding an outdoor fire feature, which would add $5,000 in value.
Overall, these projects had the highest ROI:
- Replacing the garage door
- Standard lawn care service
- Replace the entry door
- Install manufactured stone veneer
- Sand and refinish hardwood floors
- Install new hardwood floors
- Replace siding
- Paint interior
- Landscape maintenance
- Upgrade the landscape
The biggest message the team’s study underscores is that handyman projects can outperform big remodels and renovations in terms of increased home value. These handyman-friendly projects that the average DIYer can achieve represent a balance of cost-effectiveness, value impact, and everyday comfort enhancement. Always lean toward adding visual appeal and increasing functionality when deciding on ways to improve your home. The projects on this list will help you make a more beautiful, comfortable home without breaking your back. Whether you hire a handyman service or take on the project yourself, these projects are within your grasp and will give you a solid return on the investment.
-

 Business Visualizations1 year ago
Everything Owned by Apple
-

 Business Visualizations1 year ago
America’s Most Valuable Companies Ranked by Profit per Employee
-

 Business Visualizations12 months ago
The Biggest Fortune 500 Company in Every State
-

 Business Visualizations9 months ago
The Biggest Employers by Industry
-

 Business Visualizations2 years ago
New Animated Map Shows Airbnb’s Fully Booked Cities Along the 2024 Eclipse Path of Totality
-

 Business Visualizations2 years ago
Everything the Luxury Giant LVMH Owns in One Chart
-

 Timelines1 year ago
Timeline Charts the Development of Communications Technology
-

 Business Visualizations4 months ago
The Largest Companies in America That Are Still Run by the Person Who Founded Them


