Charts

How Much Teachers Spend on Their Classrooms in One School Year

Published

on

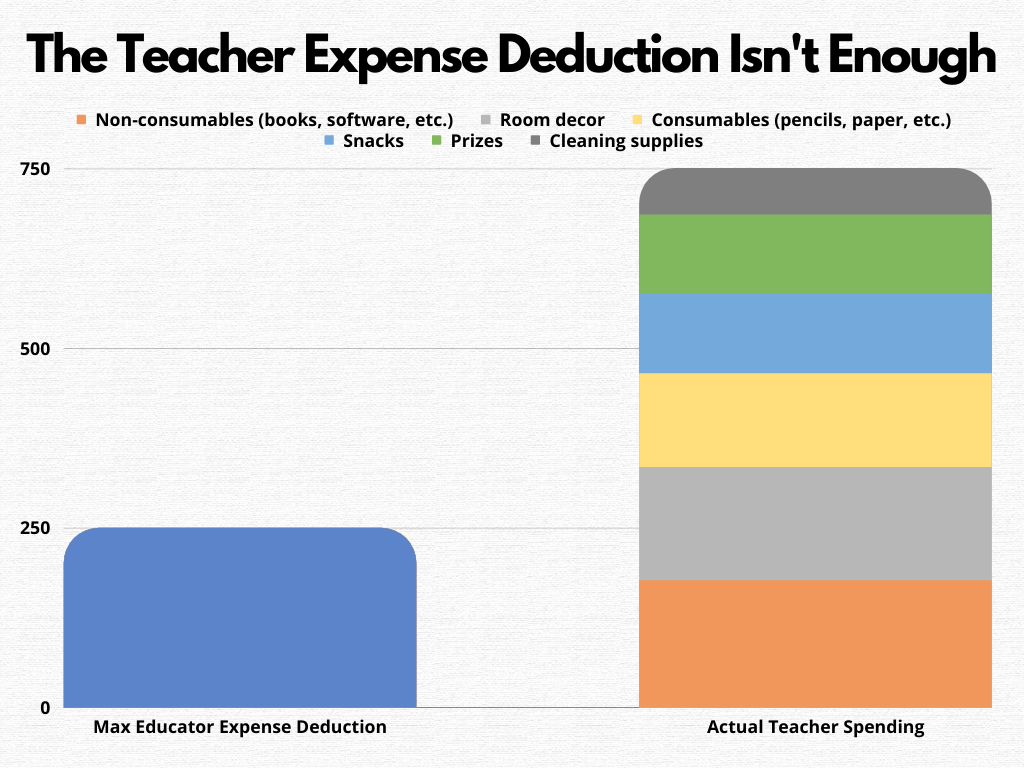
It was twenty years ago that the educator expense deduction was set, and today, tax time is always a difficult reminder for teachers across the United States that the deduction itself isn’t quite enough. The educator expense deduction has allowed teachers to deduct up to $250.00 for out-of-pocket classroom expenses since 2002, and the maximum amount has remained the same today.

Click below to zoom

teachers-spend-classroom-year-chartistry

One of the major issues lies in that on average each year, teachers are spending an average of $750.00 of their own money for classroom expenses, which is an astounding three times more than they’re able to deduct around tax time. In the United States alone, teachers have spent about $2.8 billion of their own money, for their students, on supplies like pencils, paper, cleaning supplies, books, software and more.

A look at this visualization, found via My eLearning World shows the breakdown of how teachers are spending on their classrooms, with this pie chart broken down into six different areas. The leading area of expense is the non-consumable supplies, which includes books and software.

  • Non-consumable supplies (books, software, etc.): 23.6%
  • Class decor: 21%
  • Consumable supplies (pencils, paper, etc.): 17.4%
  • Food & snacks: 14.8%
  • Prizes: 14.6%
  • Cleaning supplies: 8.6%

Teacher salaries have not been keeping up with inflation either. Since 2015 alone, the spending on classroom supplies for teachers has increased approximately 25%, yet they’re still only able to deduct $250.00 at maximum at tax time. Some have even said that the cost of classroom supplies is $250.00 each month.

Per NPR, it’s reported that about 55% of those who are still teaching as a profession are strongly considering leaving the career behind for something else, much sooner than they had originally planned to. With an estimated 567,000 less teachers than there were prior to the COVID-19 pandemic hit, the shortage of educators in the United States is alarming, but perhaps with good reason.

Continue Reading
Click to comment

Leave a Reply

Your email address will not be published. Required fields are marked *

Charts

Which Countries Produce the Most Gemstones?

Published

on

Gems like rubies, emeralds, and diamonds are found in jewelry all over the world. Some countries are known for their prolific gemstone production. Do you know the countries are the biggest sources of each gemstone?

BriteCo, a jewelry insurance company, analyzed data from the U.S. Geological Survey and the International Gem Society to visualize the countries that produce the most of each type of gemstone.

Click below to zoom

countries-produce-most-gemstones-chartistry

The graphic utilizes a world map to show which country produces the most of many different types of gems. The visualization also includes beautiful depictions of each gem included on the map as well as the kilograms of gemstones produced between 2016 and 2020.

These are the top-producing countries of some of the most popular gems:

  • Amethyst: Zambia (4,465,166 kilograms)
  • Diamond: Russia (22,720 kilograms)
  • Emerald: Zambia (129,400 kilograms)
  • Garnet: Tanzania (765,768 kilograms)
  • Pearl: Burma (9,245 kilograms)
  • Quartz: Brazil (69,830,000 kilograms)
  • Ruby: Tanzania (99,000 kilograms)
  • Sapphire: Kenya (45,339 kilograms)
  • Topaz: Nigeria (77,793 kilograms)
  • Turquoise: Iran (105,000 kilograms)

Overall, the top producer of gems around the world is Tanzania. The country is the top producer of six gemstones on the list (aquamarine, garnet, ruby, sunstone, tanzanite, and tourmaline). In fact, the name tanzanite was given to the gem by jewelry giant Tiffany & Co. in the 1960s to highlight how it can only be found in Tanzania. The mining area for tanzanite is just 7 kilometers (4.3 miles) long and 2 kilometers (1.2 miles) wide in the Manyara region of Tanzania. Tanzanite was named as a December birthstone in 2002 by the American Gem Trade Association.

Continue Reading

Charts

The Fastest Growing Sports in America 

Published

on

Classic sports like baseball, football, and basketball have long been some of the most popular sports in the United States. However, in recent years, other sports have been increasing in popularity. Researchers at ReCreate analyzed data from the Sports & Fitness Industry Association to create a graphic displaying the sports that are growing the fastest in the United States.

Click below to zoom

fastest-growing-sports-america-chartistry

The visualization lists the growth of each sport’s popularity in the last four years and color codes the information based on the type of sport (team sport, racket sport, winter sport, water sport, individual sport, or outdoor sport).

The sport that is growing fastest in the U.S. is pickleball, a racket sport similar to tennis that can be played both indoors and outdoors. Pickleball has seen a 171.1% increase in participation in the last four years and has an estimated 4.8 million players. It originally started in the 1960s as a children’s game but has since become very popular with adults as well. In 2022, it was named the state sport of Washington.

The second fastest-growing sport in America is alpine touring, which has increased 115% in popularity over the last four years. Alpine touring is a type of backcountry skiing that utilizes special bindings so participants can ascend hills with heels unlocked and lock heels back in to descend. This allows for mobility when climbing and safety when going downhill.

The third sport on the list is winter fat biking. This unique sport, which has increased in popularity by 69.4%, involves riding a bicycle with oversized wheels in the snow. The big wheels make it easier for riders to peddle through the slushy snow and terrain.

How many sports on this list have you played?

Continue Reading

Charts

The Most Promiscuous Countries in the World

Published

on

Wondering where in the world you’re most likely to get some action? The NapLab team created a Global Promiscuity Index that compares different factors including average number of sexual partners, STD rates, mean age when virginity was lost, and how much of the population finds premarital sex morally acceptable. See which country ranked highest!

Click below to zoom

most-promiscuous-countries-chartistry

The visualization utilizes a heat map of the world to show which countries rank highest and lowest on the list. Underneath the world map is an explanation of how the scores were calculated as well as a breakdown of all the data for each country that is included.

The country that earned the top spot on the promiscuity list is Australia, with an index score of 360.14. The mean age that Australians lost their virginity is 17.9, and the average number of sexual partners is 13.3. 81% of people think that premarital sex between adults is not a moral issue. Prostitution is also legal in the country.

Of the 45 countries included in the graphic, the country that ranks last on the list is India. The mean age when residents lose their virginity is 22.9 and the average number of sexual partners is 3. Only 21% of people in India think that premarital sex is morally acceptable.

The following are the top scores for each of the factors included in the ranking:

  • Mean Age Virginity Was Lost: Iceland (15.6 years)
  • Average Number of Sexual Partners: Turkey (14.5)
  • STD Rate Per 100,000 People: South Africa (32,054)
  • Percentage of People Who Think Premarital Sex is Morally Acceptable: France (94%)

Continue Reading

Trending