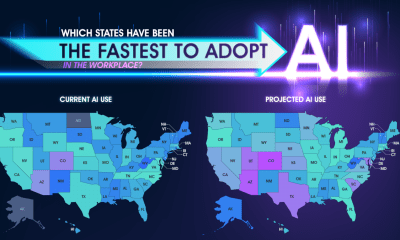
AI is spreading rapidly, especially in the workplace. According to surveys, 46% of American workers have used AI a few...


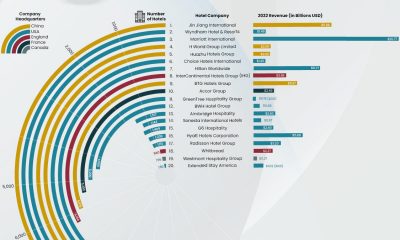

While hotel chains may have taken a hit during the COVID-19 pandemic, the hospitality as a whole is now thriving. People are more open to traveling...


Wherever ships sail, there are shipwrecks. From narrow rivers to the expanses of the Pacific Ocean, ships can wreck just about anywhere in the world. While...
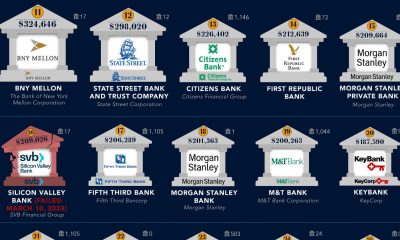

Bank bailouts have always been a contentious topic – the recent government rescue of Silicon Valley Bank and Signature Bank has added more fuel to the...


There are some cities in the United States that are known for high costs of living. San Francisco, New York City, and San Jose in particular...


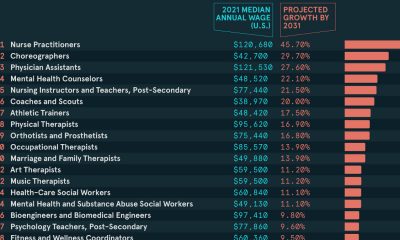
Sleep deprivation can be so harmful and distressing that it has been used as a form of torture and interrogation for centuries! Around 50 to 70...


The Star Wars universe is an ever-evolving masterpiece of imagination and storytelling. One of the most celebrated and captivating facets of the Star Wars universe is...

If you are reading this on mobile, there is a 55.79% chance that you have an iPhone in your hand right now. So, it is no...

The debut of ChatGPT has sparked a frenzy of curiosity, excitement, and concern about what artificial intelligence is capable of now and in the near future....
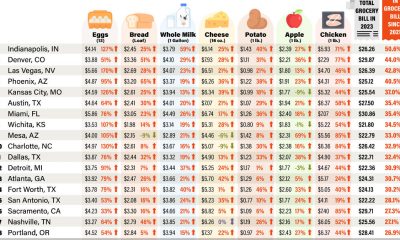

It is no secret that grocery bills have become much more painful in recent months. Post-pandemic consumer demand, ongoing supply chain shortages, unstable weather patterns, geopolitical...

I love New York City. The food, the art, the culture, the diversity, the green spaces, the architecture, the non-stop flow of work and life –...
![]()