Business Visualizations
The Best States for Small Businesses, Ranked
According to the U.S. Chamber of Commerce, the United States is home to 33.2 million small businesses. Combined, these make up 99.9% of all U.S. businesses! Here is an even more surprising fact; small businesses were responsible for 63% of all new jobs created between 1995 to 2021. We might imagine that big companies are churning out the jobs, but in reality, America is built on small companies striving to succeed! So what does it take for a small business to thrive in the United States? Many factors play a role, but as with many money matters, location is key. The team at Finfare has created this incredible index to highlight the best and worst states to start a small business. Check it out:
Click below to zoom
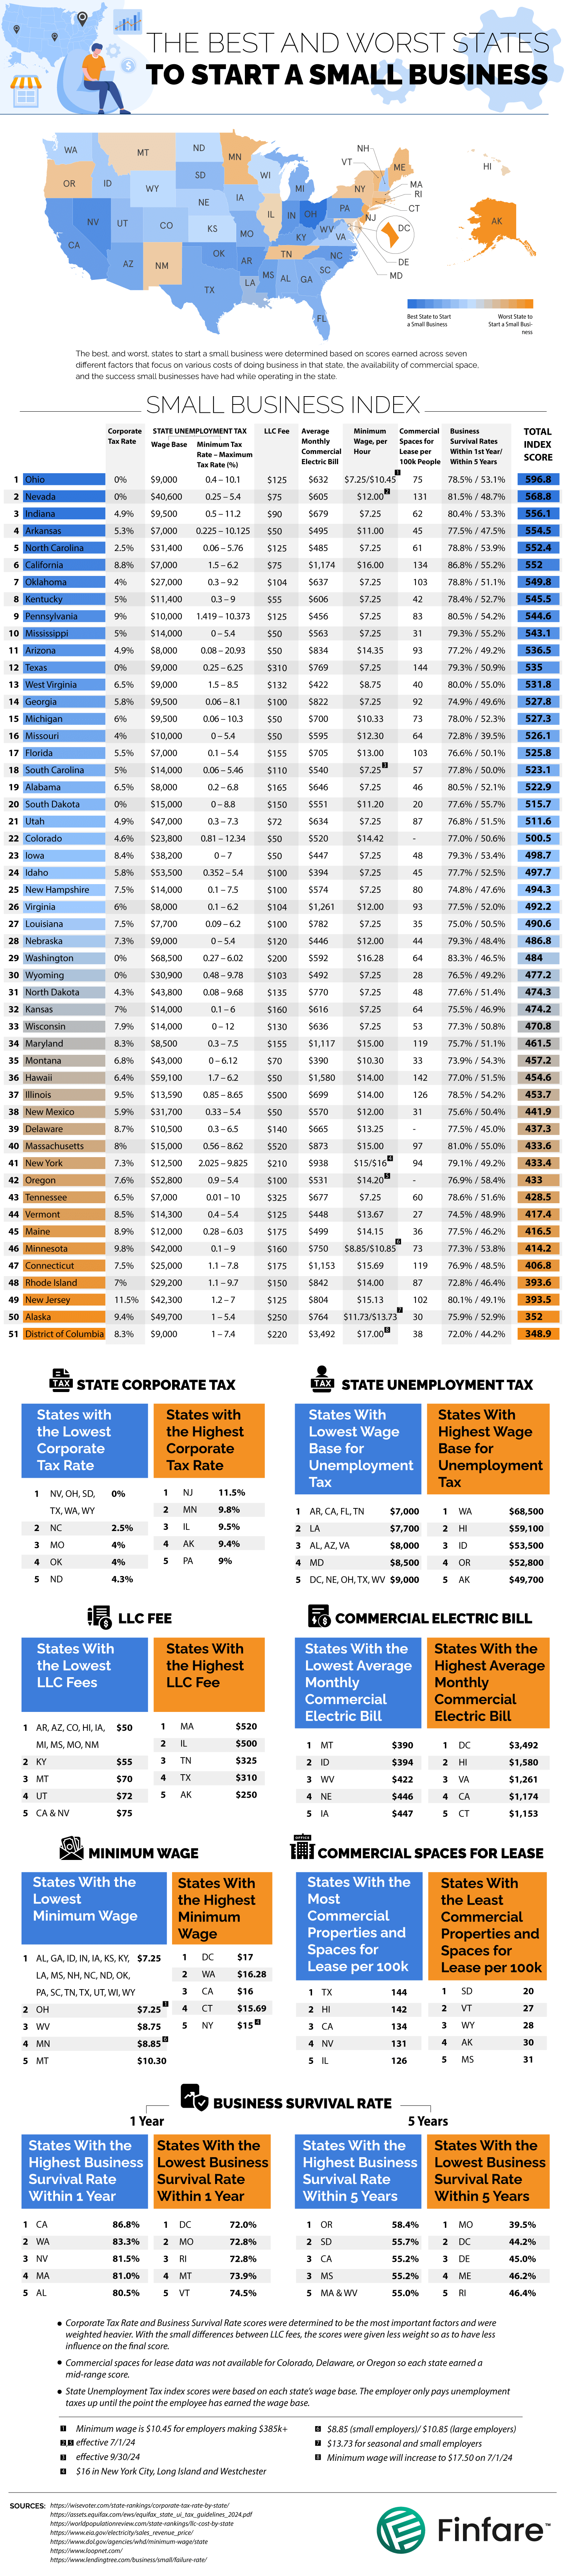
We love indexes like this! They combine multiple relevant data sets to create a bigger, more insightful picture. This index includes factors such as corporate tax rate, state unemployment tax, LLC fees, average monthly commercial electric bills, minimum wage, commercial spaces for lease, and business survival rates within one year AND five years. All together, these facets create a more trustworthy outlook on the best places for small businesses. If there is a specific factor you want to know more about, there are top five lists below the main chart. I was impressed and surprised that California has a one year business survival rate of 86.8%! I figured that there would be plenty of cutthroat competition there. It drops down to 55.7% after five years, but that is still the third highest!


Before we used banks, barcodes, or Bitcoin, humans still developed sophisticated point-of-sale systems to exchange something of value with a stranger. We’ve reinvented solutions time and again over human history, and the team at Qualtrics created a timeline that shows us the story of this history is a lot more dramatic than your tap-to-pay transaction suggests.
Trading between humans began with the exchange of goods rather than coins or paper. Livestock, pelts, and food were the stuff of life, the most valuable items we could possess. There was no central authority to set prices and values for these things, so trades were negotiated on a case-by-case basis. The first move toward abstraction came with the exchange of goods for cowry shells and tally sticks. An interesting fact: cowry shells have been found across continents, even among civilizations that never met each other.
A major currency turning point in the ancient world was Mesopotamia’s clay tokens, used to exchange for grain and to pay off debts. Ancient Egyptians expanded on this with labor tokens that existed in a tiered system as an early form of payroll. The Code of Hammurabi, from 1750 BC, established complex rules governing credit, debt, and contracts. Economic regulation is a lot older than many people may assume.
When the Silk Road opened in 138 BC, goods, currencies, and ideas traveled thousands of miles. Muslim merchants created sakk, a document that ordered banks to pay a third party, so they didn’t have to travel with heavy coins. The sakk is the direct ancestor of a check. The Song Dynasty of China created a system of paper receipts called jiaozi, which became the world’s first paper currency.
During the Industrial Revolution, James Ritty created the mechanical cash register to help secure coins and bills from untrustworthy cashiers pocketing spare change. He called the machine, “the Incorruptible Cashier.” The Diners Club card, introduced in 1950 by American Express, became the first plastic credit card. A pack of Wrigley’s Juicy Fruit gum became the first product with a barcode scanned at the checkout in 1974.
The digital age brought about the most dramatic and rapid development. In 2009, Square turned smartphones into point-of-sale registers. This dramatically lowered barriers to entry for small businesses everywhere that could process QR codes and contactless payment methods to sell goods and services. The newest advances are in the realm of biometrics. Michigan businesses started using payments triggered by eye recognition in 2023.
From clay tokens to retinal scans, we’ve come a long way in economic innovation. These advances and technologies tell the story of humans creating solutions to the problem of developing enough trust to trade with strangers. The timeline also shows us how commerce is so tightly woven into human history and development. Some may say it’s the keystone, the foundation of human civilization. This piece is an entertaining and informative visual tale of the development of money, sales, and trade.
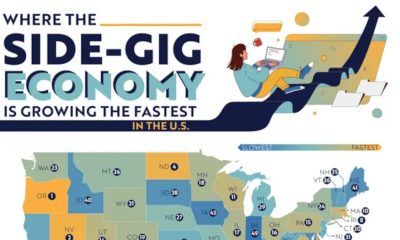
A new study by LLC Attorney examines the booming side-gig economy across the United States, identifying which states have seen the largest increases in freelance work and why. The piece introduces us to an expanding “Gig Economy” driven by apps and services like Uber, DoorDash, and Fiverr. These apps have made on-demand work accessible on a wide scale. While the side-gig economy is growing overall, the team shows that growth isn’t evenly distributed. Some states have far more gig workers than others.
Click below to zoom.
To get the data needed to create the map, the team analyzed year-over-year changes in the average monthly number of people holding a second side gig job and the growth of non-employer business establishments. Drawing on data from IPUMS CPS and the U.S. Census Bureau, the team created a color-coded map.
The top five states show us an interesting geographic picture. Oregon claimed the number one spot with a 24.2% rise in the average monthly number of people working a second gig job. Oregon has the highest number of gig workers in general. Nevada had one of the largest increases, at 25.7%, thanks to its tourism-heavy economy, which naturally generates demand for ride-sharing, Airbnb, and delivery services. Alaska takes third place, despite its smaller population. It had a 27.7% increase, while North Dakota follows in fourth with a 23.8% rise. Hawaii rounds up the top five with a huge 34.3% jump in residents working two jobs between 2022 and 2023.
These specific states lead the way because of two recurring issues. High costs of living, with rising costs of food, healthcare, and housing outpacing wage growth in these regions, lead more people to take on second jobs out of necessity. Hawaii has steep grocery and housing costs; Oregon and Nevada face similar cost-of-living issues.
These top-ranking states might appear to be thriving if we look at the Gig Economy numbers, but they have less diverse job markets, often relying on tourism. These seasonal and unpredictable jobs lead workers to seek ways to diversify their income.
The top ten states with the biggest gig economies are:
- Oregon
- Nevada
- Alaska
- North Dakota
- Hawaii
- South Carolina
- Delaware
- Rhode Island
- Virginia
- Massachusetts
Gig work can be convenient and a big asset to small business owners, but it also has downsides. Gig roles rarely include health insurance or benefits, income tends to be inconsistent, and the work is for people who don’t mind flying solo without coworker interaction. It does support independence and a flexible work schedule for people who value those qualities.
This map helps us understand the lasting changes the gig economy has had on the American economy. Side gig trends reflect how workers respond to economic changes, whether they face setbacks or opportunities. Side gigs create a fairly straightforward, low-effort way to make money, but they also drive steeper competition for jobs. Visualizing data can help us understand what drives economies and helps gig workers decide what opportunities will help them grow.
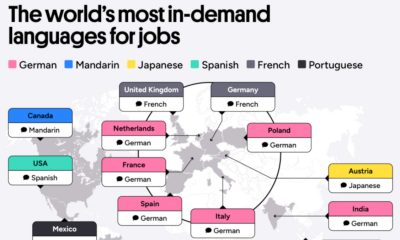
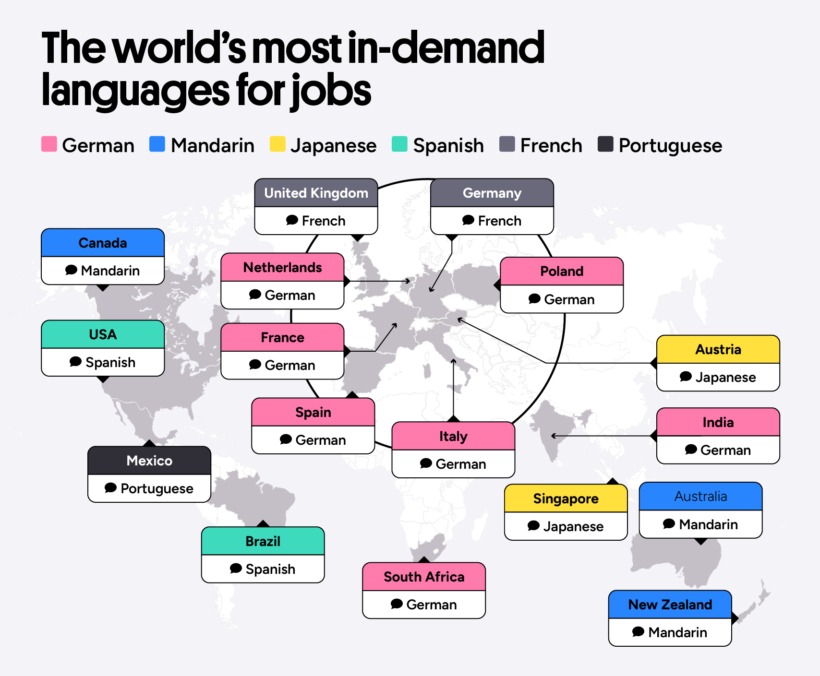
Many studies have proven the cognitive benefits of learning a second language, which is especially powerful for children. A new Preply study turns to the career world and the monetary benefits of being bilingual. After examining thousands of job advertisements, the team examined how language skills impact hiring trends, salaries, and career growth potential. Their findings help workers definitively decide whether a bilingual career is worth the study. Results show that salary gaps vary widely across countries, and some languages offer stronger benefits than others. Different industries value bilingual workers more than others too. The team’s analysis is a thorough examination of how bilingual abilities can impact a career.
Click below to zoom.
Despite variances, the Preply found that bilingual jobs do indeed pay more. The study found that bilingual workers earn an average of $9,353 more a year. In some countries, that amount is even higher, proving that a second language is one of the most valuable skills you can add to your resume.
These are the countries where speaking a second language pays the most:
- Spain – bilingual workers earn 19.4% more than single-language workers
- USA – 18.8% more
- Poland – 18.6% more
- UK – 11.5% more
- Italy – 4.8% more
- Canada – 3.3% more
Not all languages are worth the same salary increase. Research has uncovered five languages that lead to the highest salary increases. Japanese, Portuguese, Italian, German, and Russian are the most lucrative to learn. Japanese is the most valuable language to learn, giving workers a 20.9% salary increase with fluency. Japan is a world leader in engineering, technology, and the automobile industry, so Japanese fluency allows workers to communicate with these world-leading Japanese brands. The value of Portuguese lies in the many countries that speak it, including Brazil and parts of Africa. Italian fluency comes in handy, particularly in the tourism industry.
Speaking of industry differences, bilingual ability is more valued in some sectors than others. These American sectors had the highest number of job openings that required a second language:
- Sales
- Customer Service
- Social work
- Property and real estate
- Education
- Manufacturing
- Logistics
- Consulting and Strategy
- Accounting and Finance
- Healthcare and Nursing
- Marketing and PR
- Hospitality and Catering
Some of the positions this can lead to include call center reps, account managers, nurses, teachers, hotel managers, tech support experts, social workers, and salespeople.
In the USA, Spanish is the most sought-after second language. In Europe, many countries seek German and French speakers. Remember that it’s never too late to start to learn a second language. You’ll still see career benefits. While you may have to invest in hiring a tutor or start a class, this data makes it clear that this investment will pay off in the long run. Learning a second language not only enriches your life but can also open new doors and career possibilities. If you want to change careers, a second language can help you do this, and if you want to advance, a second language might be the key.
-

 Business Visualizations2 years ago
Everything Owned by Apple
-

 Business Visualizations1 year ago
America’s Most Valuable Companies Ranked by Profit per Employee
-

 Business Visualizations1 year ago
The Biggest Fortune 500 Company in Every State
-

 Business Visualizations11 months ago
The Biggest Employers by Industry
-

 Business Visualizations2 years ago
New Animated Map Shows Airbnb’s Fully Booked Cities Along the 2024 Eclipse Path of Totality
-

 Timelines1 year ago
Timeline Charts the Development of Communications Technology
-

 Charts2 years ago
How Many Crayola Crayon Colors Are There? A Lot.
-

 Business Visualizations6 months ago
The Largest Companies in America That Are Still Run by the Person Who Founded Them