
Charts
The Home Improvement Projects with the Strongest ROI

Deciding which home improvement projects are worth your time and money can yield big payoffs. Whether you think you’ll sell yourself soon or want to increase your comfort and value, you can use this new study from Ace Handyman Services to decide which projects to tackle. Their article “Which Handyman Home Improvement Projects have the Biggest ROI?” pinpoints the upgrades and repairs that will give you the greatest return on investment.
Click below to zoom.
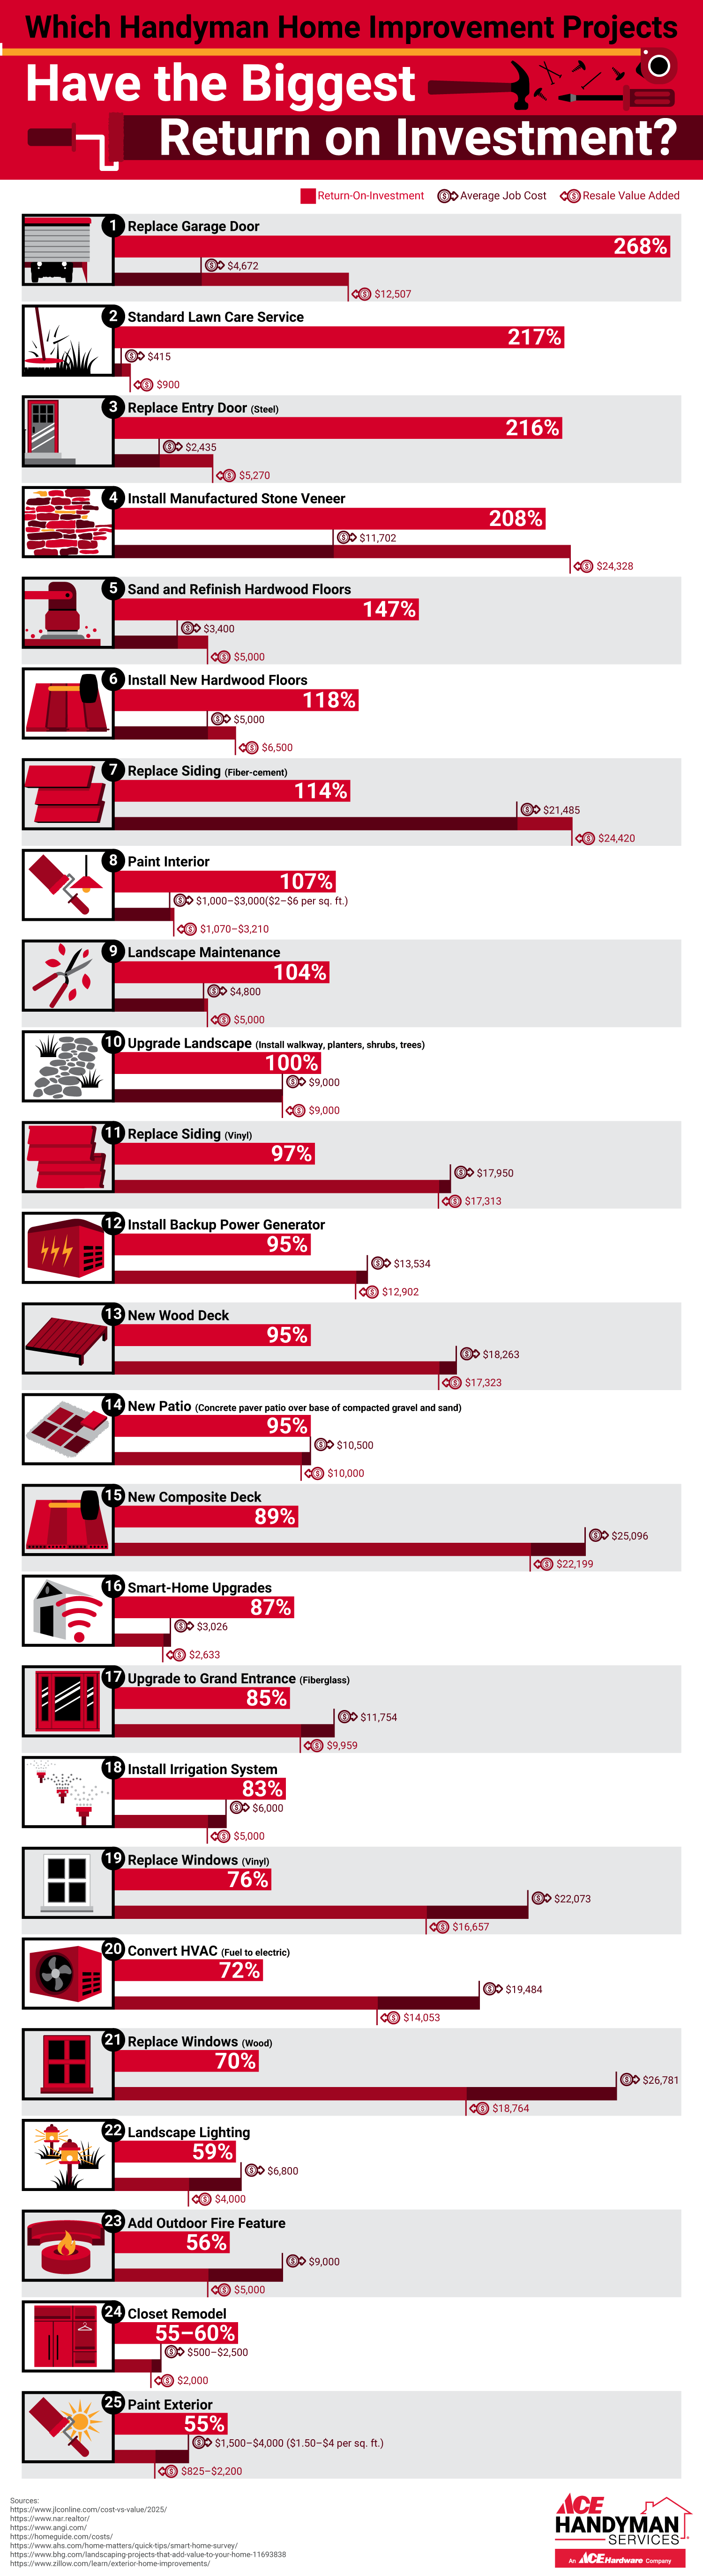
The study focuses on cost-effective projects that offer a tangible increase in home value. These projects will improve the home’s functionality and make it look more cared for. Both qualities are appealing to potential buyers. Some of the top upgrades the team lists are garage door replacement, new entry doors, refinishing floors, fixing siding, and painting the walls. Landscaping and proper lawn care also go a long way toward increasing curb appeal. Nationwide surveys show that simple cosmetic upgrades can add over 100% of the project’s cost to the home’s value. This is particularly true if you paint in neutral or modern colors.
Experts also point to kitchen and bathroom improvements as good, modest cost investments. Replacing fixtures and cabinets can make a big difference. National data points to small-scale kitchen remodels recouping 80% to 96% of their costs, which is a much better ROI than big, expensive remodeling overhauls. We see in the team’s data that flooring and exterior upgrades also have a major impact. Well-maintained and upgraded floors are often worth more than the cost to do the project. New hardwood floors or sanding and refinishing floors add around $5,000 of resale value. A lawn care service has an enormous ROI of 217%, underscoring the massive impact of curb appeal. Upgraded landscaping can add $9,000 in value, and even simple landscape lighting can add around $4,000. You could also consider adding an outdoor fire feature, which would add $5,000 in value.
Overall, these projects had the highest ROI:
- Replacing the garage door
- Standard lawn care service
- Replace the entry door
- Install manufactured stone veneer
- Sand and refinish hardwood floors
- Install new hardwood floors
- Replace siding
- Paint interior
- Landscape maintenance
- Upgrade the landscape
The biggest message the team’s study underscores is that handyman projects can outperform big remodels and renovations in terms of increased home value. These handyman-friendly projects that the average DIYer can achieve represent a balance of cost-effectiveness, value impact, and everyday comfort enhancement. Always lean toward adding visual appeal and increasing functionality when deciding on ways to improve your home. The projects on this list will help you make a more beautiful, comfortable home without breaking your back. Whether you hire a handyman service or take on the project yourself, these projects are within your grasp and will give you a solid return on the investment.

In some U.S. cities, a night out costs over twice as much as a night in, and in some locations, up to three times as much! A study from Rove Lab gathered data and compared doing the same date-night activity at home versus out across the 50 most populous U.S. cities.
Rove Lab compared the cost of two fixed dates. A night out included dinner for two at a restaurant, four beers at a pub, two five-mile taxi rides, and two movie tickets. A night in included ingredients for a home-cooked steak dinner, four store-bought beers, and a $5.99 stream rental. They used local prices from LivingCost.org and calculated a “premium for going out” in each city, which represents how much more a night out costs than a night in.
Click below to zoom.
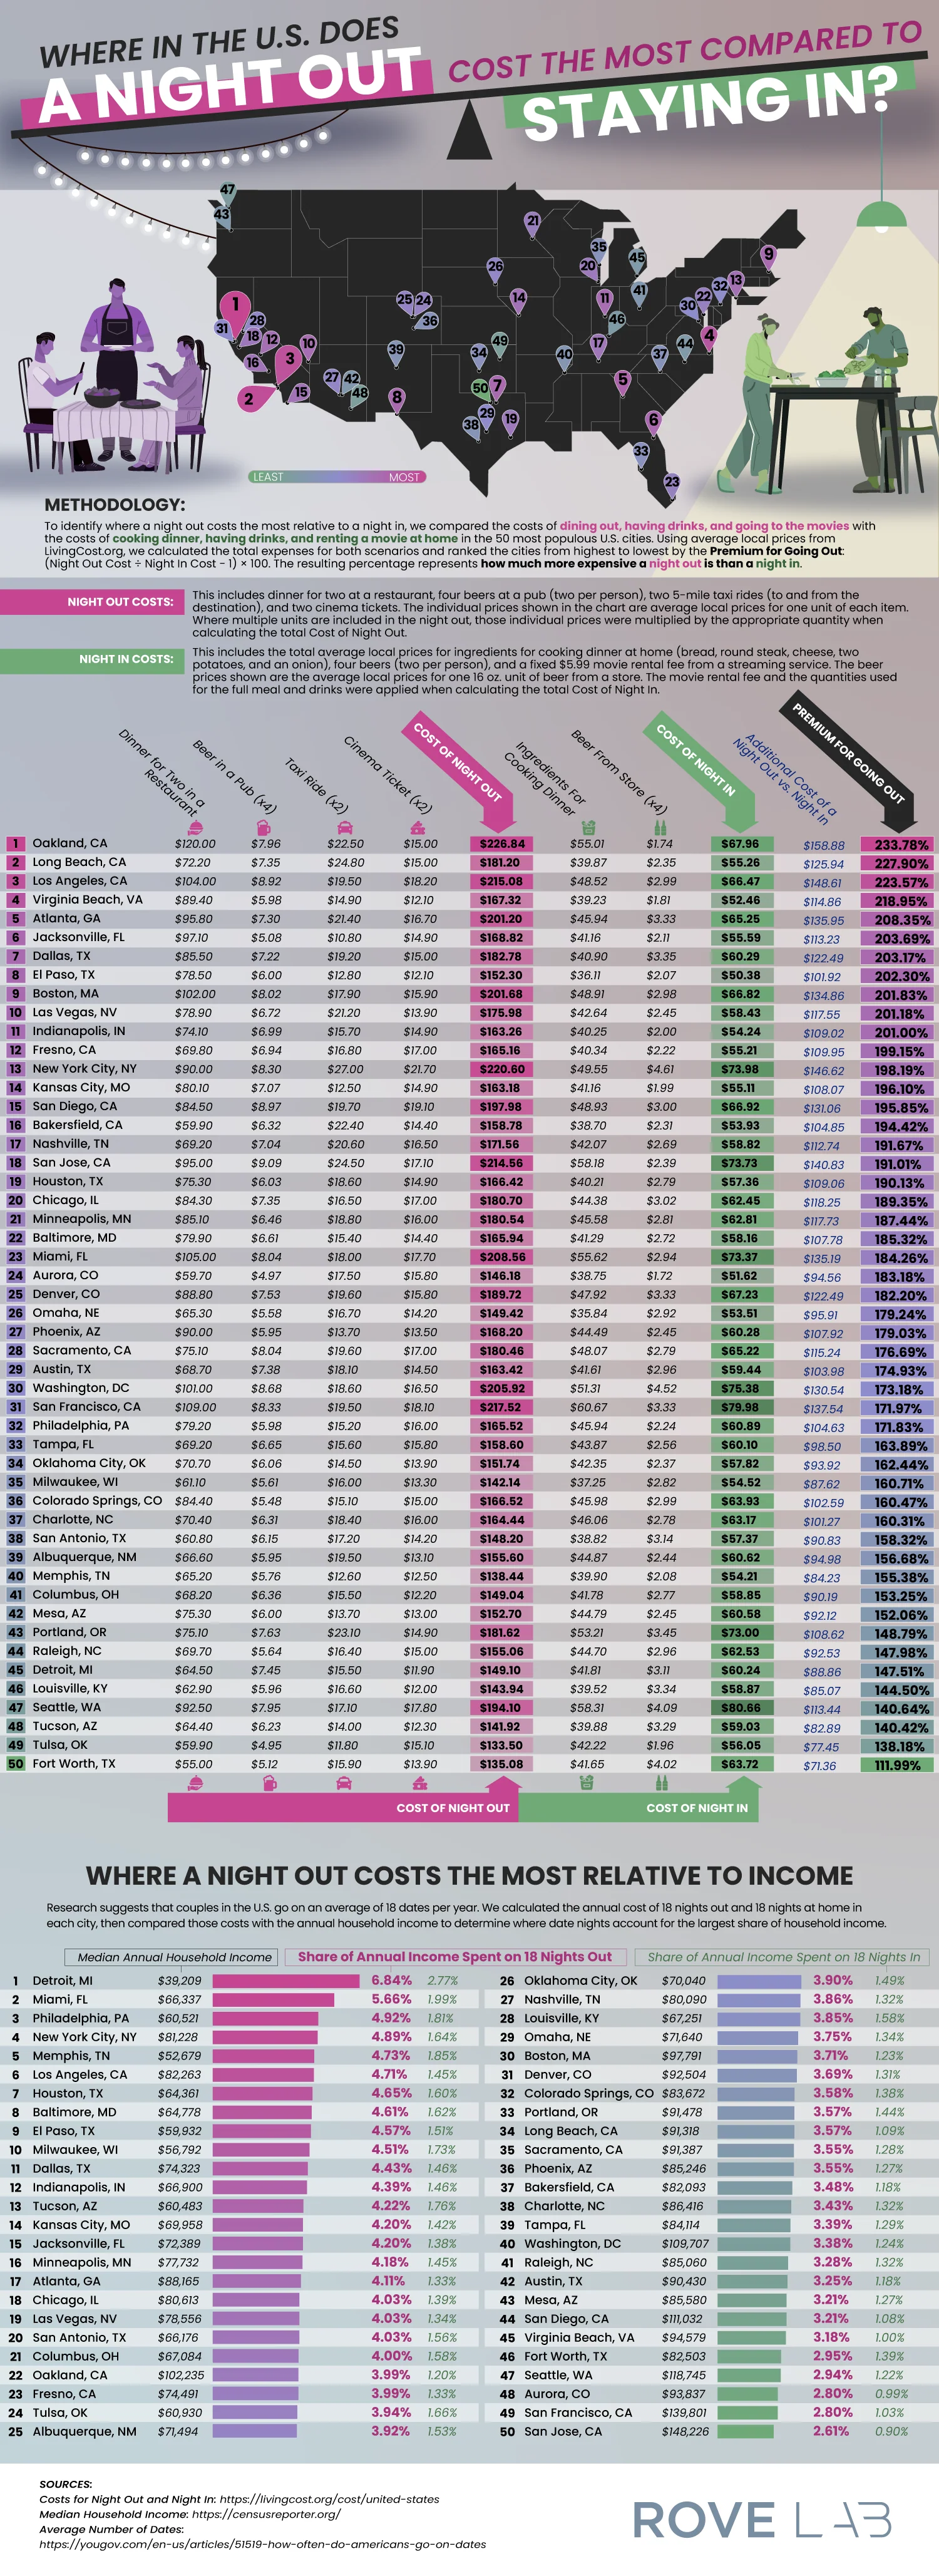
Oakland, California tops the list as the most expensive location for a date night. Dinner, drinks, a movie, and a taxi will cost $226.84 there compared to the $67.96 you’d spend on a night in. That’s a 234% premium for going out. Long Beach and Los Angeles were followed behind with premiums over 220%. Virginia Beach and Atlanta round out the top 5, and Jacksonville, Dallas, El Paso, Boston, and Las Vegas complete the top 10.
Some of the results are a little surprising. You might expect New York City to breach the top ten, and it does have the second-most expensive night out at $220.60, but it ranks only 13th because staying in is expensive there as well, so it has a lower premium. San Francisco and San Jose dropped in ranking for the same reason. At the other end of the list, Fort Worth offers the most affordable night out at a 112% premium.
Another ranking in the study might be even more revealing. Research shows U.S. couples have about 18 dates per year, so Rove Lab calculated what share of each city’s median household income goes to these dates. Detroit residents take the hardest hit. 18 nights out cost about $2,684, or 6.84% of a median income, compared with 2.77% for 18 nights in. Miami, Philadelphia, and New York City also rank highly on this metric.
San Jose is at the opposite end of the spectrum. It has one of the most expensive nights out, but high median incomes mean 18 dates take up only 2.61% of a typical household’s earnings. Local prices and incomes vary dramatically, so a city that looks expensive by one metric can look affordable based on another.
The team’s article included two full tables of data. The first lists all 50 cities with item-by-item prices, totals, the dollar difference, and the premium percentage. The second table shows each city’s median income compared to nights out vs. nights in. A summary of findings includes tips for making the most of an affordable night at home. This data might make couples think twice about how they spend their date nights and whether or not they want to adjust their budgets.

Subtitles were an accessibility feature viewers usually didn’t pay attention to unless they were hearing-impaired. These days, though, subtitles are a popular option when watching TV. Preply’s survey of 1,265 Americans found that half of them watch TV with subtitles on for reasons beyond hearing loss or watching foreign films in another language.
A Generational Trend
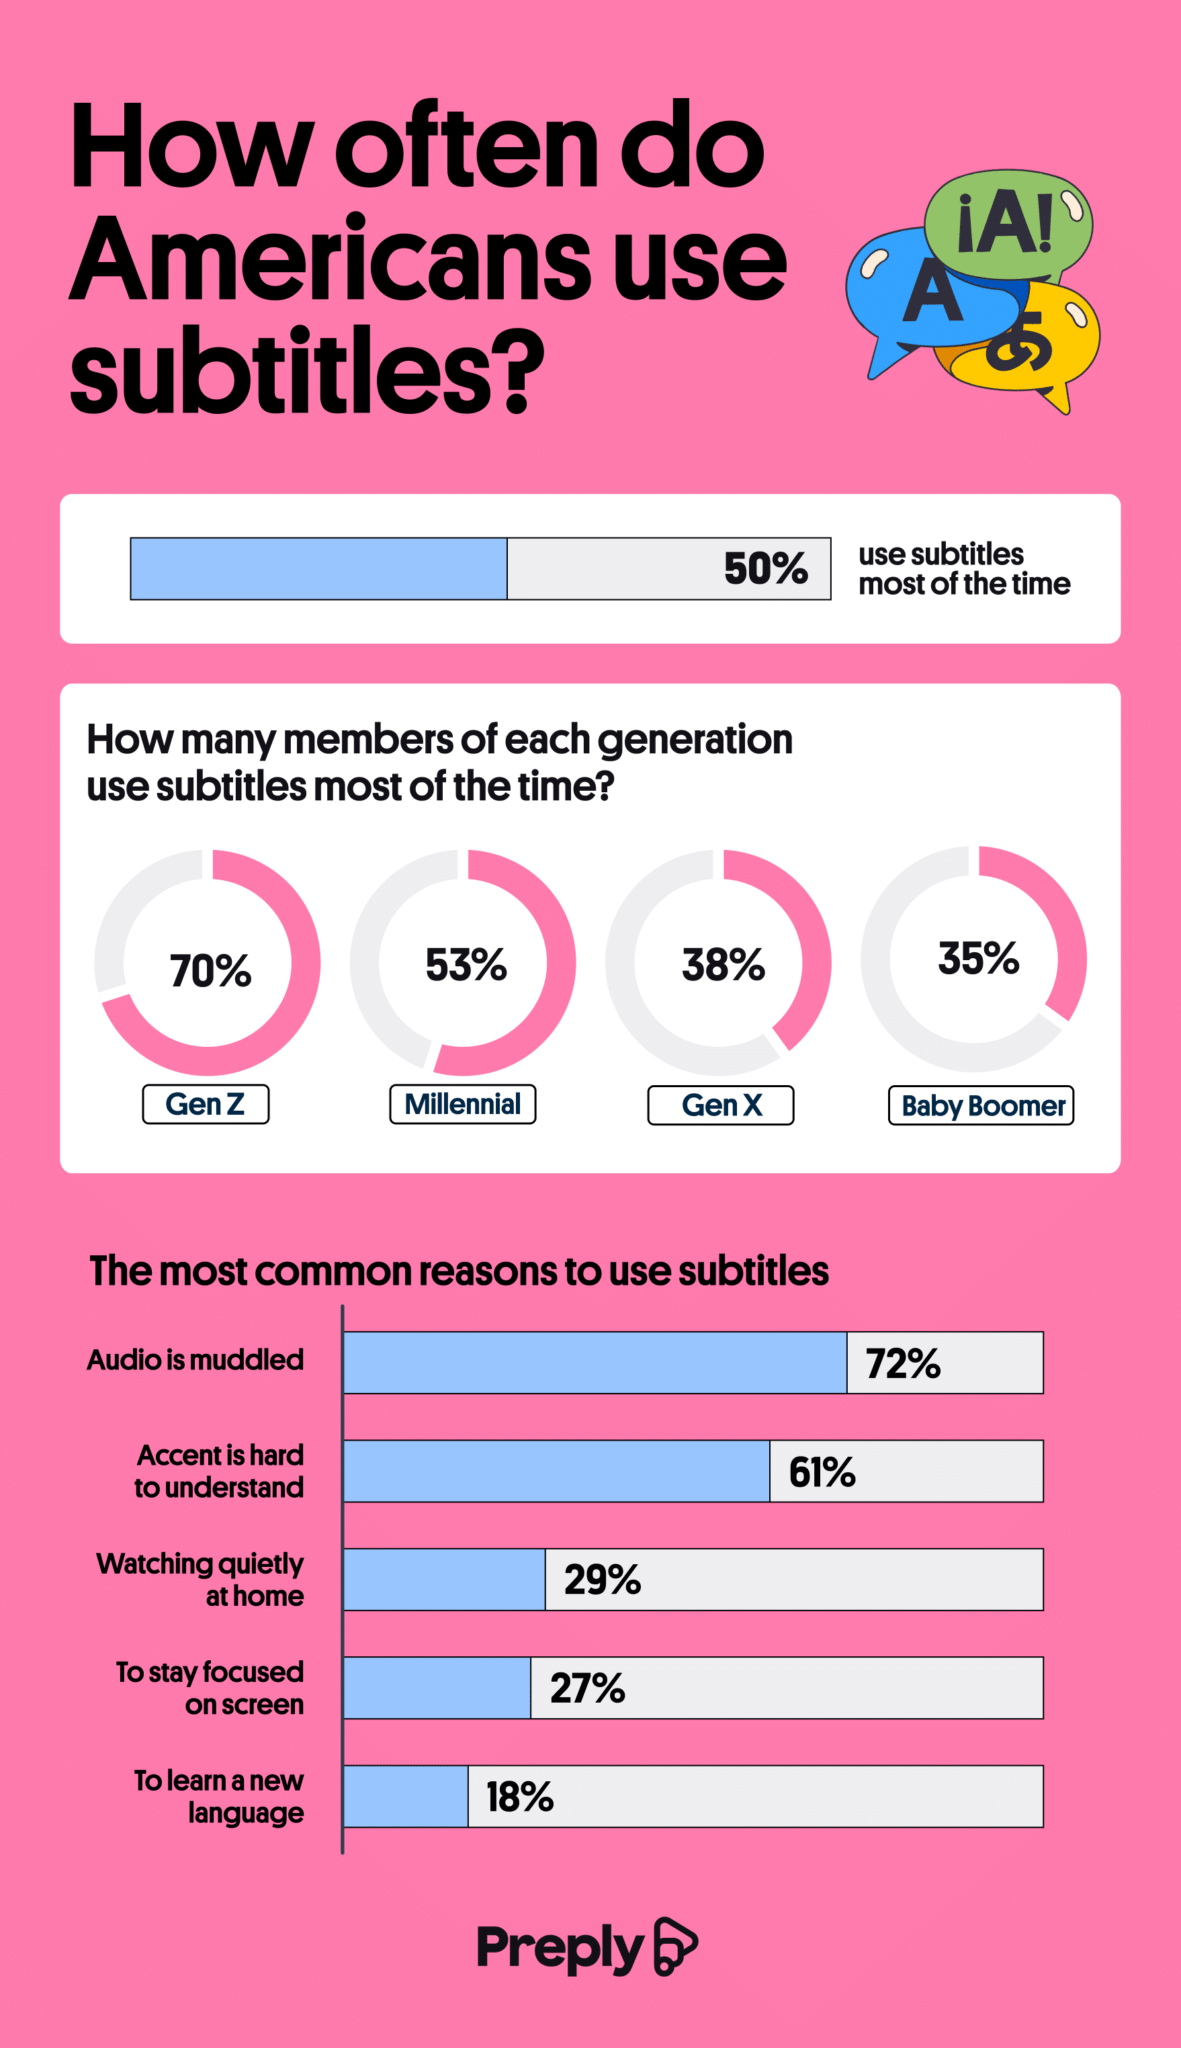
89% of the people surveyed by Preply have used subtitles at some point. Differences emerge when it comes to how often people use subtitles. Gen Z uses them the most. 70% say they have subtitles on 70% of the time, and Millennials are just above the average amount at 53%. Gen X and Baby Boomers are the least likely to use subtitles. The team graphed data on how often each generation uses subtitles.
Click below to zoom.
Sound Mixing Issues Get the Blame
The most common reason respondents said they use subtitles is muddled audio. 78% of people who use subtitles say that loud background music drowns out dialogue. 55% of people believed that dialogue is harder to hear now than it used to be. 61% of people say accents make a film more difficult to understand, so they turn on subtitles. Some people use subtitles to keep the TV volume down or to stay focused while they’re dealing with children, pets, or work.
Click below to zoom.
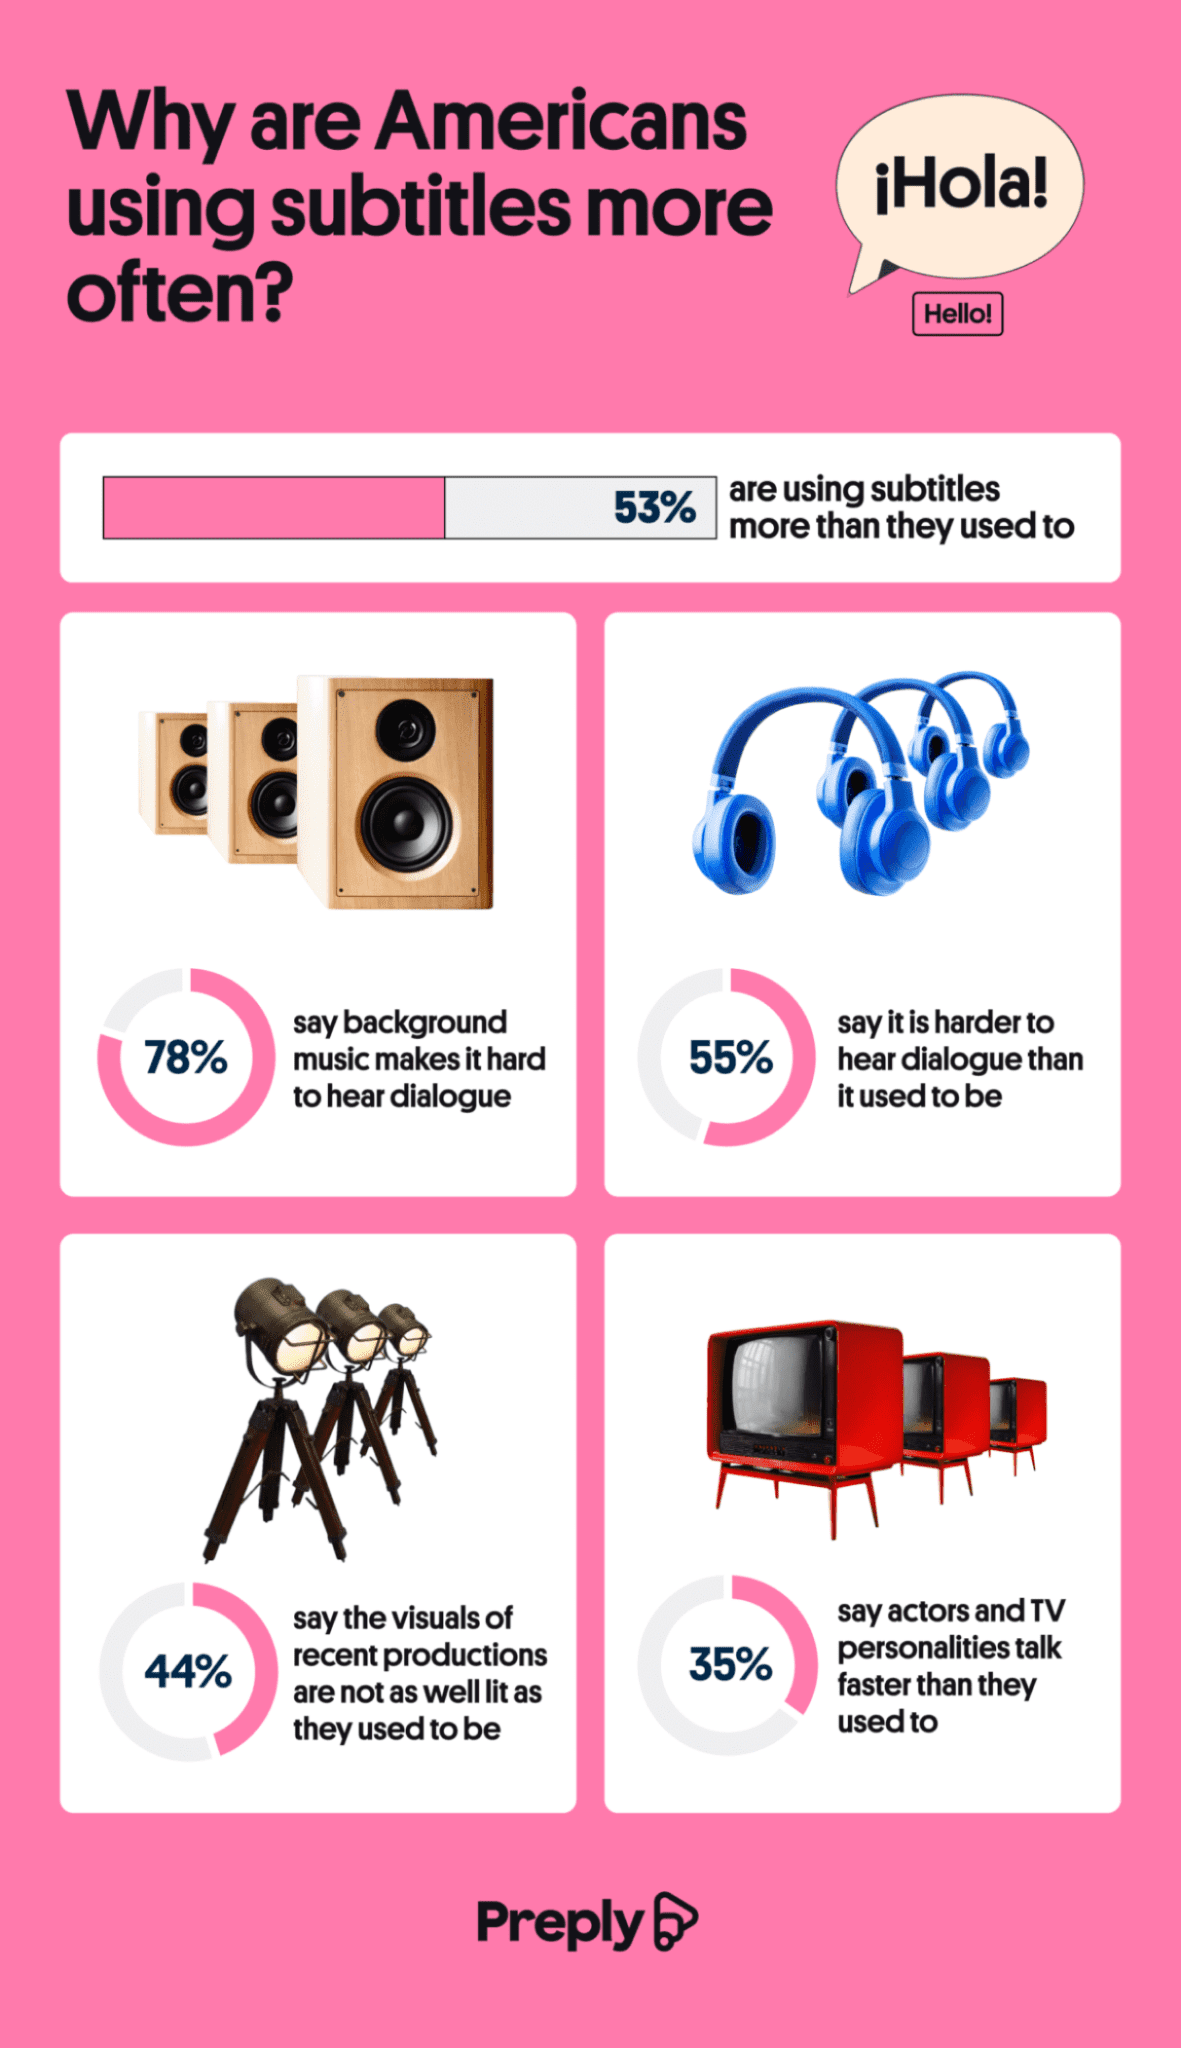
Sound-mixing complaints tie into another emerging opinion about modern television. 44% of viewers think that shows and films are shot in darker tones than in the past. They don’t like the aesthetic, and they think it’s harder to see. Another 35% of people think actors speak faster now than they used to, which also contributes to the use of subtitles.
The Most Subtitled Shows and Stars
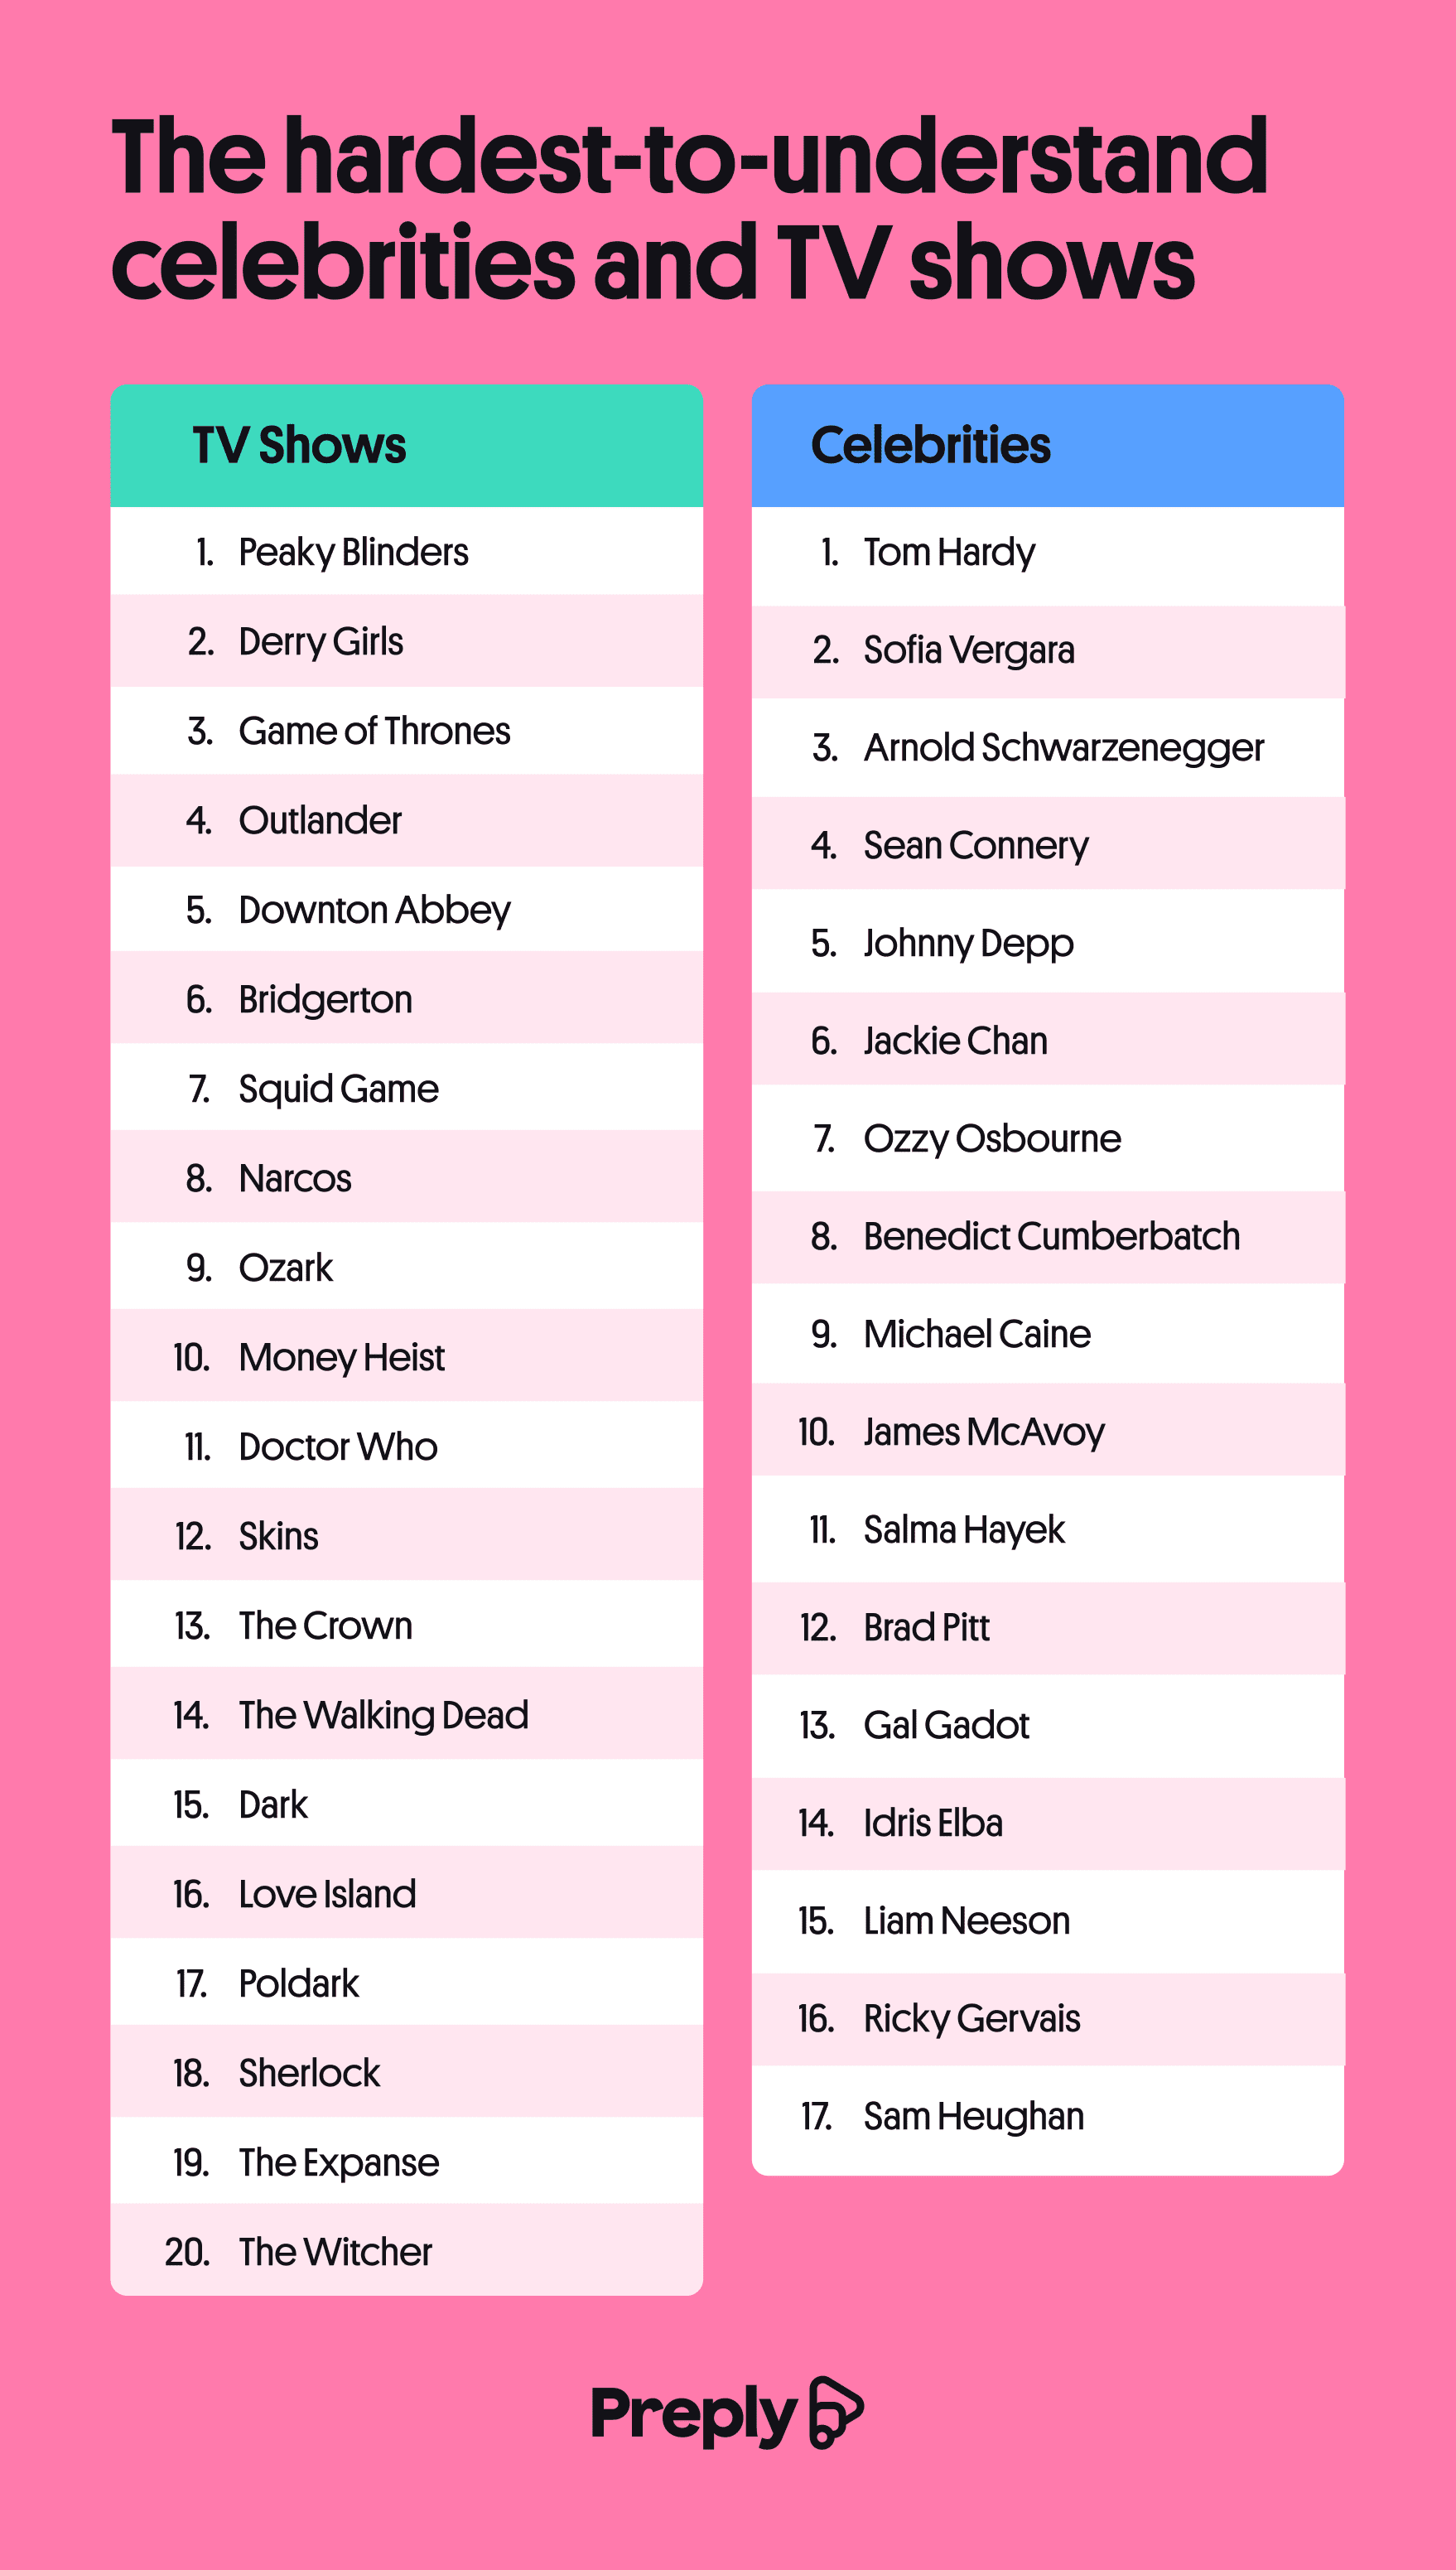
A fun section of the study delves into the shows and stars that get the subtitle treatment the most. The most subtitled shows were Peaky Blinders, Derry Girls, and Game of Thrones. Tom Hardy, Sofia Vergara, and Arnold Schwarzenegger were cited as the most difficult-to-understand celebrities. Over half of viewers say they turn on subtitles to follow dialogue with accents they find hard to understand.
Click below to zoom.
Subtitles While in Public
A big difference in TV viewing now is that many people watch on their devices while out in public. 74% of Gen Z does this, citing that they watch on public transit, at work, and even while walking and driving. Divided attention is probably part of what’s increasing the appeal of subtitles for this group. For those watching online clips on platforms like YouTube and TikTok, 41% turn on subtitles.
Foreign Films and Language Learning
62% of respondents said they use subtitles more for streaming services than regular TV channels. They said that Amazon Prime, Netflix, and Hulu have the best subtitle features. For foreign-language shows, like the popular Korean series Squid Game, 74% preferred watching in Korean with subtitles over the English dub. 26% of respondents say they use subtitles to help them learn a new language.
Translation apps promise to dissolve language barriers with a tap, turning your phone into a pocket interpreter. A new study from Preply suggests that convenience comes at a cost. After surveying 1,200 Americans who have used these tools while traveling abroad, Preply found that 57% considered the apps robotic and unnatural, leaving travelers feeling that something essential was missing from their interactions with locals.
Click below to zoom.
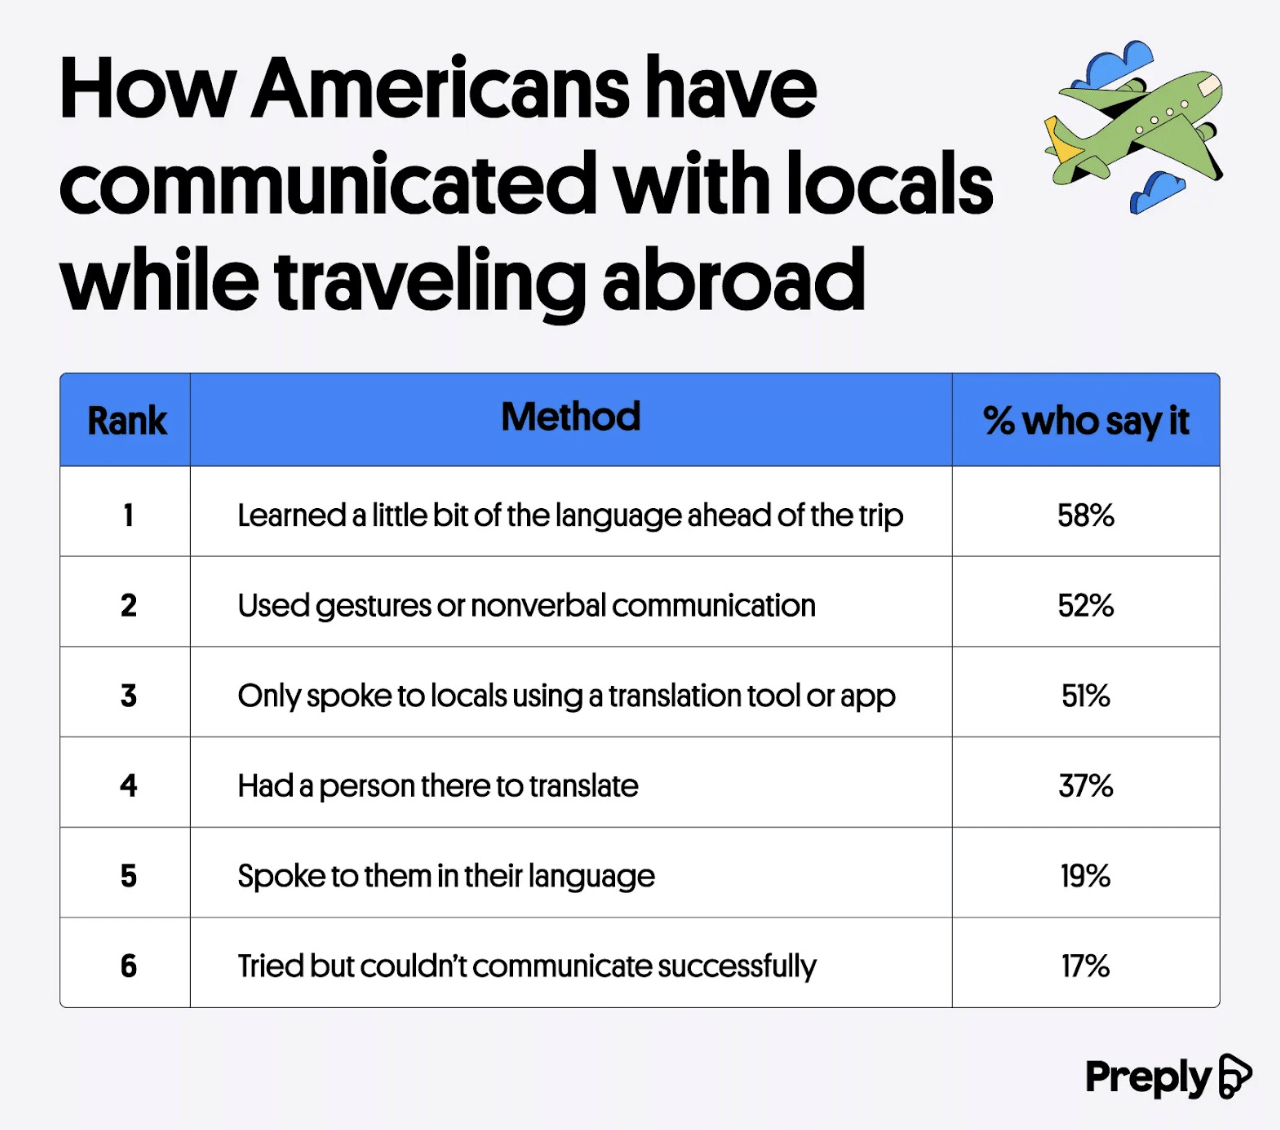 The study’s first graph breaks down how Americans usually communicate when they travel, and the most popular solution is low-tech. Nearly three in five respondents said they learned some of the local language before their trip so they could use it themselves. Gestures and pointing, along with facial expressions, were also popular when asking for food or directions. Half of respondents used a translation app or tool, while two in five used in-person translators. Almost one in five could speak the local language, either from prior knowledge or from efforts to study before the trip. 17% said they still struggled to communicate despite their best efforts.
Click below to zoom.
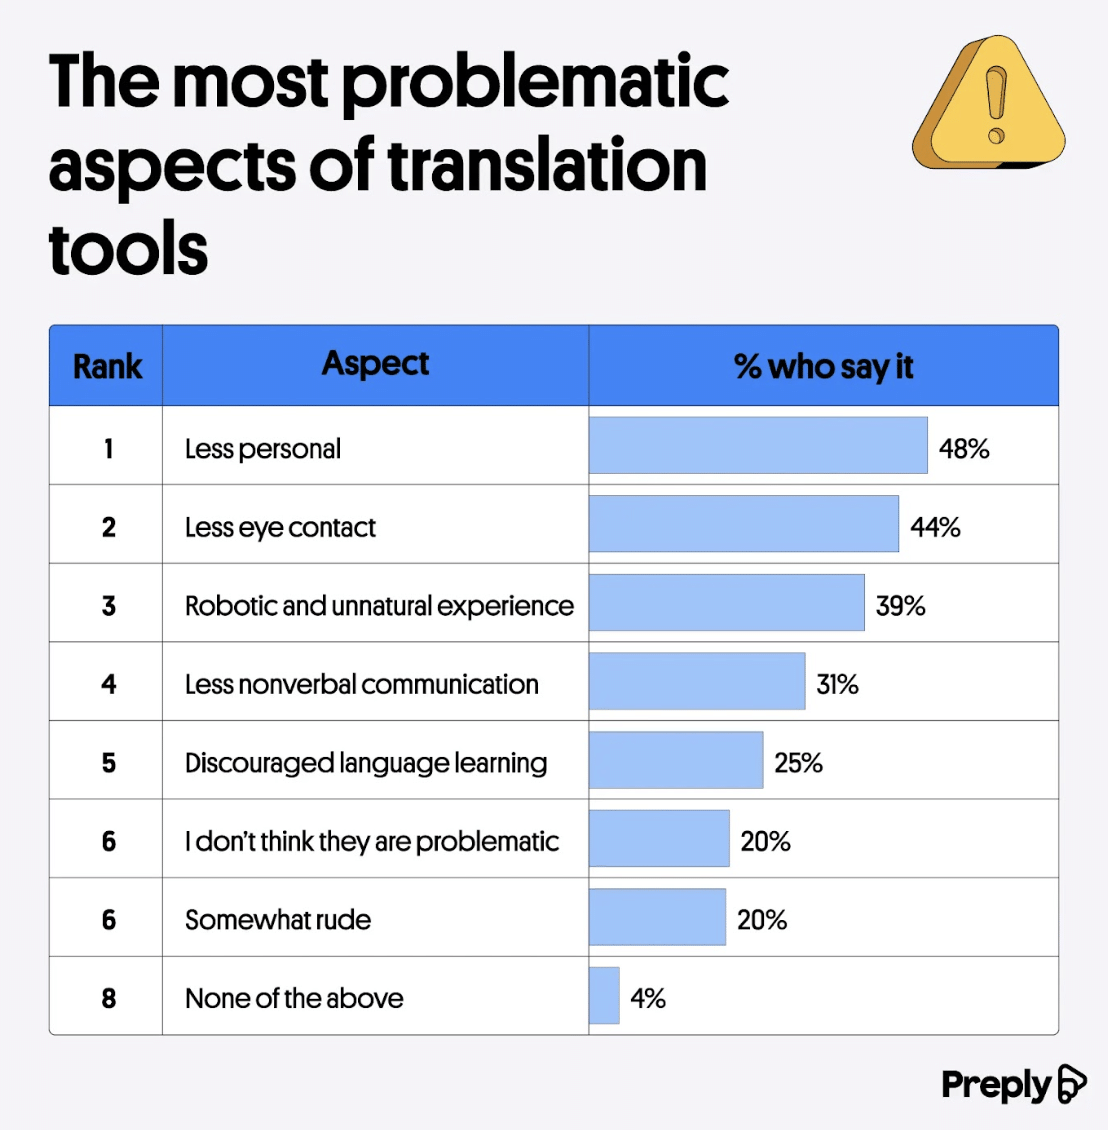 The second visual shows what travelers don’t like about translation apps. Most complaints center around human connection. Nearly half of travelers said technology made interactions less personal, and more than two in five were bothered by the lack of eye contact because the user must watch the screen. Body language and eye contact help people build rapport, but a device in the middle can disrupt this connection. One in five travelers described real-time technology as somewhat rude. A third of respondents reported an awkward moment while using the tool, and nearly one in three said the app made their trip feel less immersive.
The tools might also undercut long-term learning. More than a third of travelers felt translation technology discouraged them from learning more of the language, and 52% were frustrated that an app can’t communicate tone or cultural nuance.
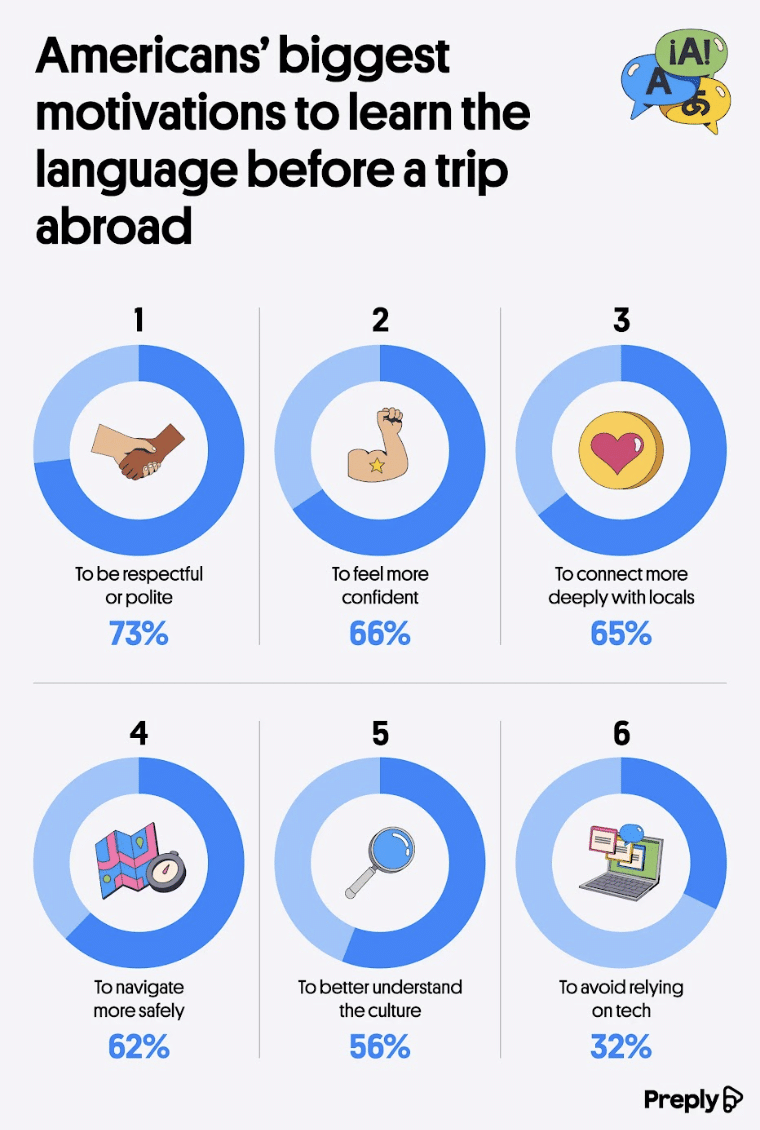
The final visual aid examines what motivates travelers to study a language before setting out on a trip. Half of Americans who traveled abroad took some kind of language class beforehand. The top reason chosen by 73% of respondents was a desire to be polite and respectful. Two-thirds wanted to feel more confident when traveling, and 65% hoped to connect more deeply with locals. Looking ahead, 65% of Americans said they want to learn more of the local language before a future trip.
That doesn’t mean travelers are abandoning their apps. More than two-fifths expect to rely on translation tools more the next time they travel. One in six plan to use these tools less.
Preply offers us a balanced conclusion. Translation apps are a remarkable technology that works best in moderation. Knowing a handful of phrases can transform a transactional exchange into a genuine moment of connection. That connection is something no app has managed to replicate.
-
 Charts2 years ago
Map Uncovers Countries with Most Powerful Passports
-
 Business Visualizations2 years ago
The Biggest Fortune 500 Company in Every State
-
 Business Visualizations2 years ago
The Biggest Employers by Industry
-
 Business Visualizations1 year ago
The Largest Companies in America That Are Still Run by the Person Who Founded Them
-
 Charts2 years ago
Study Highlights Disparity Between Homelessness Rates and Empty Housing
-

 Misc Visuals2 years ago
Exploring Science Fiction Technology That Became a Reality
-

 Charts1 year ago
New Study Reveals Details About American Intimacy
-
 Charts2 years ago
Study Determines Cities with Biggest Home Price Increases After COVID-19