Business Visualizations
The Biggest Fortune 500 Company in Every State
Every year, Fortune magazine publishes its much-anticipated Fortune 500 list. This list is meticulously analyzed by company owners, investors, and influential figures in the business world. So, what makes the Fortune 500 so significant? In this article, our team at The Chartistry provides an in-depth examination of the list, exploring why it attracts so much attention and what it takes for a company to be included.
Click below to zoom
What is the Fortune 500?
The Fortune 500 is the finance magazine’s list of the 500 most profitable companies in the United States. The company ranked at the top of the list brings in the most revenue based on its financial documents from the most recent fiscal year. The Fortune 500 list for 2024 has Walmart ranked in the top spot with revenue of $648.125B. In fact, this giant retail store has been ranked number one for the last eleven years.
What Does It Take to Make It Onto the Fortune 500?
To become a Fortune 500 company, a business must be incorporated and conduct operations in the U.S. In addition, the company’s financial documents must be public for it to be considered by Fortune.
Why Do Companies Want to Be on This List?
Fortune magazine published its first list of the top 500 U.S. companies in 1955. Since then, the presence of reputable companies such as Exxon Mobil, Goldman Sachs Group, and General Mills has given the list an air of prestige. Plus, these 500 businesses bring in incredible amounts of revenue and contribute to the strength of our economy. Wouldn’t you want your company to appear on a list alongside Walmart, Amazon, and Berkshire Hathaway?
Have Any Companies Appeared on the Fortune 500 for Decades?
Yes, some companies have made repeated appearances. Some famous names have been on the list every year since 1955, including Kellogg, Chevron, and Exxon Mobil, to name a few.
Fortune 500 Companies by State
Walmart, the number one ranked company on the Fortune 500, is located in Arkansas, with its headquarters in Bentonville. Fortune’s number two company, Amazon, is the biggest in Washington, with its headquarters in Seattle. Exxon Mobil is the biggest Fortune 500 company in Texas, and it does business out of Houston.
An interesting thing to note about this list is that not all 50 states are home to a Fortune 500 company. The states without one include:
- Alaska
- Hawaii
- Maine
- Mississippi
- Montana
- New Hampshire
- New Mexico
- North Dakota
- South Dakota
- Utah
- Vermont
- West Virginia
- Wyoming
The Largest Fortune 500 Company Headquartered in Each State
| State | Biggest Fortune 500 Company |
Location of Headquarters |
Fortune 500 Rank (2023) |
2023 Revenue (in millions) |
Percent Change in Revenue From 2022 |
| Alabama | Regions Financial | Birmingham, AL |
483 |
$7,531 |
14% |
| Alaska | N/A | N/A | N/A | N/A | N/A |
| Arizona | Avnet | Phoenix, AZ |
163 |
$24,311 |
24.4% |
| Arkansas | Walmart | Bentonville, AR |
1 |
$611,289 |
6.7% |
| California | Apple | Cupertino, CA |
4 |
$394,328 |
7.8% |
| Colorado | Arrow Electronics | Centennial, CO |
109 |
$37,124 |
7.7% |
| Connecticut | Cigna Group | Bloomfield, CT |
15 |
$180,516 |
3.7% |
| Delaware | DuPont | Wilmington, DE |
250 |
$16,549 |
-3.6% |
| District of Columbia | Fannie Mae | Washington, D.C. |
28 |
$121,596 |
19.7% |
| Florida | World Kinect | Miami, FL |
70 |
$59,043 |
88.4% |
| Georgia | Home Depot | Atlanta, GA |
20 |
$157,403 |
4.1% |
| Hawaii | N/A | N/A | N/A | N/A | N/A |
| Idaho | Albertsons | Boise, ID |
53 |
$71,887 |
3.2% |
| Illinois | Walgreens Boots Alliance | Deerfield, IL |
27 |
$132,703 |
-10.7% |
| Indiana | Elevance Health | Indianapolis, IN |
22 |
$156,595 |
13% |
| Iowa | Principal Financial | Des Moines, IA |
236 |
$17,492 |
22.6% |
| Kansas | Seaboard | Merriam, KS |
364 |
$11,243 |
21.8% |
| Kentucky | Humana | Louisville, KY |
42 |
$92,870 |
11.8% |
| Louisiana | Lumen Technologies | Monroe, LA |
237 |
$17,478 |
-11.2% |
| Maine | N/A | N/A | N/A | N/A | N/A |
| Maryland | Lockheed Martin | Bethesda, MD |
60 |
$65,984 |
-1.6% |
| Massachusetts | General Electric | Boston, MA |
52 |
$76,555 |
3.2% |
| Michigan | Ford Motor | Dearborn, MI |
19 |
$158,057 |
15.9% |
| Minnesota | UnitedHealth Group | Minnetonka, MN |
5 |
$324,162 |
12.7% |
| Mississippi | N/A | N/A | N/A | N/A | N/A |
| Missouri | Centene | St. Louis, MO |
25 |
$144,547 |
14.7% |
| Montana | N/A | N/A | N/A | N/A | N/A |
| Nebraska | Berkshire Hathaway | Omaha, NE |
7 |
$302,089 |
9.4% |
| Nevada | MGM Resorts International | Las Vegas, NV |
315 |
$13,128 |
35.6% |
| New Hampshire | N/A | N/A | N/A | N/A | N/A |
| New Jersey | Johnson & Johnson | New Brunswick, NJ |
40 |
$94,943 |
1.2% |
| New Mexico | N/A | N/A | N/A | N/A | N/A |
| New York | JPMorgan Chase | New York, NY |
23 |
$154,792 |
21.7% |
| North Carolina | Bank of America | Charlotte, NC |
32 |
$115,053 |
22.6% |
| North Dakota | N/A | N/A | N/A | N/A | N/A |
| Ohio | Cardinal Health | Dublin, OH |
14 |
$181,364 |
11.6% |
| Oklahoma | Oneok | Tulsa, OK |
173 |
$22,387 |
35.3% |
| Oregon | Nike | Beaverton, OR |
93 |
$46,710 |
4.9% |
| Pennsylvania | Cencora | Conshohocken, PA |
11 |
$238,587 |
11.5% |
| Rhode Island | CVS Health | Woonsocket, RI |
6 |
$322,467 |
10.4% |
| South Carolina | Sonoco Products | Hartsville, SC |
498 |
$7,251 |
29.7% |
| South Dakota | N/A | N/A | N/A | N/A | N/A |
| Tennessee | FedEx | Memphis, TN |
41 |
$93,512 |
11.4% |
| Texas | Exxon Mobil | Houston, TX |
3 |
$413,680 |
44.8% |
| Utah | N/A | N/A | N/A | N/A | N/A |
| Vermont | N/A | N/A | N/A | N/A | N/A |
| Virginia | Freddie Mac | McLean, VA |
45 |
$86,717 |
31.6% |
| Washington | Amazon | Seattle, WA |
2 |
$513,983 |
9.4% |
| West Virginia | N/A | N/A | N/A | N/A | N/A |
| Wisconsin | Northwestern Mutual | Milwaukee, WI |
111 |
$36,921 |
0.5% |
| Wyoming | N/A | N/A | N/A | N/A | N/A |
Do Some States Have More Than One Fortune 500 Company?
Yes, several states have multiple companies on the list. Texas leads with 55 companies on the Fortune 500, followed by California with 52 and New York with 50. These states all boast a large population and bustling metropolitan areas.
Do Some States Have Just One Fortune 500 Company?
Yes, some states on the list are home to just one. These states include Delaware, Kansas, Kentucky, and South Carolina. In terms of total population, each of these states ranks in the lower half on the list of 50. Delaware has the lowest population, with 1,044,320 people in 2024.
Are Some Cities Home to More Than One Fortune 500 Company?
Absolutely! In fact, some cities serve as the home base for multiple Fortune 500 companies. Some notable examples include:
Chicago
Illinois has 33 Fortune 500 companies, including Walgreens, McDonald’s, and United Airlines, among others. Dozens of these companies are headquartered in the Chicago area.
Houston
Of the 55 Fortune 500 companies in Texas, Houston is home to 21. Exxon Mobil, Sysco, and Hewlett Packard Enterprise (HPE) are just a few of the impressive companies in the collection.
Atlanta
According to our chart, the biggest Fortune 500 company in Georgia is Home Depot, ranked at number 20. But Home Depot is not alone. There are 18 Fortune 500 companies in Atlanta, including Aflac, Delta Air Lines Inc., The Coca-Cola Company, UPS, and others.
Make sure to explore our other lists and visuals, which provide insight into the world of big business. One list ranks companies by employee profits (which happens to be one of our original visualizations), while another categorizes the most profitable companies by industry. It’s no surprise that many Fortune 500 companies frequently appear on various lists throughout the year, highlighting their achievements.
The Number of Fortune 500 Companies in Each State
| State | State Abbreviation | Number of Fortune 500 Companies in Each State |
| Texas | TX |
55 |
| California | CA |
52 |
| New York | NY |
50 |
| Illinois | IL |
33 |
| Ohio | OH |
24 |
| Virginia | VA |
24 |
| Florida | FL |
23 |
| Pennsylvania | PA |
23 |
| Georgia | GA |
19 |
| Michigan | MI |
18 |
| Massachusetts | MA |
17 |
| Minnesota | MN |
15 |
| Connecticut | CT |
14 |
| New Jersey | NJ |
14 |
| North Carolina | NC |
13 |
| Washington | WA |
12 |
| Arizona | AZ |
10 |
| Colorado | CO |
10 |
| Tennessee | TN |
10 |
| Missouri | MO |
8 |
| Wisconsin | WI |
8 |
| Indiana | IN |
7 |
| Oklahoma | OK |
6 |
| Arkansas | AR |
4 |
| Nebraska | NE |
4 |
| Rhode Island | RI |
4 |
| Idaho | ID |
3 |
| Maryland | MD |
3 |
| Alabama | AL |
2 |
| District of Columbia | DC |
2 |
| Iowa | IA |
2 |
| Louisiana | LA |
2 |
| Nevada | NV |
2 |
| Oregon | OR |
2 |
| Delaware | DE |
1 |
| Kansas | KS |
1 |
| Kentucky | KY |
1 |
| South Carolina | SC |
1 |
| Alaska | AK |
0 |
| Hawaii | HI |
0 |
| Maine | ME |
0 |
| Mississippi | MS |
0 |
| Montana | MT |
0 |
| New Hampshire | NH |
0 |
| New Mexico | NM |
0 |
| North Dakota | ND |
0 |
| South Dakota | SD |
0 |
| Utah | UT |
0 |
| Vermont | VT |
0 |
| West Virginia | WV |
0 |
| Wyoming | WY |
0 |
Source:


Letting an employee go is an unpleasant experience for everyone involved, but language has the power to guide the emotions surrounding an interaction. While the right words won’t erase the bad side of being let go, they can help the employee in question understand why the situation is happening and make them feel seen and heard. Preply leaned into the language aspects in these situations with a study examining the most common phrases and words used when letting an employee go and how employers and employees felt about the situation.
Click below to zoom.
Overall, the team found that these were the most common phrases used:
- Letting you go
- Effective immediately
- Terminating your employment
- This isn’t working out
- No longer require services
- Parting ways
- Ending your employment
- No longer needed
- Relieved of duties
- Ending our working relationship
Managers and employees seem to agree that lack of empathy and responsibility were the most common complaints about the process. One in six managers say they regret the words they chose when firing someone, and 92% feel they need more training on how to handle such situations. Employees wanted their managers to focus on clarity, compassion, empathy, and honesty when firing an employee.
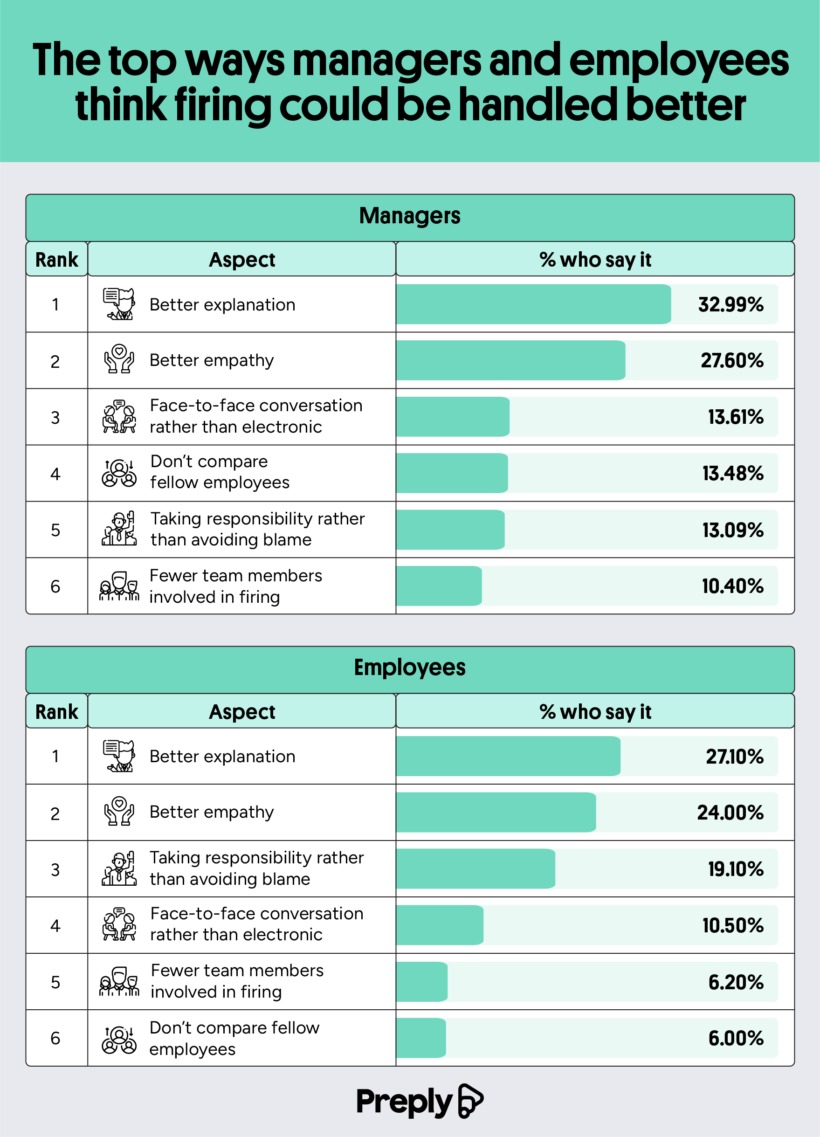
The team studied changes that both managers and employees would like to see in the firing process.
These are the six things employees want to see improved:
- Better explanation
- Better empathy
- Taking responsibility rather than avoiding blame
- Face-to-face conversation rather than electronic
- Fewer team members involved in the firing
- Don’t compare fellow employees
Here’s how that compares to changes managers would like to make to the process:
- Better explanation
- Better empathy
- Face-to-face conversation rather than electronic
- Don’t compare fellow employees
- Taking responsibility rather than avoiding blame
- Fewer team members involved in firing
These are similar answers, but we can see that the two groups ranked their importance differently. Overall, 92% of Americans think managers could benefit from some language training when it comes to firing someone. Empathy and honesty were high on the list of employee wishes, indicating that understanding can help give them closure on the job, and empathy softens the blow. Not many managers would prefer a face-to-face meeting. Only 1 in 6 prefer this to virtual meetings, which seem to be the most common option.
Only 55% of managers have received training on how to fire someone, and with many of them regretting their language choices, it seems that many managers would benefit from some education in business language and communication. Notice that many of the top phrases are more professional ways to say “fired,” like “letting you go,” “terminating,” and “no longer require.”
When managing a team, empathy and clear language are crucial. These skills can help managers excel at many tasks beyond having to let an employee go. But when a situation like firing someone is emotionally charged, the language used becomes more important than ever. Hopefully, the team’s study can help managers reflect on how they go about the process.
Over 1,000 Americans responded to a survey from the Preply team that studied how Americans communicate when they quit their jobs. In 2025, over 3 million Americans quit their jobs, clearly indicating resigning is a common occurrence. But this study reveals that people have different approaches to quitting, as well as some commonalities. The team’s analysis encompasses the methods used to resign as well as the tone, language, and feelings surrounding the resignation.
Click below to zoom.
Most Americans reported a verbal resignation. 76% of the survey responders used this direct and personal approach to quit their jobs, while only 9% gave a handwritten notice of resignation. That’s surprisingly fewer than the number who “ghosted” their employer at 19%. Around 10% of workers quit via text, leading to 43% reporting that their resignation only lasted a few minutes. Quitting can be awkward and uncomfortable, so it makes sense that people want to get the conversation over with. Those who quit in letter or text said they sent “just a few words.”
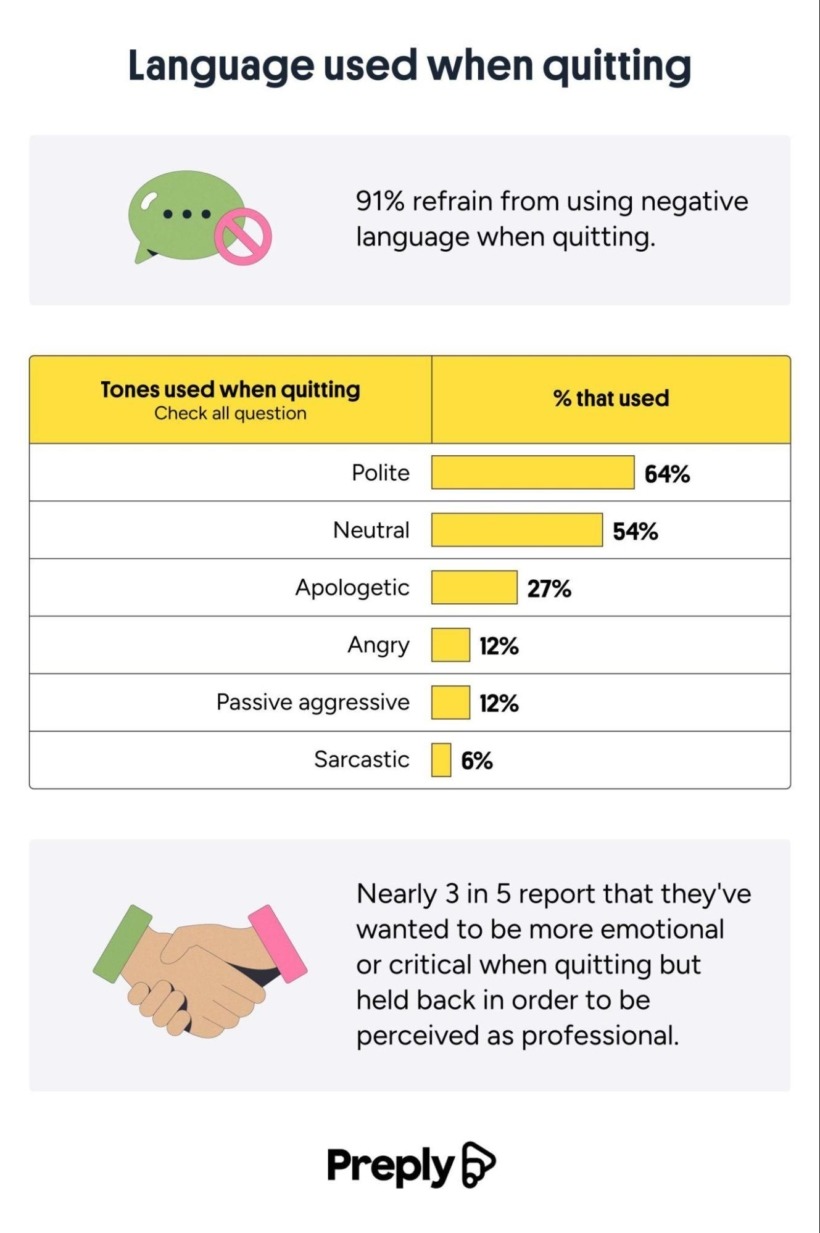
The next aspect the team considered was the tone and language used in the resignation. Naturally, many employees would want to avoid burning bridges when they quit. 91% of employees said they avoided using negative or critical language when resigning. 64% said they were conscious of using a polite tone, and 27% went as far as using apologetic tones and words. 60% of employees had to suppress their negative emotions and refrained from stating the critical reasons that led to their resignation.
There were some differences among ages and genders as well. Gen Z was the most restrained when resigning, with 61% stating that they held back emotions during the process. Boomers and Gen X were similar at 59% and 58% respectively. Millennials held back the least at 57%. As for gender, 63% of women said they suppressed their emotions and 53% of men reported the same. The team found that when employers offered exit interviews, 40% of workers felt more comfortable expressing their honest experiences at the company, which is important for companies that take worker experience and company culture seriously.
Most people said they avoided language, but here’s the specific breakdown of the tones they used when they quit:
- Polite – 64%
- Neutral – 54%
- Apologetic – 27%
- Angry – 12%
- Passive-aggressive – 12%
- Sarcastic – 6%
While people may hold back their negative feelings when resigning, that doesn’t mean these employees are above cutthroat tactics. One in eight people said they chose to resign at a time when they knew it would cause the most disruption and harm at work. Gen Z was the most likely to do this, and men were more likely than women. One in ten left negative or scathing reviews of their former company on sites like Glassdoor. Healthcare workers were the most likely to do this. These reviews often included negative words like “disorganized”, “stressful”, and “frustrating.” These written reviews often express things employers weren’t comfortable saying in person.
The trends and findings in this study provide a well-rounded look at a common experience, revealing surprising similarities among people in very different situations.
The team at LLC Attorney analyzed business and economic trends to determine which products consumers will spend the most on over the next five years. Analysts invest a lot of effort into predicting spending trends to get ahead of the curve. Consumers can benefit from this data by using it to guide savings and create a budget. The team used their data to identify the individual categories that might see the highest spending and then determined how much prices may increase for products in these categories.
Click below to zoom.
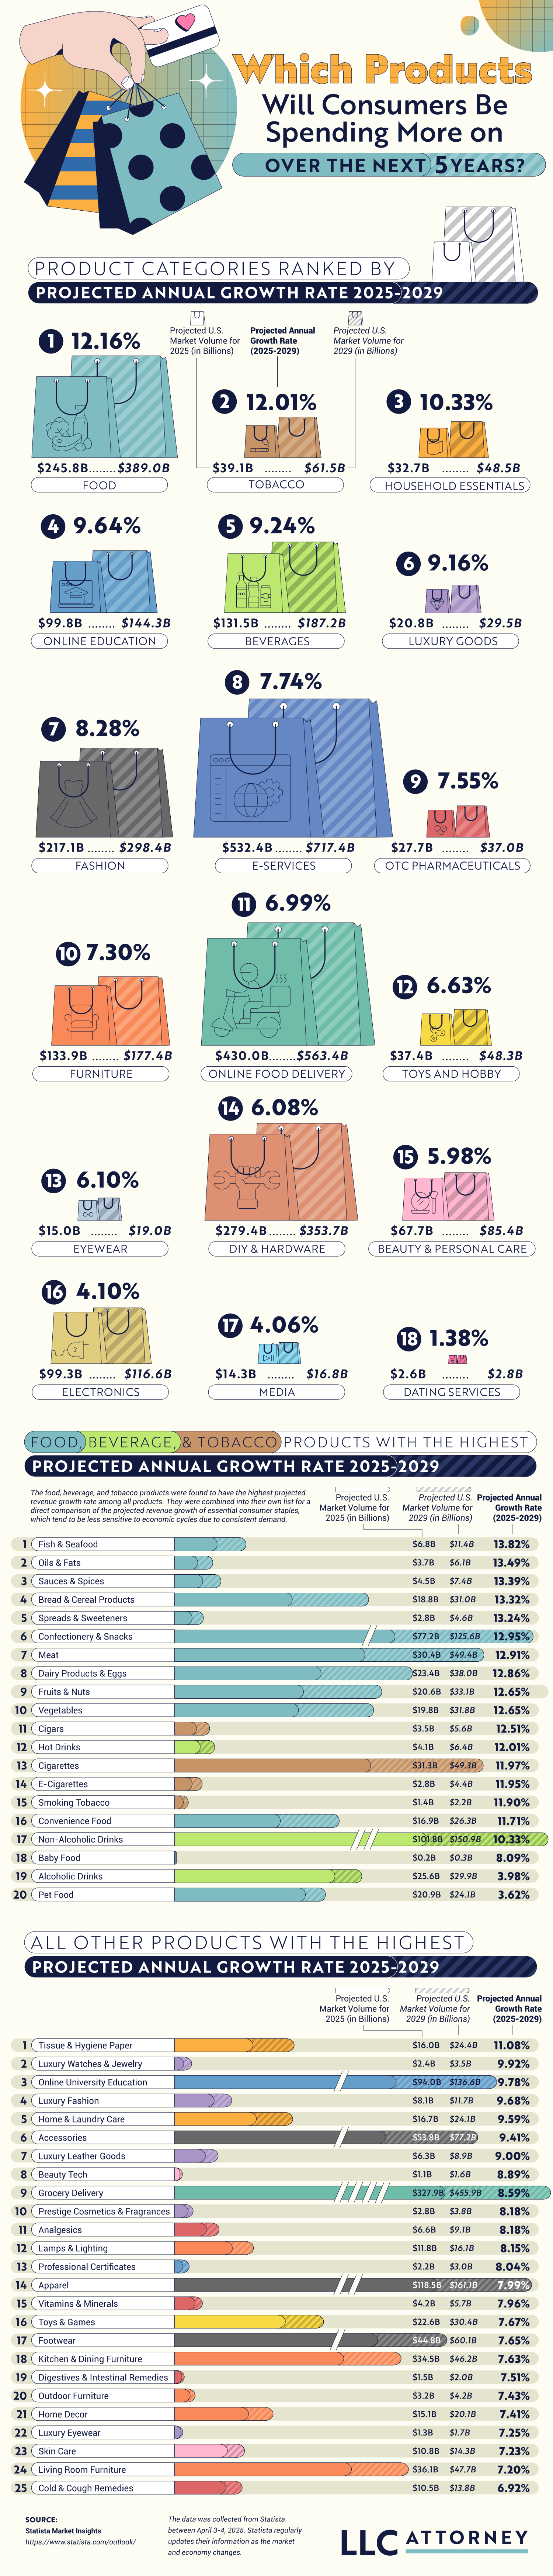
Experts expect these products to see the biggest spending increase between 2025 and 2029:
- Food
- Tobacco
- Household Essentials
- Online Education
- Beverages
- Luxury Goods
- Fashion
- E-Services
- OTC Pharmaceuticals
- Furniture
Analysts predict consumers will spend $389 on food in 2029, which is a 12% increase. Food will always be a high-spending category since it’s a necessity. Inflation hit grocery prices hard, and those prices rarely go back down. Part of the reason grocery prices have increased is that busy lifestyles are driving consumers to spend more on convenience food and meal kits. At the same time, rising restaurant prices drive more people to cook at home, which means a greater spend on ingredients.
The team’s data shows specific food, beverage, and tobacco products with the largest projected spending increases:
- Fish and Seafood
- Oils and Fats
- Sauces and Spices
- Bread and Cereal Products
- Spreads and Sweeteners
- Confectionery and Snacks
- Meat
- Dairy Products and Eggs
- Fruits and Nuts
- Vegetables
Outside of those three categories, these specific products have the highest projected spending increase:
- Tissue and Hygiene Paper
- Luxury Watches and Jewelry
- Online University Education
- Luxury Fashion
- Home and Laundry Care
- Accessories
- Luxury Leather Goods
- Beauty Tech
- Grocery Delivery
- Prestige Cosmetics and Fragrances
It may be surprising to see tobacco spending increase so much. Surveys show that young adults are using more tobacco than the previous generation because of the popularity of vapes and e-cigarettes. “Vice markets” tend to rise in periods of economic strain, so the sales very well may hold firm.
The household essentials category is similar to high grocery spending. Toilet tissue is an essential item, and the COVID-19 pandemic drove up spending on cleaning products. It seems many Americans haven’t relaxed their cleaning standards since then.
A combination of current trends and expert analysis on consumer behavior leads to these spending predictions. Demographics, interests, needs, and economic stability all contribute to a population’s spending habits. Not all trends are predictable. Significant events like warfare and natural disasters can dramatically impact prices and spending habits in ways that economists may not be able to predict. While not every change can be expected, this data can still provide an accurate forecast, and consumers should pay attention to areas where prices are set to increase. Perspective business owners can also use this information to their advantage and find opportunities for areas that will be in high demand in a few years.
-

 Business Visualizations1 year ago
Everything Owned by Apple
-

 Business Visualizations1 year ago
America’s Most Valuable Companies Ranked by Profit per Employee
-

 Business Visualizations6 months ago
The Biggest Employers by Industry
-
 Maps2 years ago
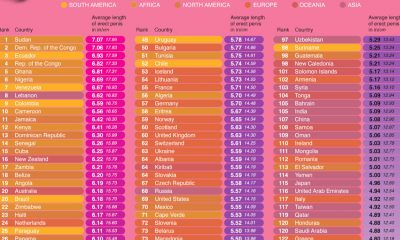
Penis Lengths Around the World
-
 Timelines2 years ago
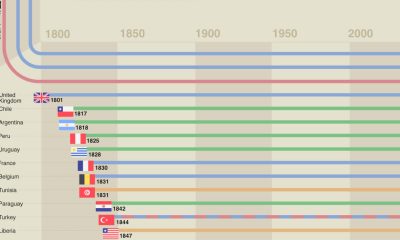
A History of the Oldest Flags in the World
-
 Business Visualizations2 years ago
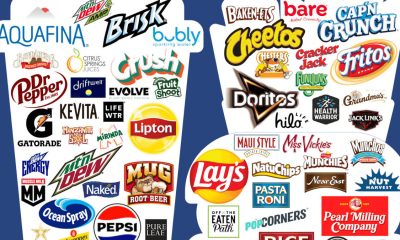
All The Brands Owned By PepsiCo
-

 Business Visualizations2 years ago
New Animated Map Shows Airbnb’s Fully Booked Cities Along the 2024 Eclipse Path of Totality
-
 Charts2 years ago
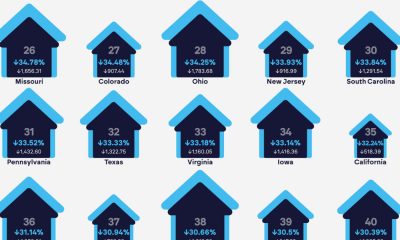
Real Estate Chart Reveals Your Money Has Only 50-80% of the Buying Power it Did 5 Years Ago