Misc Visuals
What Every Patch and Insignia Means on a U.S. Military Uniform
Military uniforms in the United States are as recognizable as they are iconic. Whether it’s in films such as Top Gun Maverick, television shows like M.A.S.H., video games like Call of Duty, or in real life, Americans are exposed to U.S. military uniforms on a regular basis. Most often represented is the active duty combat uniform which is officially called the battle dress uniform or BDU. This camouflaged uniform is complete with a series of patches indicating the identity of the soldier, the branch the soldier is enlisted in, their rank and so much more. What do all of those patches and pins mean? Luckily, the folks at Wizard Pins have created this ultimate visual guide to what every patch you might find on a military uniform means.
Click below to zoom
Differences between military patches on Army, Marine Corps, Navy, Air Force, Coast Guard, and even the newly formed Space Force are surprisingly similar. Differences appear to be largely thematic between each military branch. For example, rank patches on U.S. Air Force uniforms resemble wings. Other patches are reserved for those belonging to special divisions, units, and those who have special skills. The visual does an exceptional job of explaining what each patch signifies and where they can be found.
On combat uniforms, rank patches are intentionally modest in appearance to prevent enemy combatants from being able to easily identify leadership from a distance. U.S. Army uniforms, U.S. Marine Corps uniforms, U.S. Navy uniforms, U.S. Coast Guard uniforms, U.S. Air Force uniforms, and U.S. Space Force uniforms may have subtle differences, but they are all uniforms representing one of the largest military forces on the planet.
This map from NapLab highlights the locations with the highest instances of drowsy driving. This is such an important topic to study and gather data on. The National Highway Traffic Safety Administration says that in 2022, 693 people died in drowsy-driving-related crashes. Many people push their limits behind the wheel when they’re tired. After all, if you’re exhausted while traveling, nothing sounds more appealing than hurrying home to your warm, familiar bed. But maps like this one illustrate just how risky this decision can be.
The team at NapLab studied fatalities in drowsy driving accidents, adjusted rates by population density and then mapped out the locations that had the most accidents. Here are their findings.
Click below to zoom

For counties with 150,000-500,000 residents:
- Bastrop County, TX: 20.72 fatalities per 100,000
- Coconino County, AZ: 13.19 fatalities per 100,000
- Midland County, TX: 20 11.63 fatalities per 100,000
- Hunt County, TX: 10.16 fatalities per 100,000
- Liberty County, TX: 9.80 fatalities per 100,000
For counties with 25,000-150,000 people:
- Gillespie, TX: 40.03 per 100,000
- Milam, TX: 1039.02 per 100,000
- Walker, AL: 2132.64 per 100,000
- Cass, TX: 931.54 per 100,000
- Sweetwater, WY: 31.44 per 100,000
For counties with populations of 5,000 to 25,000:
- Pecos, TX: 190.02 per 100,000
- Reeves, TX: 178.23 per 100,000
- Madison, TX: 157.23 per 100,000
- Refugio, TX: 150.78 per 100,000
- Winkler, TX: 150.56 per 100,000
Texas counties topped most of the of the lists, which might be due to dark, quiet rural highways lulling drivers to sleep.
Boat lovers have a new way to pick their dream destination with this chart ranking states by how desirable they are for boaters. The SI Yachts team used a detailed scoring system to rank these states. The system considers some of the major factors important to boaters like average temperatures, number of sunny and cloudy days, amount of coastline, lakes, and rivers, hurricane risk, number of boats owned in the state, and the average cost of boater’s insurance. All these factors, averaged together, created the team’s ultimate list of boating states.
Click below to zoom.
Despite the hurricane risks, Louisiana still comes out on top as the best state for boating. Miles and miles of coastline and waterways, low swampy areas, and a fishing legacy make boating a way of life in the Bayou State. As for the bottom of the list, New York was not the Empire State for boating. Expensive boater’s insurance and few days of ideal weather meant that despite this state’s abundance of lakes, rivers, and coastline, it just wasn’t an ideal place to own a boat.
Every boater has different priorities to guide where they want to set sail, but this chart is a great way to consider where you’ll find a boater’s paradise. There’s a great diversity of regions in the top states on this list so East or West, North or South, you’ll find the perfect boating destination.
This may be the most colorful visualization of history we’ve ever seen! This chart shows every single color of Crayola crayon ever made. Given the company’s long history, that’s an impressive and long list of colors! Over the years they’ve made many special and limited editions sets of crayons, so you may not have realized that the company has made over 400 crayon colors. And yet, it’s true! Since the first set of crayons was made back in 1903 with a simple set of 8 colors, the company has become a childhood staple and experimented with all kinds of different colors, styles, and twists on the wax crayon. You can see it for yourself on the visualization:
Click below to zoom
Scanning over these colors is a real trip down memory lane. Crayola doesn’t have all these colors in circulation anymore. You might remember glitter crayons from childhood or the neon set. Or what about scented crayons that smelled good enough to eat? Many people feel nostalgic over the smell of Crayola’s which comes from a substance called stearic acid, which is derived from beef fat. Unfortunately, you can’t buy every color in the graph fresh and new (though plenty of people sell them used for collectors.) Crayola does sell a huge set of 120 crayons for a well-rounded set of what they offer. Only the most avid collectors might experience all 400 colors, but we can come close with the colorful visual of the long history of Crayola!
-
 Charts3 years ago
Where Are the Most Bike-Friendly Cities in America?
-
 Maps4 years ago
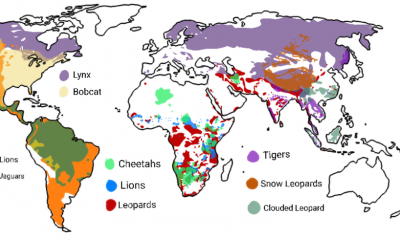
World Map Shows the Distribution of Big Cats Around the World
-
 Misc Visuals3 years ago
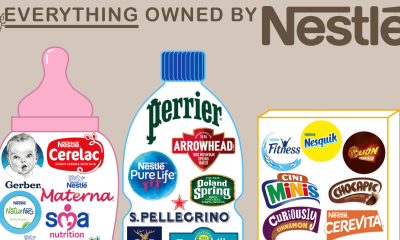
What Brands Does Nestlé Own?
-
 Timelines4 years ago
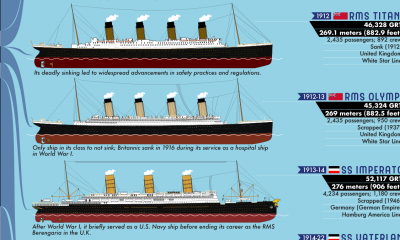
The Largest Passenger Ships in the World Since 1831
-
 Charts4 years ago
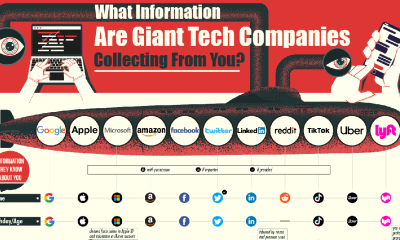
A Compilation of Information That Popular Tech Companies Collect From Their Users
-
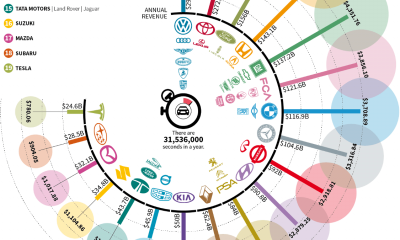
 Charts4 years ago
How Much Car Manufacturers Make Every Second
-
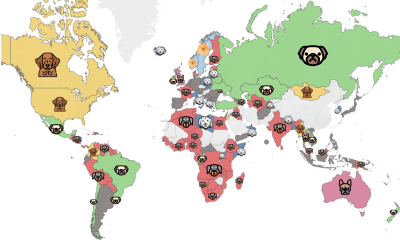
 Maps3 years ago
The Most Searched Dog Breeds In Every Country Around The World
-
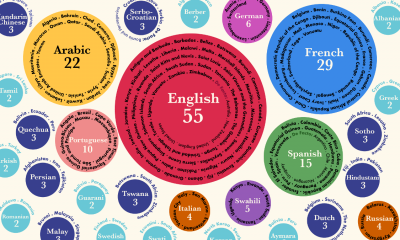
 Charts4 years ago
The Official Languages Found in the Most Countries Around the World