Misc Visuals
What Really Happens When You Recycle?
Most of us do our best to recycle when we can. From cardboard boxes to plastic drink containers, doing our part to recycle reduces waste and helps protect our planet. Is what we’re doing enough to offset the impact of wasteful materials on the environment? And how does single-stream recycling really work?
The visualization below created by O.Berk outlines what happens after you put paper, plastic, aluminum, and steel in the recycling bin.
Click below to zoom
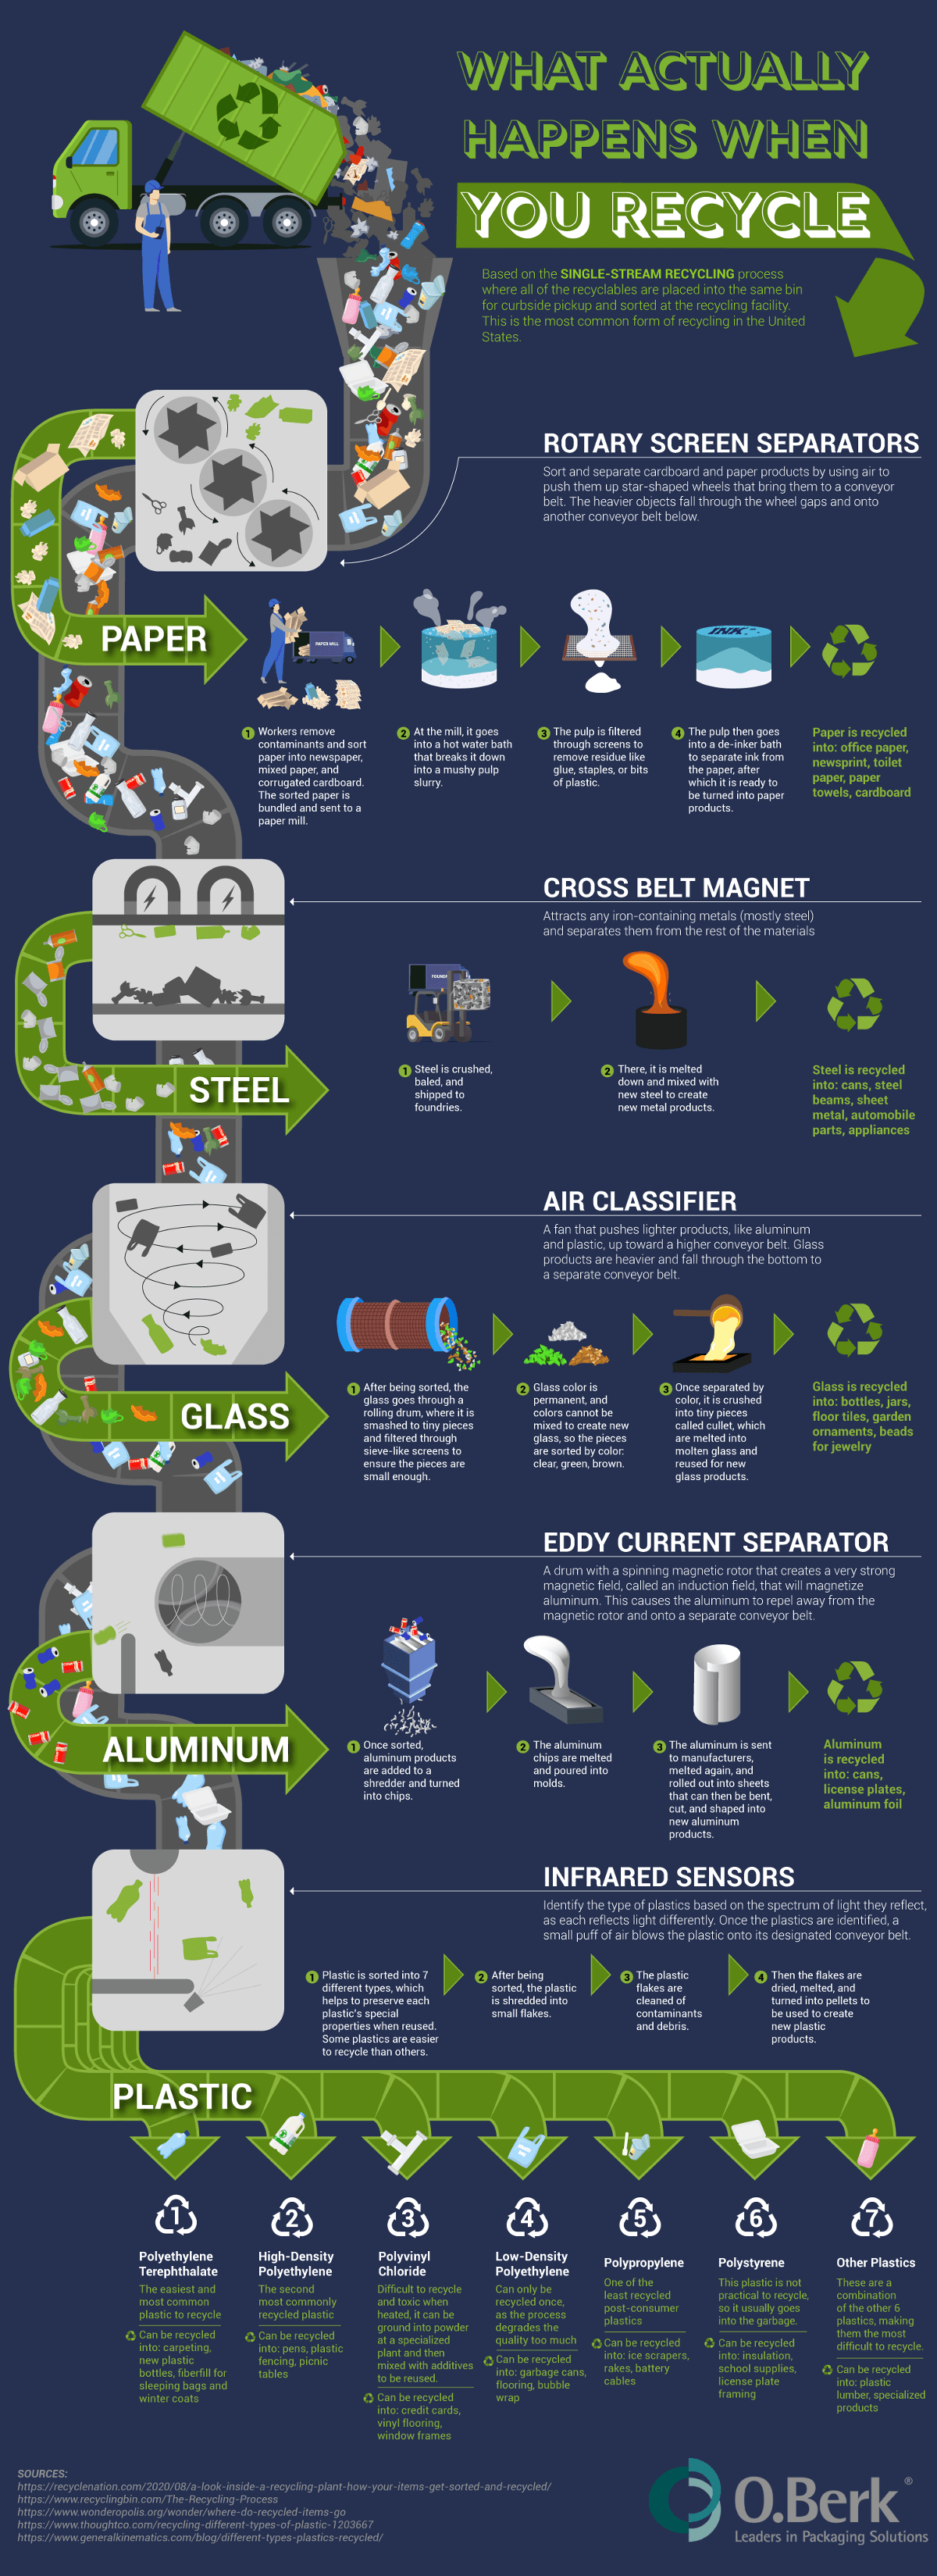
The graphic utilizes a flow chart to visualize how different materials are recycled based on a single-stream recycling process, which is where recyclables of all different types are placed in the same bin and sorted later at the facility. There are a number of processes that help sort materials at the recycling center:
-
- Rotary screen separators help to sort paper products by pushing them up to wheels with air. The paper products stay up while the heavier objects fall to another conveyor belt underneath.
-
- Cross belt magnets attract steel and other iron-containing metals to separate them from the rest.
-
- Air classifiers are fans that push light products (such as plastic and aluminum) towards a conveyor belt above. Glass products fall to a conveyor belt below where they are then recycled.
-
- Eddy current separators are spinning drums that create magnetic field that helps magnetize aluminum and push it towards a conveyor belt.
-
- Infrared sensors use light reflection to determine different types of plastics. Then, a puff of air helps push them onto the correct conveyor belt based on the number indicated on the product.
As of April 2025, there have been 16 measles outbreaks in the United States, a number that has jumped significantly over the past few years. A new study from PA Requirements shows this has a connection to vaccination gaps. Kindergarten vaccinations help protect citizens against diseases like measles and contribute to our population achieving herd immunity, which eradicates the threat of the disease. However, the team’s study reveals that a combination of policy, vaccine access, and community factors is hindering our progress toward this goal.
Click below to zoom.
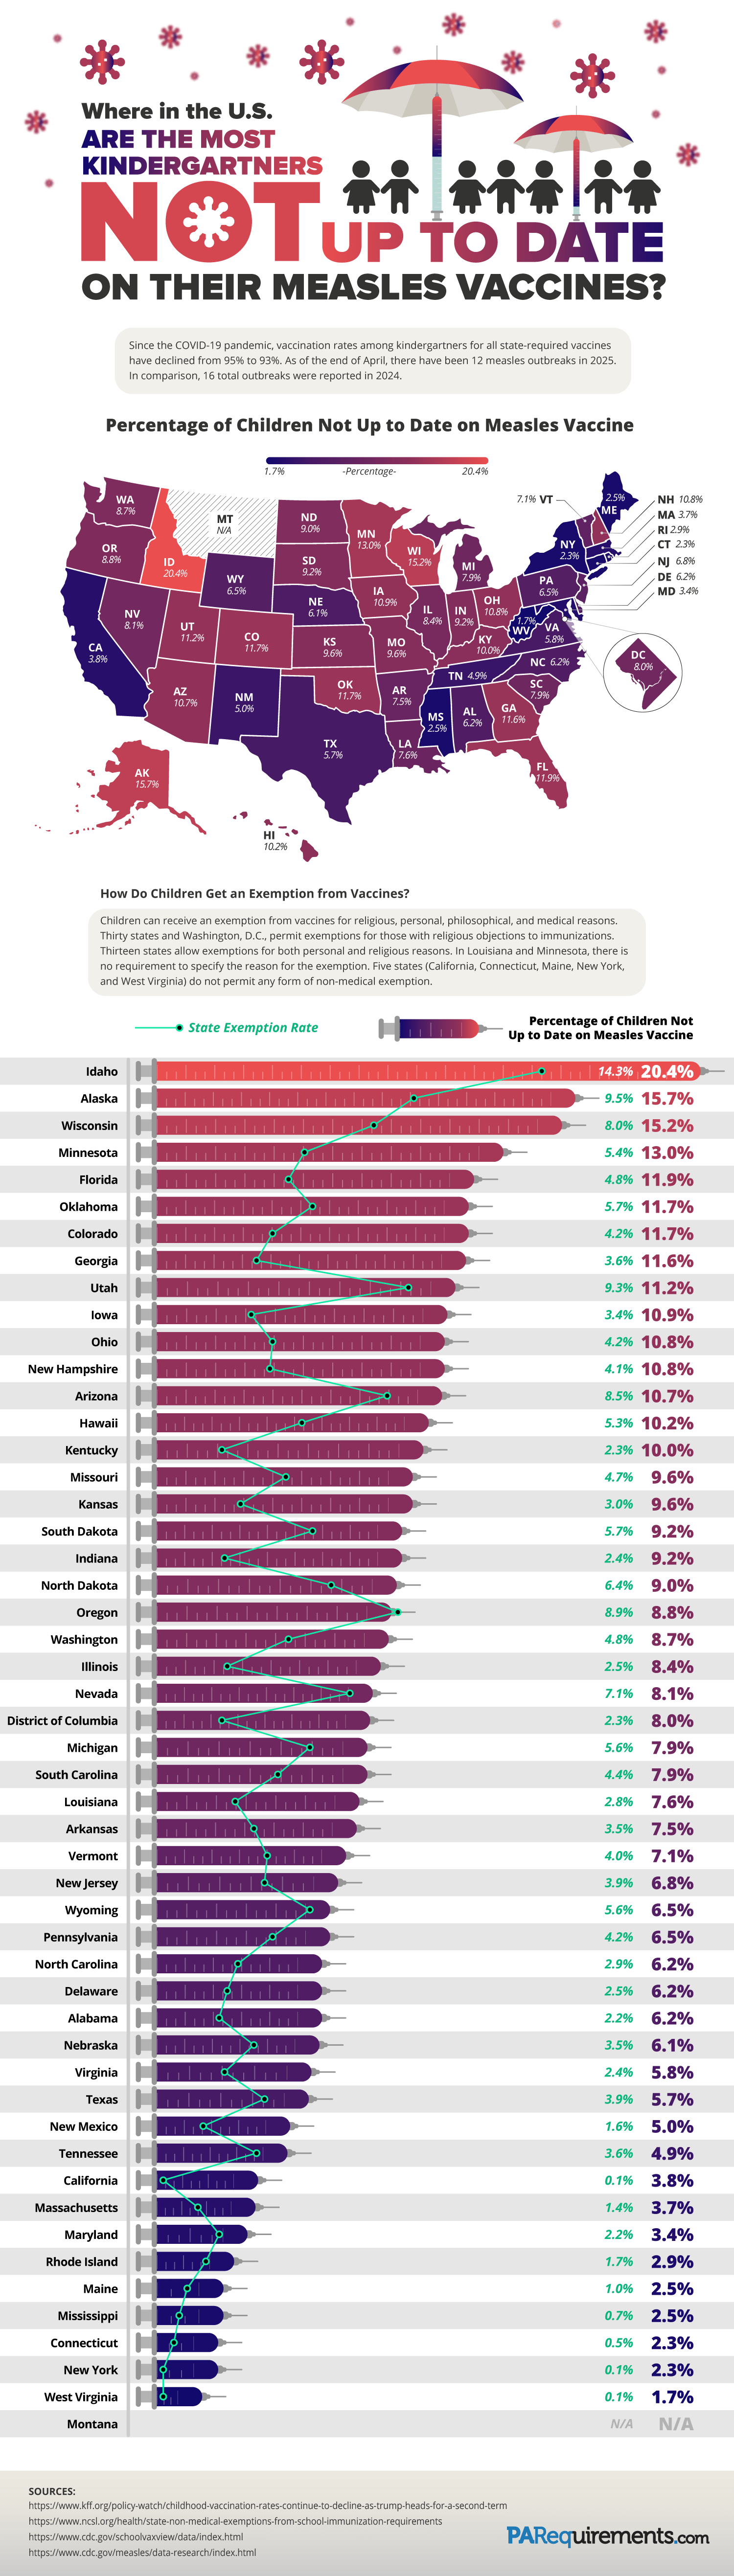
The team found that these states had the highest percentage of children not vaccinated for measles:
- Idaho: 20.4%
- Alaska: 15.7%
- Wisconsin: 15.2%
- Minnesota: 13.0%
- Florida: 11.9%
- Oklahoma: 11.7%
- Colorado: 11.7%
- Utah: 11.2%
- Iowa: 10.9%
- Ohio: 10.8%
It can be useful to compare these numbers to the states with the lowest rates of unvaccinated children:
- West Virginia: 1.7%
- New York: 2.3%
- Connecticut: 2.3%
- Mississippi: 2.5%
- Maine: 2.5%
- Rhode Island: 2.9%
- Maryland: 3.4%
- Massachusetts: 3.7%
- California: 3.8%
We can observe some interesting regional patterns by examining the map, such as lower vaccination rates in the Midwest and Southwest.
Among the states with high rates of vaccination, we find that these five states don’t allow non-medical vaccination exemptions: Maine, New York, West Virginia, Connecticut, and California. It’s no surprise that stricter policies lead to a greater number of vaccinations. Among states with lower rates, we find more relaxed laws that allow for greater exemptions on the basis of religion, philosophy, and other personal reasons. Comparing each state to its neighbors reveals patterns and trends that might imply cultural differences affecting vaccination rates in different regions. We can look for locations with a high prevalence of religions that outlaw vaccines to identify reasons for the numbers on the map. Check the numbers on the states with the largest cities, and you might find stricter vaccination laws there to help prevent disease spread in population-dense areas.
There’s no doubt that state policies correlate directly with vaccination rates when we look at the numbers presented on the team’s graphic. Many states require certain vaccinations, like measles, in order to enroll in public school. These laws and requirements also directly impact vaccination rates. Looking at insurance costs and access to vaccine clinics in rural areas may also reveal why some areas have more unvaccinated children than others. Some states have created initiatives to encourage vaccination and provide education, leading to higher vaccination rates.
Overall, studies like these greatly benefit public health by increasing awareness and education about diseases like measles. People who shy away from vaccines often find them untrustworthy. The only way to convince them otherwise is to answer their questions and present them with transparent data that’s easy to understand, just like the information shown in this graphic, regarding the risks associated with declining vaccines. These studies provide policymakers, parents, and public health officials with more information to make informed decisions for the health of their children and communities.
Do you have a passion for fast cars, scenic drives, and classic automobiles? If so, you might be curious about which states cater best to car lovers. The experts at Speedway Motors have developed a ranking system that evaluates each state based on the factors most important to auto enthusiasts. Their in-depth analysis reveals which parts of the country offer the best experience for those who live and breathe cars.
Click below to zoom.
How the Rankings Were Determined
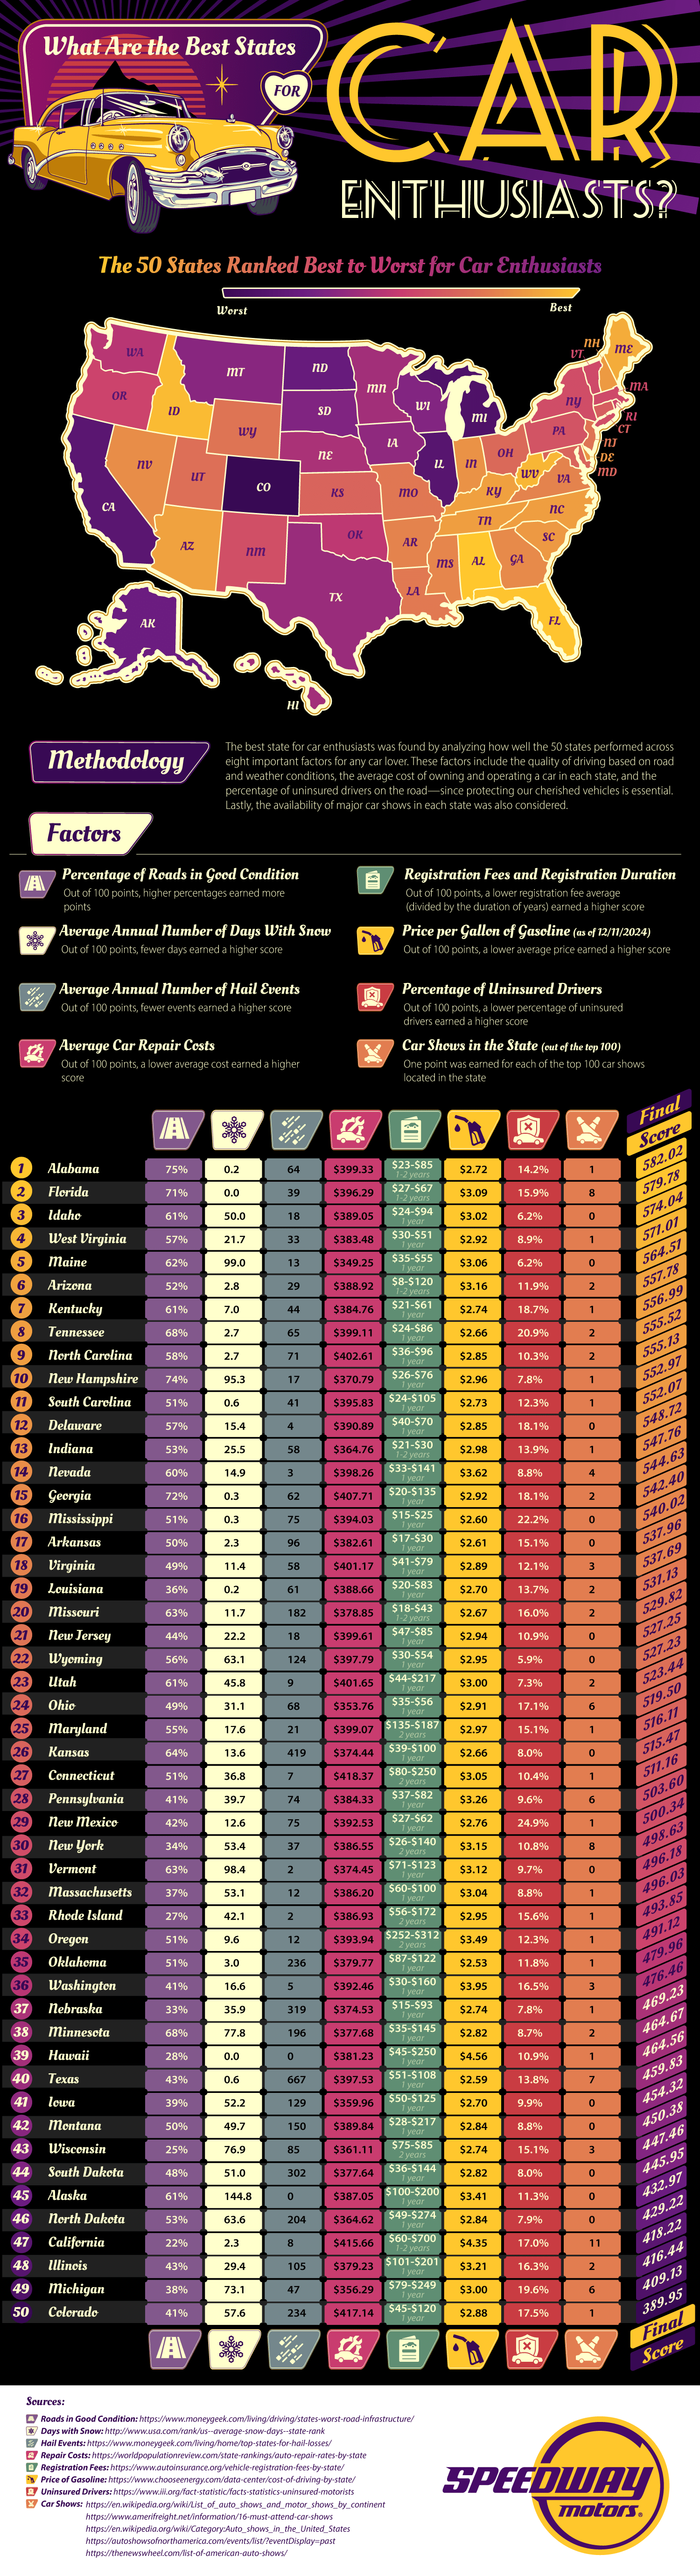
Determining the ultimate destination for car fans isn’t an exact science, but the research team considered a variety of key factors to ensure a well-rounded assessment. Here’s what they looked at:
- The percentage of roads in excellent condition
- The average number of snow days per year
- The frequency of hailstorms annually
- Registration costs and duration
- The price of fuel per gallon
- The percentage of uninsured drivers
- The number of car shows held in the state
- The availability of auto racing venues
Do these factors align with what you’d consider important for an ideal car-friendly state? We think this method covers all the essential aspects—driving conditions, costs, events, and opportunities to enjoy the thrill of the road.
Top States for Car Lovers
Based on this ranking system, the following states earned top spots for their well-maintained roads, favorable weather, affordable fuel, and exciting car culture:
- Florida
- Alabama
- Idaho
- North Carolina
- West Virginia
- Tennessee
- Arizona
- Indiana
- New Hampshire
- Kentucky
Florida takes the lead as the best state for car enthusiasts, thanks to its warm climate, minimal snowfall, and well-kept roads. Car lovers will also appreciate the numerous auto events, such as the prestigious Amelia Island Concours d’Elegance, where rare and luxury cars take center stage. Racing fans, on the other hand, can enjoy the adrenaline rush of the iconic Daytona 500. Even though fuel prices are slightly above average, Florida’s thriving car culture more than makes up for it.
The State with the Most Car Meet-Ups
This chart’s strength comes from the way it breaks down specific aspects that appeal to car lovers. For example, if you don’t care about driving as much as you care about attending car shows, you can re-evaluate the rankings and bring the states with the highest scores for car shows to the top of your list. This would make California the top state in terms of car shows, with more than any other state. Monterey Car Week alone can satisfy even the most passionate enthusiasts!
The State with the Best Roads
For those who express their love of cars with road trips, you’ll be interested to know that Alabama has the best-kept roads in the nation. 75% of them are well-maintained and in good condition. They’re closely followed by New Hampshire at 74%.
States with Low Gas Prices
It’s hard to enjoy a good road trip if you blow your budget on gas. Oklahoma offers the most value for your money, with average gas prices of $2.53 per gallon at the time of the study. Texas came in second place at $.259 per gallon.
A Guide to the Best Beaches in America
Visual guides like this one from Florida Rentals can be handy for planning a vacation. The team has released a scoring system that points us toward America’s best beaches. Grab your flip-flops and dive in. There’s a wealth of information to find here. The team created its own scoring system to help us understand why these 20 beaches are considered the best. At a glance, you’ll be able to see which beaches are best, but if you want the details, the team outlined the criteria they used to judge the beaches and the score they gave each beach in each category.
Click below to zoom.
How the Beaches are Ranked
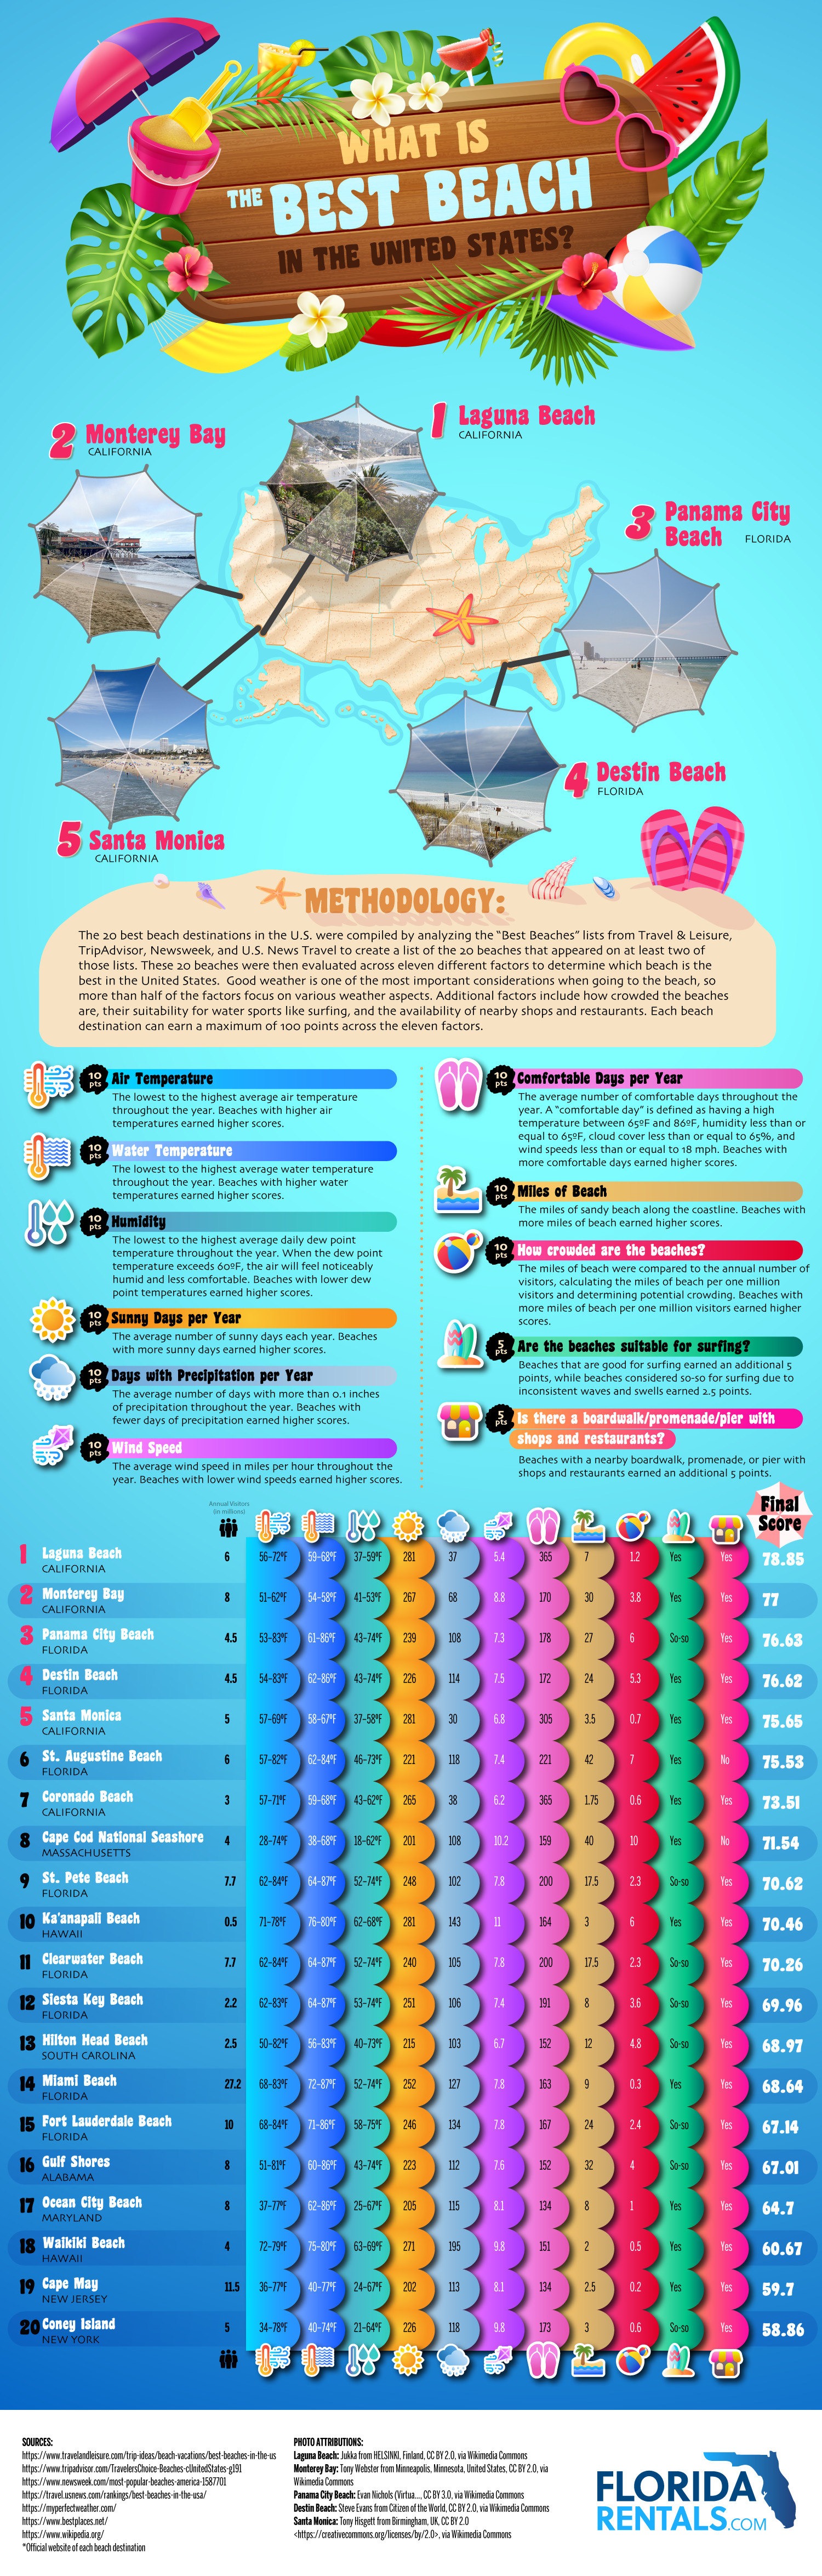
Everyone has different qualities they look for in a beach, but we think the Florida Rentals crew did an excellent job pinpointing what’s most important to a variety of beachgoers. These are the factors that were used to create the scoring system:
- Air temperature
- Water temperature
- Humidity
- Annual sunny days
- Annual precipitation
- Wind speed
- Annual comfortable days
- Miles of beach
- Beach crowdedness
- Suitability for water sports
- Boardwalk presence
The Beaches with the Best Scores
The final high-score list represents beaches all across America, although it’s clear that California and Florida have the lion’s share of top beaches. After crunching the numbers and weighing the factors, Florida Rentals determined that these beaches are best:
- Laguna Beach – California
- Monterey Bay – California
- Panama City Beach – Florida
- Destin Beach – Florida
- Santa Monica – California
- Augustine Beach – Florida
- Coronado Beach – California
- Cape Cod National Seashore – Massachusetts
- Pete Beach – Florida
- Ka’anapali Beach – Hawaii
- Clearwater Beach – Florida
- Siesta Key Beach – Florida
- Hilton Head Beach – South Carolina
- Miami Beach – Florida
- Fort Lauderdale Beach – Florida
- Gulf Shores – Alabama
- Ocean City Beach – Maryland
- Waikiki Beach – Hawaii
- Cape May – New Jersey
- Coney Island – New York
Finding a Beach Based on Specific Qualities
The great thing about this chart is that we can ignore the official ranking system and focus on what matters to each of us personally. For example, if you think the bigger the beach, the better, then you might believe St. Augustine Beach in Florida is the true winner. It has a stunning 42 miles of coastline, the most of any beach on the list.
Many beach lovers prize good weather the most, allowing them to spend a long day on the sand and in the surf with comfort. For these beach fans, the overall winner, Laguna Beach, truly is the top beach, with near-perfect weather in all seasons, along with warm sun and low humidity. Others may want to avoid the country’s most famous beaches because let’s face it, sharing a beach with a crowd of people kicking sand all over your blankets and picnic baskets can ruin a beach day fast. For low crowds, Cape Cod National Seashore in Massachusetts offers the best proportion of miles of beach to the number of visitors.
-

 Business Visualizations9 months ago
Everything Owned by Apple
-

 Business Visualizations8 months ago
America’s Most Valuable Companies Ranked by Profit per Employee
-

 Business Visualizations2 months ago
The Biggest Employers by Industry
-

 Business Visualizations4 months ago
The Biggest Fortune 500 Company in Every State
-
 Timelines1 year ago
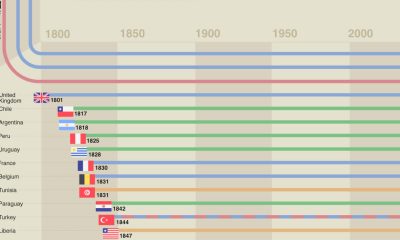
A History of the Oldest Flags in the World
-
 Maps1 year ago
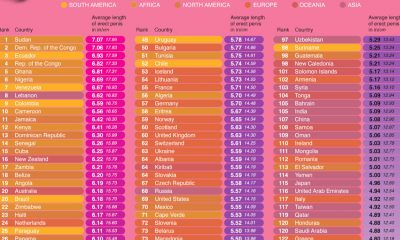
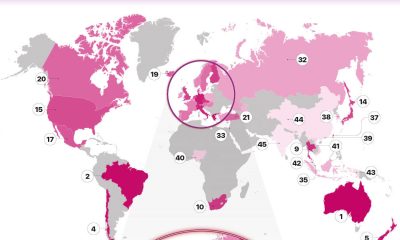
Penis Lengths Around the World
-

 Business Visualizations2 years ago
How Many Companies Does Elon Musk Own?
-
 Charts2 years ago
The Most Promiscuous Countries in the World