Maps
New Map Shows Which Countries Are the Most Progressive in Regulating AI
Sometimes charts and graphs are the most effective way to give us important information about current events, as is the case with this graphic from AIRPRM:
Click below to zoom
The AI industry is growing and changing at a rapid rate. Many people are excited about the bountiful opportunities it can bring to society, but others are more cautious. Experts have stated concerns about AI eliminating jobs, harvesting copyrighted data, creating deep fakes, and being deployed for other nefarious purposes. On top of that, environmentalists raised concern about the carbon emissions caused by AI servers. As we can see from this chart, these concerns are taken seriously by world governments. Here we can see which countries have developed a national AI strategy, how much they’ve invested in AI initiatives, and what kind of legislation these countries have enacted.
The data shows us that the United States have developed the largest number of policies and strategies while The European Union leads the way in amount of money invested in AI strategy (as far as we can tell. AIPRM lacked the data to determine how much the US has spent on their efforts.) The European Union leads in another way too with the development of the AI Act, a piece of horizontal legislature determining nationwide rules regarding transparency, data usage, accountability, and human oversight. The AI Act will likely pave the way for legislation that other countries develop in the future. We love how informative this graphic is while also giving us a quick and colorful overview of the state of AI law across the world.
Charts
The Most Dangerous Places to Drive on New Year’s
Millions of Americans travel for New Year’s Eve and Day celebrations, but unfortunately, the last night of the year can be one of the most dangerous for drivers. CarInsurance.com analyzed data from the National Highway Traffic Safety Administration to find that certain states and counties have consistently higher fatality rates on December 31 and January 1. The team identified where and when the risks are highest.
Click below to zoom.
The team’s analysis examined NHTSA fatality numbers between 2014 and 2023, then adjusted this data relative to population to calculate the number of fatalities per 100,000 residents. They discovered that these states had the highest per-capita traffic deaths on New Year’s Eve:
- South Carolina – 1.39 deaths per 100,000 (71 total)
- Mississippi – 1.35 deaths per 100,000 (40 total)
- Louisiana – 1.33 deaths per 1000,000 (62 total)
Florida was also a high-risk location. Its deaths per capita rank fourth on the list, but the total number of New Year’s Eve fatalities are much higher than the top three states, with 270 deaths in total. This is largely due to Florida’s large population and number of dangerous counties.
Focusing on these high-risk counties revealed some especially hazardous locations. The deadliest U.S. counties on New Year’s Eve and Day were:
- Sarasota County, Florida – 2.3 fatalities per 100,000 (10 deaths)
- Manatee County, Florida – 2.0 per 100,000 (8 deaths)
- Davidson County, Tennessee – 1.96 per 100,000 (14 deaths)
Sarasota and Manatee counties are both linked to high rates of DUI-related traffic fatalities, which can help explain their placement at the top of the list.
The danger not only varies by place, but by the time of day. On New Year’s Eve, the deadliest hours occur between 2 a.m. and 3 a.m. for 38 recorded fatalities. On New Year’s Day, the early morning hours are by far the most dangerous, with 137 deaths occurring between 2 a.m. and 3 a.m. and 131 deaths between 1 a.m. and 2 a.m.
Over the decades, we see 1,047 deaths on December 31st and 1,474 on January 1st, so New Year’s Day has the most fatalities overall, which is probably due to partygoers under the influence returning home in the early morning hours.
The largest contributor to New Year’s traffic deaths is certainly alcohol impairment. For example, in 2022, 37% of deadly crashes on New Year’s Day involved an alcohol impaired driver. This number varies year-to-year, but it does highlight how common drunk driving is during holiday celebrations.
This pattern aligns with a broader national trend of alcohol-impaired driving leading to traffic fatalities. In 2023, a third of U.S. traffic deaths involved drunk drivers, prompting campaigns run during the holiday period with slogans like, “Drive sober or get pulled over.”
Understanding the safety facts the team outlined can help drivers make safe decisions over the holidays. We can see from the data that they should avoid driving between 1 a.m. and 3 a.m. on New Year’s Eve and New Year’s Day. They should arrange a sober ride and never drive under the influence. Always wear a seatbelt and be extra alert when driving.
Charts
The States Where Americans Give Hardware and Home Improvement Gifts
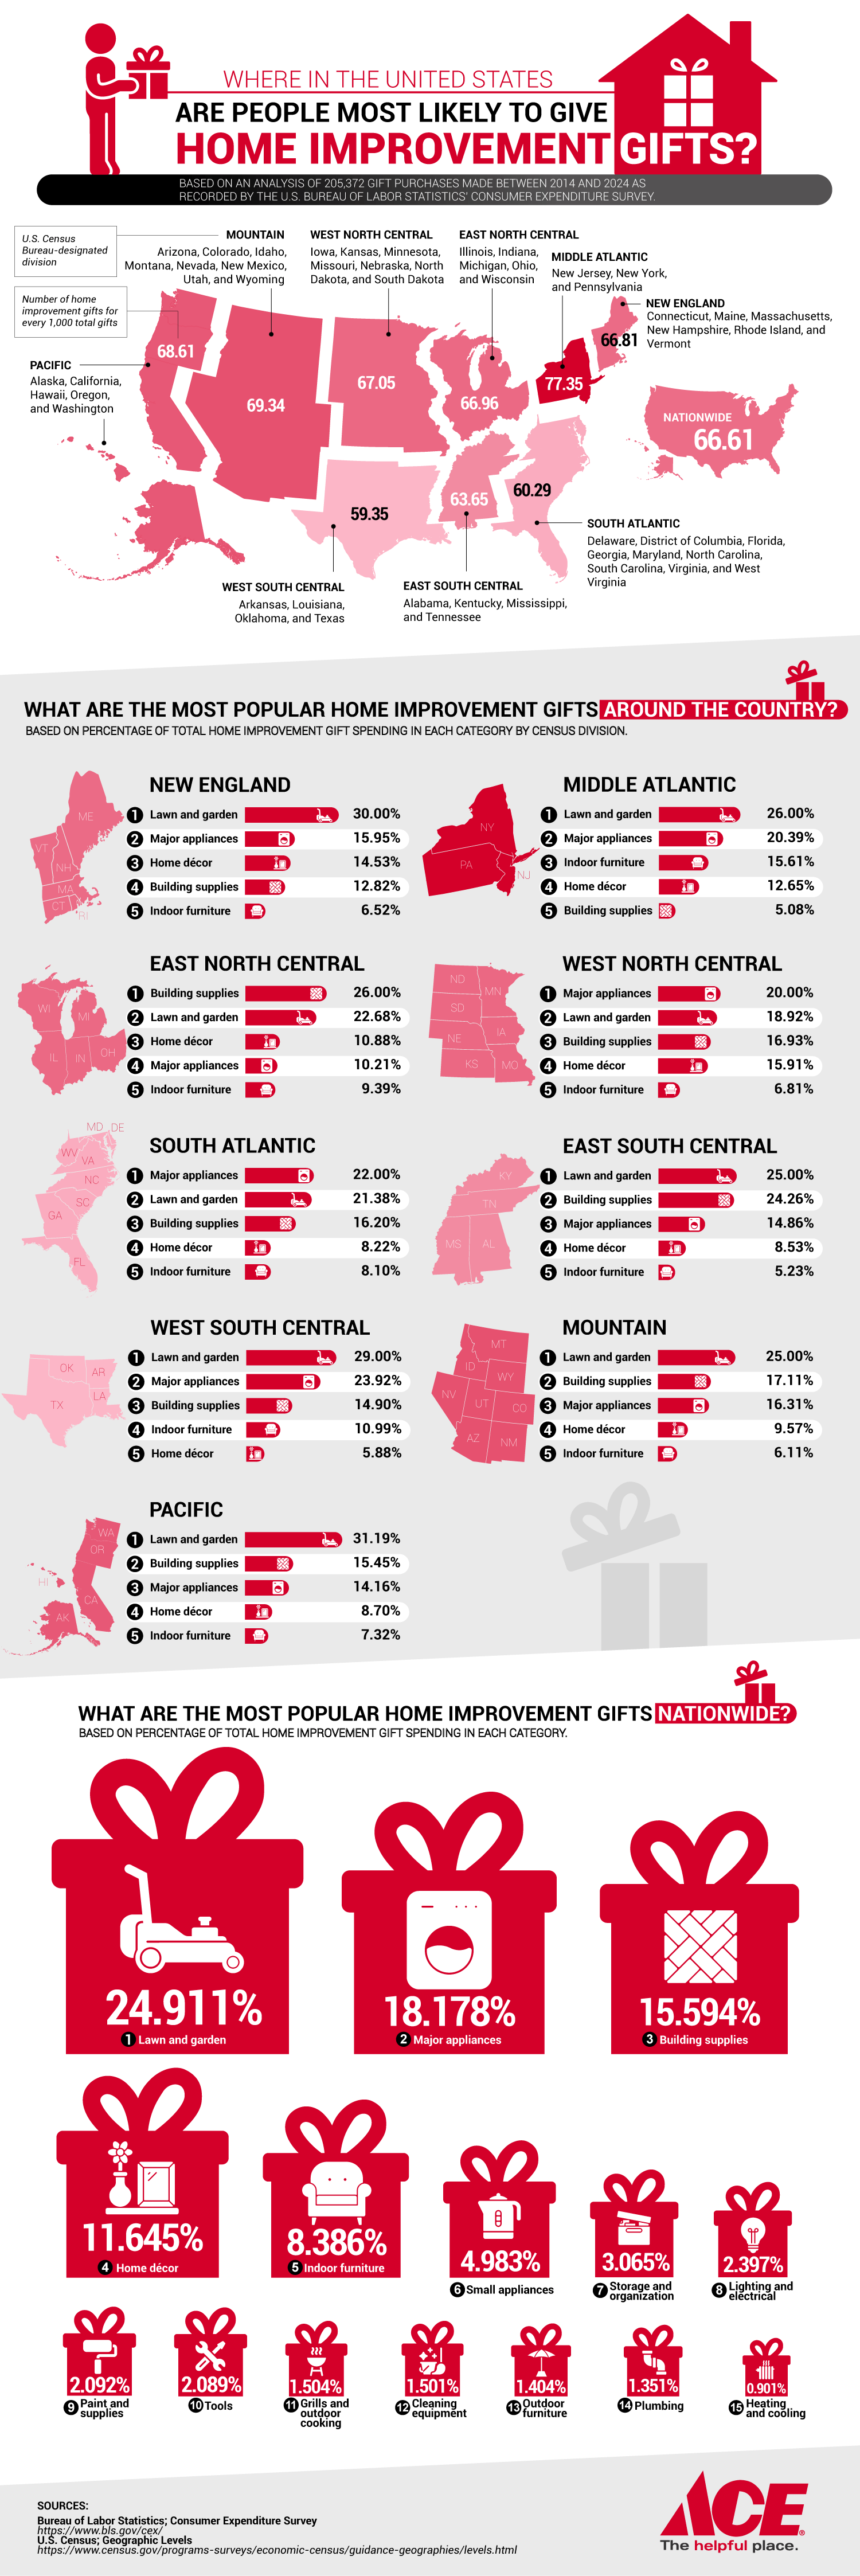
As the holidays approach, American families are thinking about gift-giving, and a trend stands out: Americans are giving home improvement and hardware items as useful and practical gifts. According to an Ace Hardware analysis of Bureau of Labor Statistics Consumer Expenditure Survey data spanning a decade of gift purchases, some regions are more likely to gift-wrap DIY tools, garden supplies, and appliances.
Click below to zoom.
Home ownership and upkeep are a major part of the American lifestyle. The team’s study found that 79% of homeowners undertake multiple home improvement projects each year, with many completing three or more. Americans spent $526 billion on home improvement in 2024. The number of projects per household has increased from 2.7 in 2015 to 3.4 in 2023. This commitment to home maintenance explains why hardware and home improvement supplies are a reliable gift choice, especially for people who live in older homes or in harsh climates.
According to the team’s study, the highest amount of home improvement gift-giving occurs in the Mid-Atlantic states, particularly New York, New Jersey, and Pennsylvania. In these states, 77.35 home improvement gifts were given out of every 1,000 gifts purchased. This is a higher rate than the national average of 66.61 gifts per 1,000 gifts purchased.
The popularity of home improvement gifts in the Mid-Atlantic is likely due to the region’s older homes. The median age of a New York home is 62, higher than the national home age median of 40 to 41. Older homes need more upkeep, upgrades, and repairs, making home improvement gifts all the more valuable and appreciated. The average age of homeowners in these properties is around 58, suggesting that these older homeowners have more financial stability to invest in larger home improvement projects. Extreme weather in these regions with cold winters and variable seasons necessitates ongoing maintenance.
The team determined the most popular types of home improvement gifts. Here’s how it broke down:
- Lawn and garden supplies – 24.91% of all home improvement gifts
- Major appliances – 18.18% of all home improvement gifts
- Building supplies – 15.59% of all home improvement gifts
- Home décor – 11.65% of all home improvement gifts
- Indoor furniture – 8.39% of all home improvement gifts
- Small appliances – 4.98% of all home improvement gifts
- Storage/organization items – 3.07% of all home improvement gifts
- Lighting/electrical supplies – 2.40% of all home improvement gifts
- Paint and painting supplies – 2.09% of all home improvement gifts
- Tools – 2.09% of all home improvement gifts
These numbers show that many Americans consider home improvement gifts to be both functional and meaningful. These gifts contribute to long-term comfort and the value of a home. The numbers might reflect that home improvement gifts are shifting beyond the scope of DIY aficionados to a universally appreciated gift. As homeowners juggle time and effort on the upkeep of their homes, these gifts can make their work easier and their home more enjoyable. Home improvement items are likely to remain a major aspect of holiday gift-giving.
Charts
Study Examines the Best Cities for Raising Kids
Many American families realize that location can have a major impact on their childhood experiences. The team at HireAHelper examines which U.S. cities offer the best environment for families. Their recently published map ranks cities based on their scores in a 10-factor “Family-Friendly Cities Index.” They not only reveal which cities earned the highest scores but also help us consider the factors families should weigh when deciding where to move.
Click below to zoom.
HireAHelper’s scoring index considers ten important dimensions that shape the way a city serves families and makes it an ideal place to raise children. Here are the index factors:
- Public school quality: The strength of the city’s public schools based on scores from the website, Niche.
- Overall “family-friendliness” rating: Niche’s city score based on safety, walkability, access to services, amenities, and livability.
- Cost of living: An estimate of the household income needed for a family to live comfortably.
- Childcare costs: This figure is based on how much it costs on average to send a newborn and a 4-year-old to daycare.
- Median household income: This shows the average household income in this location.
- Family fun: The availability of playgrounds, entertainment, parks, and kid-friendly activities.
- Health and safety: This considers crime rates, number of pediatricians, and general environmental health and well-being.
- Park quality: Based on the Trust for Public Land’s 2025 score on the acreage, amenities, accessibility, and investment in parks.
- Working Parents Score: This considers job flexibility, co-working availability, and remote-work friendliness.
- Family leave benefits: Not every state offers paid family leave, but it’s a huge advantage for parents during early childhood years.
The top-ranked city according to the team’s extensive analysis is Irvine, California. Irvine’s A+ rating in Niche’s public education category and its overall family-friendly score put it at the top of the list. Irvine has a higher cost of living and childcare costs than other cities on the list, but a high average household income helped offset those expenses. The city also scored well in safety, park quality, and family-fun. Families who can afford it will find a strong city that offers everything they could wish for: amenities, strong schools, and a high quality of life.
The strength of the team’s study lies in the details. Moving is never a one-size-fits-all endeavor. Different families will have other priorities and values, whether they relate to the importance of education, safety, affordability, or work flexibility. This study’s approach helps families consider a range of factors and rank cities based on their own needs. After all, a higher cost of living might be out of reach for some families, but affordability means compromise elsewhere, and families will have to choose whether they want this to be in the realm of family fun, parks, or some other area.
This study gives families a data-driven way to start their search for a new city to relocate to. Not every family will agree that Irvine, California, is the best option, but they will find many other options on the list, each with their own attractions.
-

 Business Visualizations1 year ago
Everything Owned by Apple
-

 Business Visualizations1 year ago
America’s Most Valuable Companies Ranked by Profit per Employee
-

 Business Visualizations11 months ago
The Biggest Fortune 500 Company in Every State
-

 Business Visualizations8 months ago
The Biggest Employers by Industry
-

 Maps2 years ago
Penis Lengths Around the World
-

 Timelines2 years ago
A History of the Oldest Flags in the World
-

 Business Visualizations2 years ago
New Animated Map Shows Airbnb’s Fully Booked Cities Along the 2024 Eclipse Path of Totality
-

 Business Visualizations2 years ago
Everything the Luxury Giant LVMH Owns in One Chart


