Business Visualizations
Everything Owned by Apple
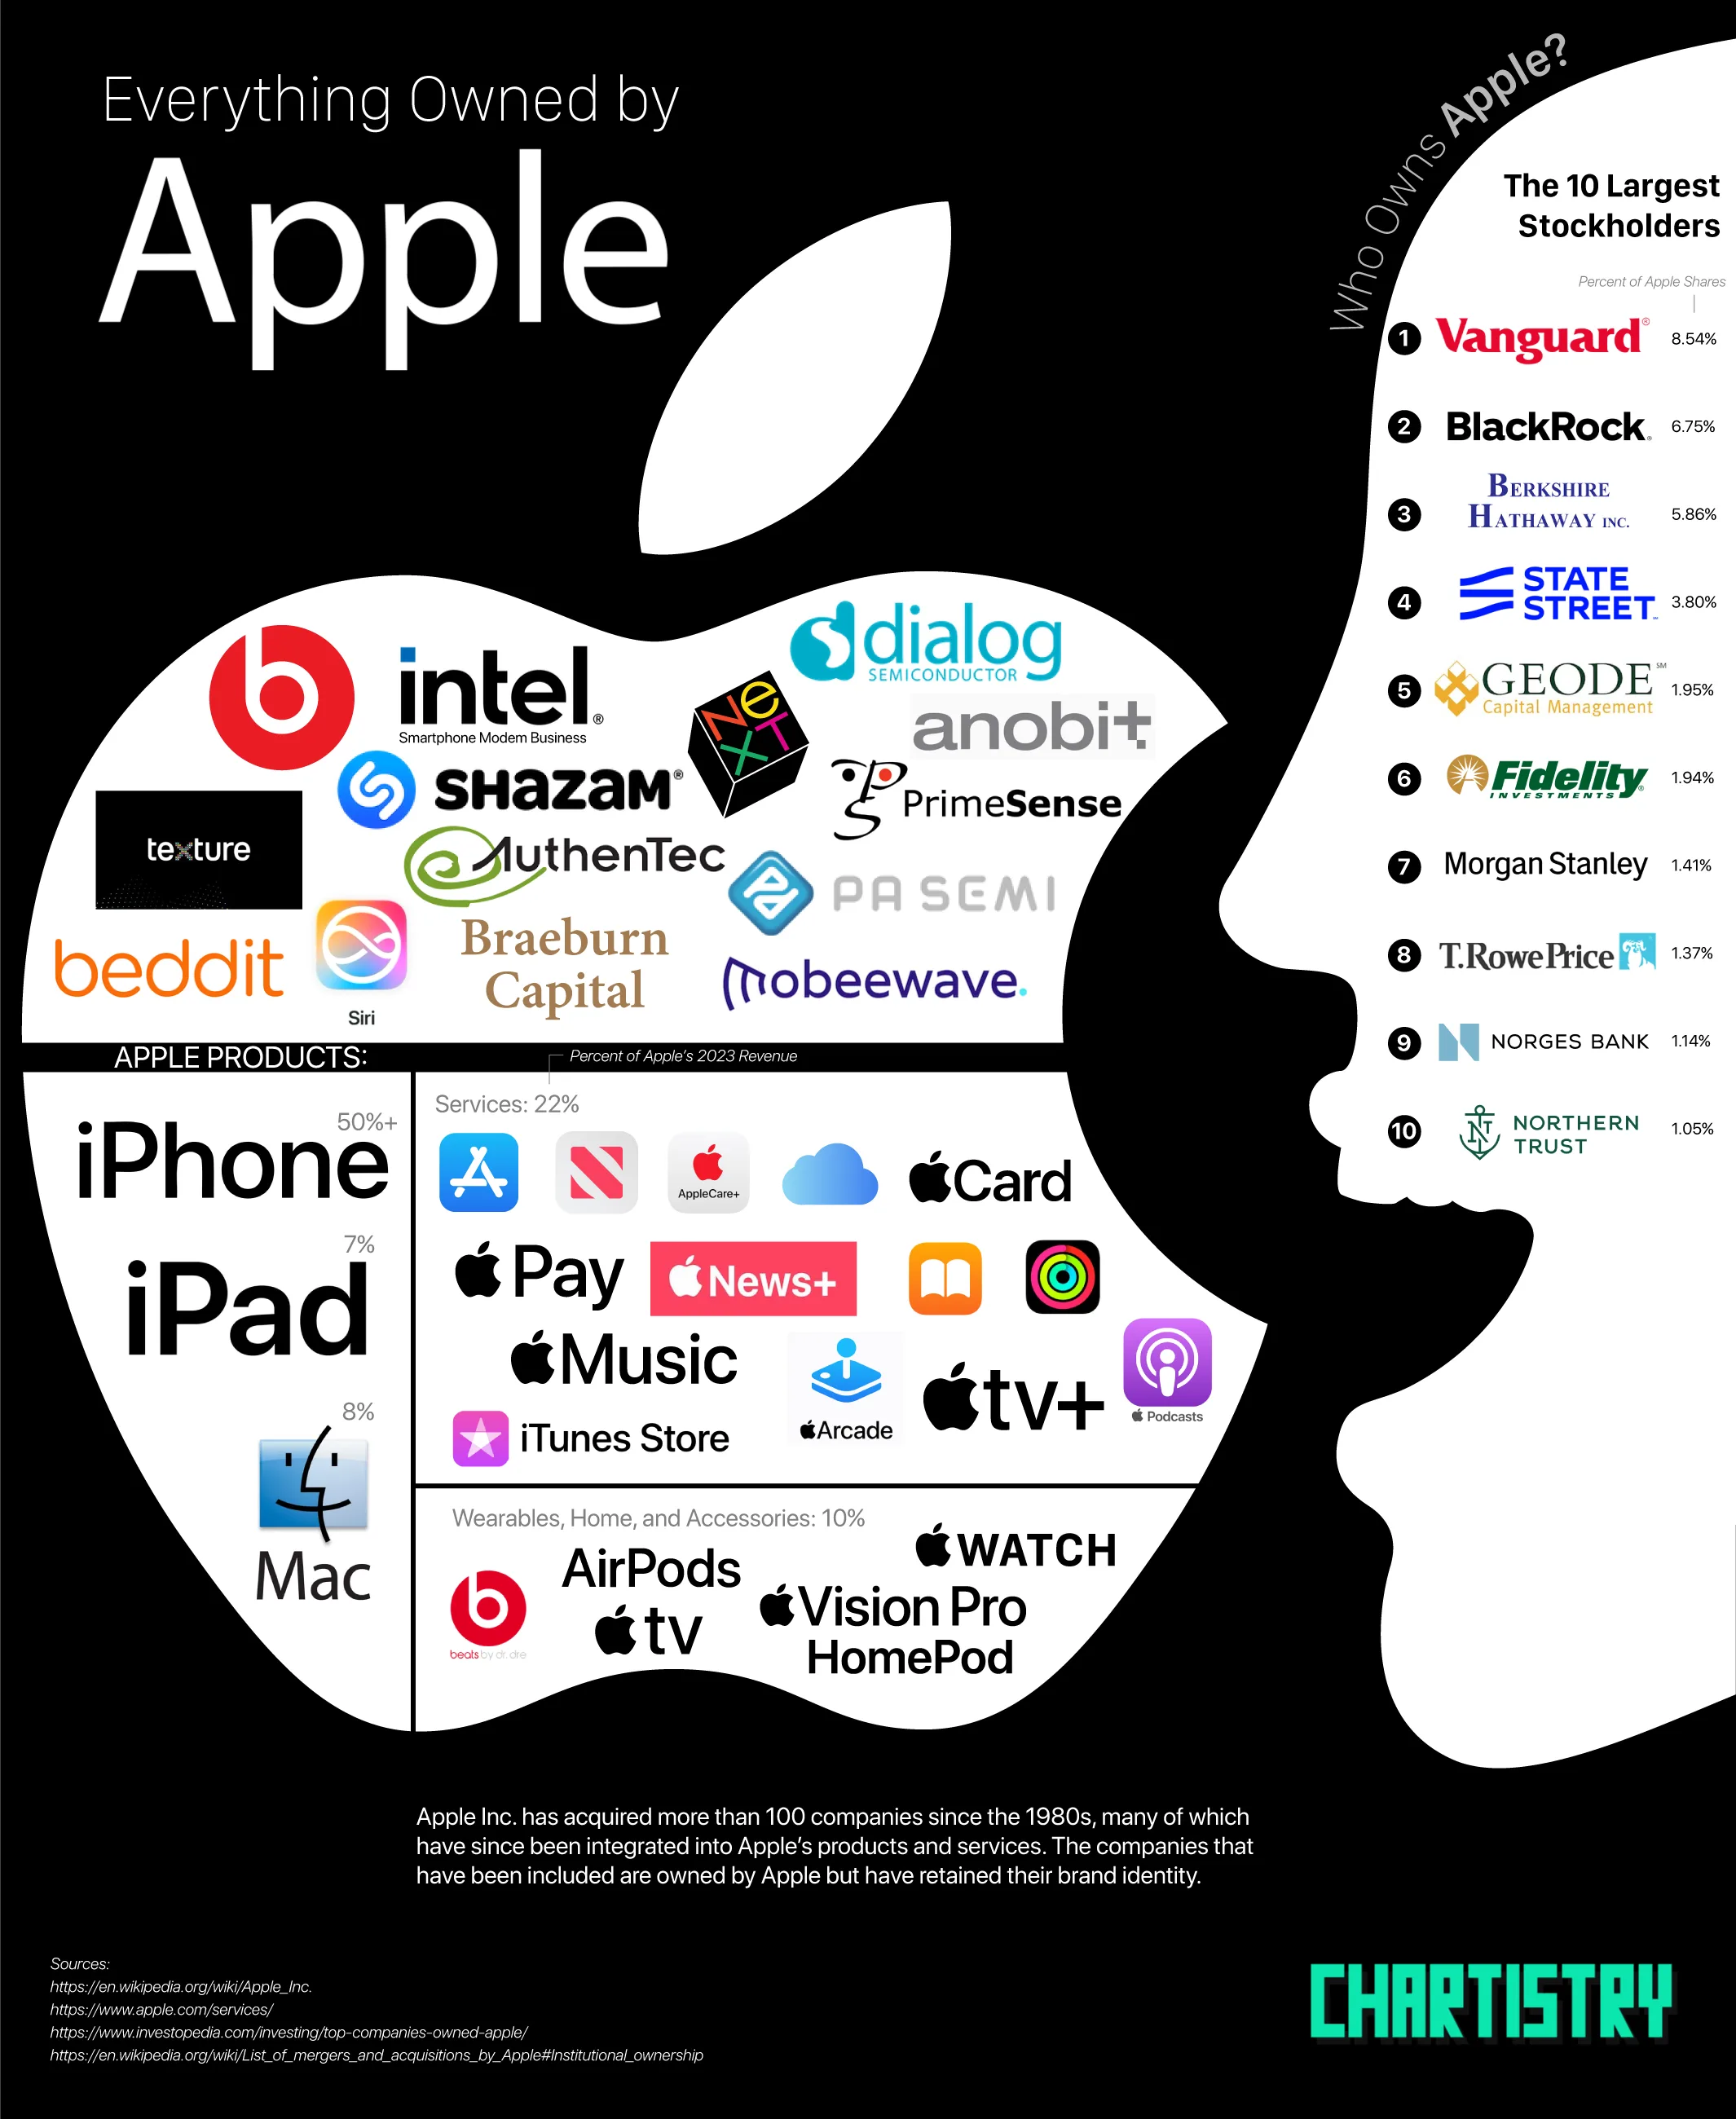
Apple Inc. has long been renowned for its innovation and cutting-edge contributions to technology. In the fifty years since its founding, Apple has gone from an obscure niche brand to one of the most well-known companies in the world. Throughout its history, Apple has acquired over 100 companies, some of which became core aspects of Apple’s brand. Since its inception, Apple has become nothing short of a cultural and economic phenomenon. This chart, which was created by the team at The Chartistry, takes a look at who founded Apple, the companies Apple owns, the many products they’ve created and sold throughout the years, and Apple’s largest stock holders.
Click below to zoom
A Brief History of Apple
Before it was the tech giant we know today, Apple had surprisingly humble roots. Apple Inc. was founded on April 1, 1976, by Steve Jobs and Steve Wozniak in Los Altos, California. As is legend at this point, the company was started in Jobs’ garage. There, the founders aimed to develop and sell personal computers, with a vision of changing the way the average person viewed home PCs. Their first product, the Apple I, laid the groundwork for future innovations, but it wasn’t until the Apple II’s release that they made a name for themselves with revolutionary color graphics.
After two decades competing with Microsoft in the home computer space, Apple became an unprecedented market leader in the portable MP3 space with the launch of the iPod in 2001. However, it was the creation of the iPhone in 2007 that truly elevated Apple to the great name we know today. Touted as one of the world’s most successful products, the iPhone’s many versions have sold billions of units, and allowed Apple Inc. to become the first company valued at one trillion dollars in 2018. Just two years later, it doubled that figure. Since the historic iPhone launch, Apple has released many new products to various success and increased their reach around the world through their profitable innovations and various company acquisitions.
What Companies Does Apple Own?
Since its beginnings as a home computer manufacturer, Apple has dramatically changed its operations to include a variety of products and services. Apple has acquired approximately 125 companies over its lifetime, many of which are still in operation today. Many of these were smaller companies that Apple incorporated into their products, such as FaceID being created from PrimeSense. PrimeSence was acquired by Apple in 2013.
In 2022, Apple’s CEO Tim Cook claimed Apple had acquired more than 100 companies over the preceding six years alone. Apple subsidiaries are only expected to increase as the brand continues its upward trajectory, though it’s important to note that their acquisition rate has slowed recently with the cooling of the investment in the tech sector since the start of the COVID-19 pandemic.
So far, Apple’s largest acquisition has been Beats at $3 Billion, followed by Intel at $1 Billion.
Apple’s Product Range
Currently, Apple Inc. has five main products: Macs, iPhones, iPads, accessories and services. Over the years, the company has shifted their primary focus from the home computer space in favor of the mobile device market, which has proven to be more lucrative. Though Apple has rarely been the first to introduce a product of its kind to the market, they have a history of redefining the market with their innovations to the field.
Mac
Personal computers have been the foundation of Apple’s product lineup since the beginning with Mac taking the mantle in 1979. Though they still compete with Microsoft in this space, Apple’s M1 and M2 chips have set new standards in the computing industry.
iPhone
In the era of flip phones and BlackBerry, the iPhone revolutionized the mobile phone industry and made smart phones the new global standard. Since then, each new generation of iPhone has introduced significant advancements in camera technology, processing power, and software features, solidifying its status as a market leader.
Apple Watch
The Apple Watch was introduced in 2014 and has quickly become the world’s most popular smartwatch. Combining fitness tracking, health monitoring, and communication features in a sleek, customizable design, it’s carved out a space as a health device as well as a smartphone accessory.
iCloud
iCloud, launched in 2011, is Apple’s cloud storage and computing service, which allows users to store data such as photos, documents, and music, and sync them across all their Apple devices. iCloud has become an integral part of the Apple ecosystem, ensuring seamless data management and providing services like iCloud Drive, iCloud Photos, and iCloud Backup.
Apple Pay
Apple Pay, introduced in 2014, is Apple’s mobile payment and digital wallet service. Thanks to its secure, contactless payments, integrated with the iPhone, Apple Watch, and other Apple devices, it has become a popular choice for digital transactions worldwide.
Who Owns Apple?
Apple’s stock market performance has been nothing short of remarkable. Since it first hit $1 trillion with the launch of the iPod, Apple’s continuous releases, innovations, and success have ranked it among the most valuable companies in the world. The company’s commitment to returning value to shareholders through dividends and stock buybacks further enhances its attractiveness as an investment.
As of January 2024, The Vanguard Group holds the largest percentage of Apple shares at 8.54%. Arthur Levinson, Chairman of the Board, takes the prize for individual shareholders, holding more than 4.5 million shares.
Apple Inc. is a cultural and financial juggernaut that continues to shape the modern world through its creative and strategic vision. From its humble beginnings in a garage to its status as a trillion-dollar company, Apple’s journey is a testament to its ability to adapt and lead. For investors and technology enthusiasts alike, Apple is a fascinating case study in the power of innovation and business strategy. Check out our business visualizations for more on topics like Apple, or take a look at all of the data visualizations on The Chartistry.
List of Companies Apple Owns
- Beats Electronics
- Intel Smartphone Modem Business (include S.M.D. under Intel logo)
- Dialog Semiconductor
- Anobit Technologies
- Texture
- Shazam
- NeXT
- PrimeSense
- AuthenTec
- PA Semi
- Beddit
- Braeburn Capital
- Claris
- Siri
- Mobeewave
Apple Products
| Apple Product | Percent of Company’s Revenue, end of 2023 |
| Mac | 8.00% |
| iPhone | 50%+ |
| iPad | 7.00% |
| Wearables, Home and Accessories | 10.00% |
| Airpods | |
| Apple Watch | |
| Apple TV | |
| Home Pod | |
| Vision Pro | |
| Beats Headphones | |
| Services: | 22.00% |
| App Store (advertising space) | |
| Apple News app (advertising space) | |
| AppleCare+ | |
| iCloud+ | |
| Apple Card | |
| Apple Pay | |
| Apple Books | |
| Apple Fitness+ | |
| Apple Music | |
| Apple News+ | |
| Apple TV+ | |
| Apple Arcade | |
| Apple Podcasts | |
| iTunes Store |
Who Owns Apple?
| # | The 10 Largest Stockholders | Percent of Apple Shares |
| 1 | The Vanguard Group | 8.54% |
| 2 | BlackRock | 6.75% |
| 3 | Berkshire Hathaway | 5.86% |
| 4 | State Street Corporation | 3.80% |
| 5 | Geode Capital Management | 1.95% |
| 6 | Fidelity Investments | 1.94% |
| 7 | Morgan Stanley | 1.41% |
| 8 | T. Rowe Price | 1.37% |
| 9 | Norges Bank | 1.14% |
| 10 | Northern Trust | 1.05% |


The invisible digital infrastructure is all around us. It powers every bank login, online order, every text sent, and every social media update posted. Vast networks that many of us rarely think about make these actions possible. Access to the digital infrastructure shapes a population’s economic standing and it even keeps entire governments running smoothly. Therefore, it’s no surprise that some countries spend huge sums to stay competitive in the digital infrastructure sector and there are clear winners as we can see in Ooma’s new study.
Click below to zoom.
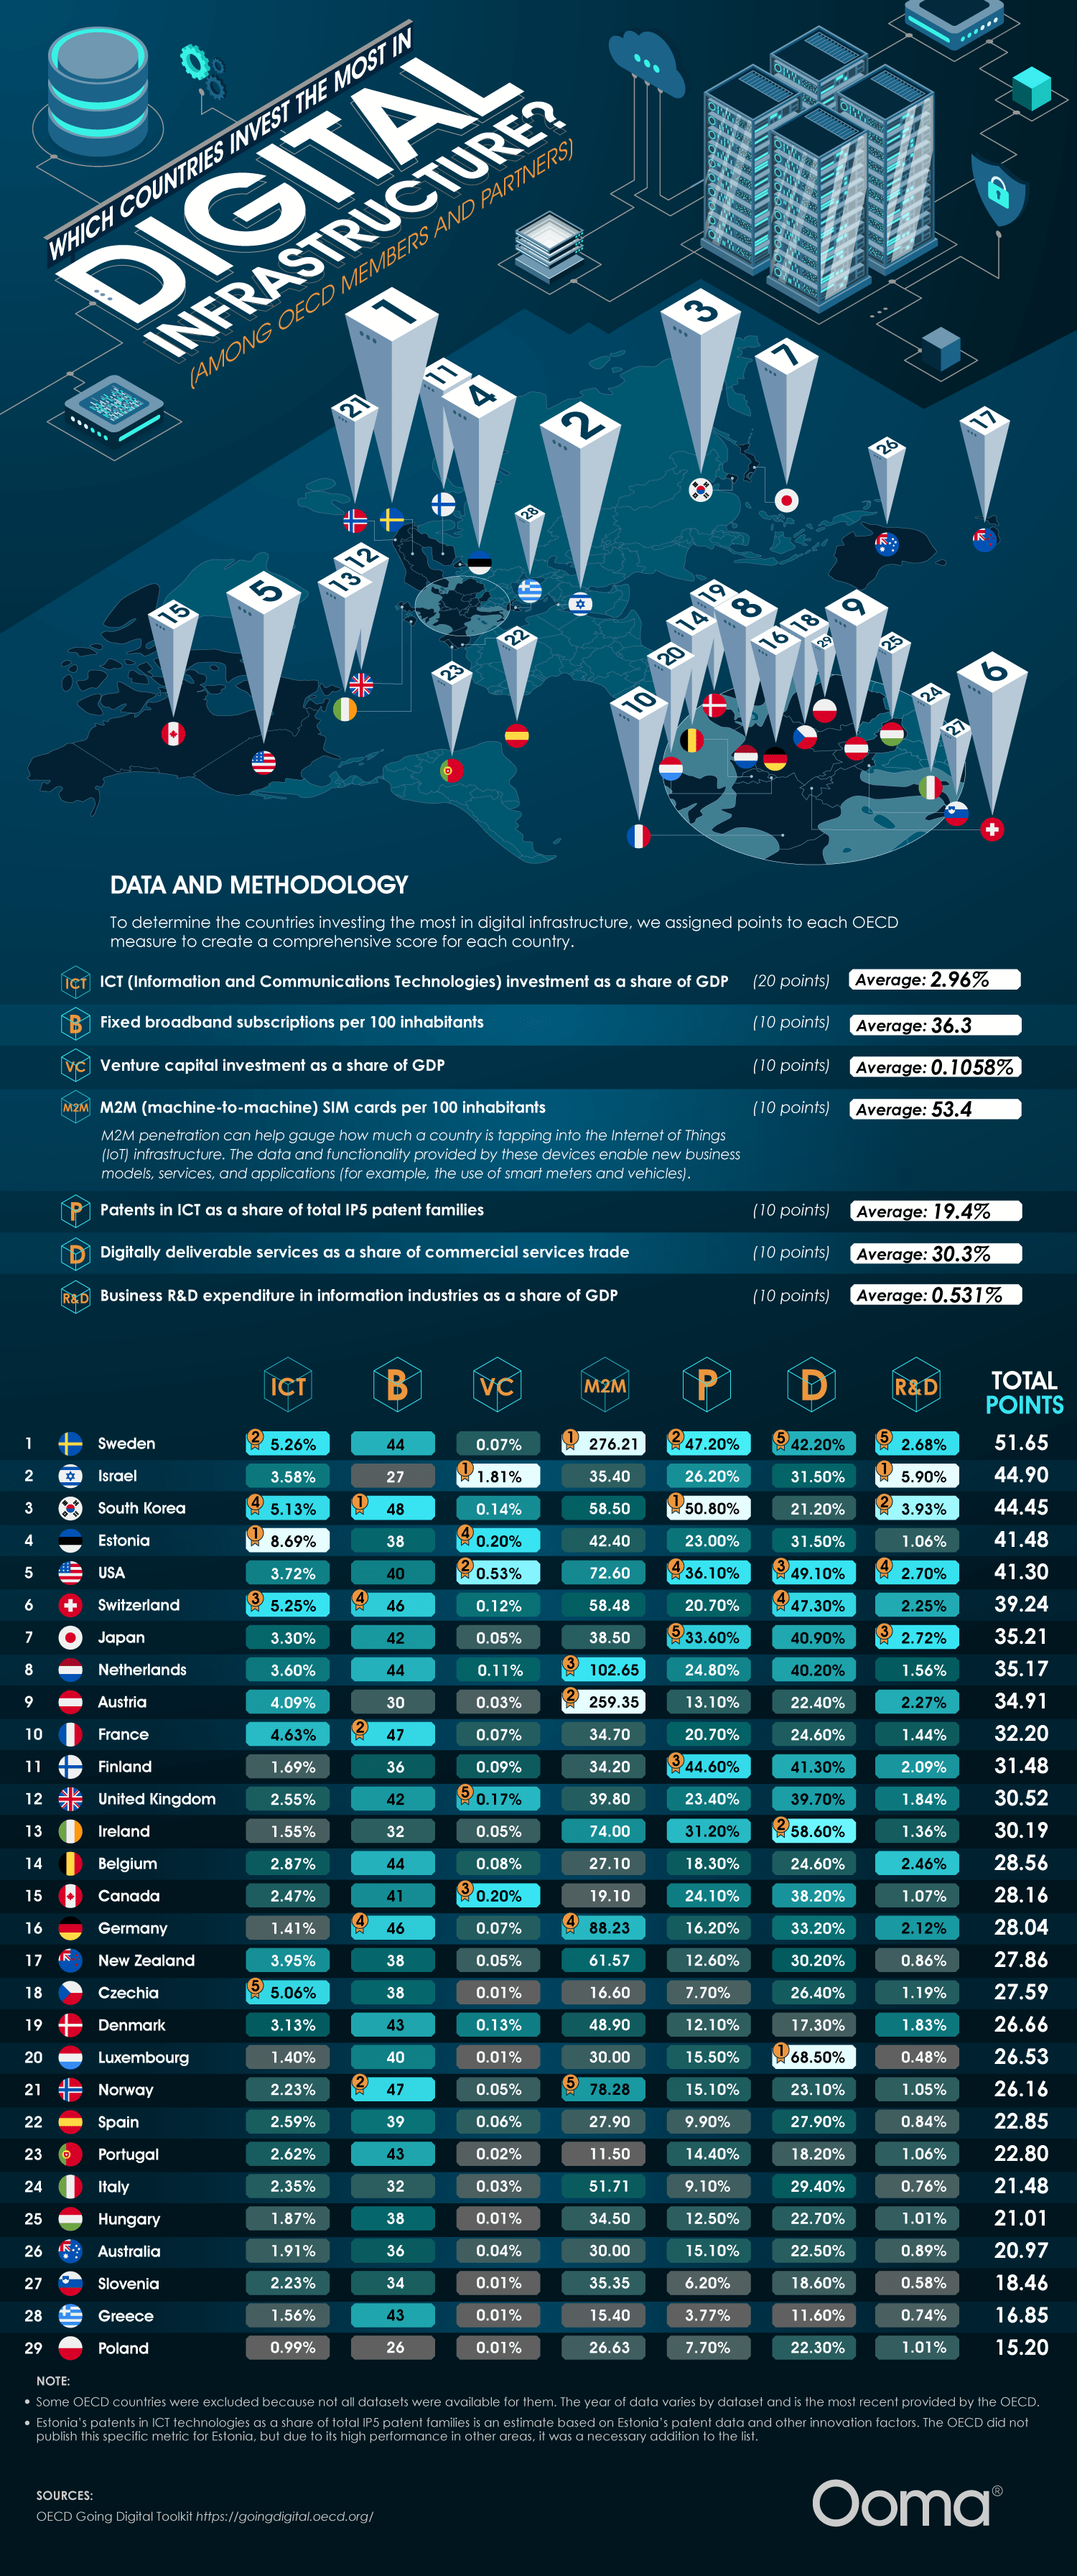
Think of this way: rather than roads and bridges, broadband networks, data centers, and cloud systems, the key to mobile connectivity is a country’s most valuable asset, which powers AI servers and social media. Advanced digital infrastructure correlates with higher GDP growth, higher productivity, a viable remote workforce, and a more digitally skilled workforce. These systems also allow faster access to government services, which can even be lifesaving since they offer quicker communication during emergencies like natural disasters.
The team’s study found 5 countries leading this digital infrastructure race. Sweden is in first place now with strong assets across the board, led by broadband subscriptions and business R&D spending. Israel is in second place with outsized venture capital relative to their GDP and heavy research funding into digital infrastructure. South Korea is in third, powered by ICT patents and top-tier broadband reach. Believe it or not, Estonia edges out the U.S. in fourth place. They’re a global digital pioneer with the most ICT investment as a share of GDP. The U.S. ranks #5, driven by digitally deliverable services and venture capital. The team used a points-based score across seven OECD measures, which include ICT investment, broadband, venture capital investment, M2M SIM cards, ICT patents, digital services trade, and business R&D.
These investments have a number of real-world impacts. In Estonia, they have nearly all their government services available online and a digital ID that can be used for everything from remote voting to public transport. Sweden has a highly developed e-commerce sector, universal household Internet connectivity, and, as a result, Stockholm is Europe’s financial hub. In Israel, the National Digital Agency and the Digital Israel initiative weave tech across education, government, and healthcare, transforming the country into a startup magnet. South Korea has one of the fastest Internet speeds globally and they dominate consumer electronics, competitive gaming, and semiconductors.
Countries investing in digital infrastructure are positioned to be world superpowers. Businesses in these countries benefit from fast communication and a digitally literate workforce. But seamless connectivity shouldn’t depend on geography. Every country and all people can benefit from a more digitally connected world, so the more countries that improve their digital infrastructure, the better. The leading countries on this chart can serve as role models while countries further down the list highlight areas for improvement and potential investment.
AI is embedded in workplaces worldwide by this point, and yet workers’ feelings about it vary dramatically. A study by Qualtrics examined how geography was related to feelings about AI in the workplace. They found that only 37% of workers globally believed that AI would improve their jobs. That average hides a 45-point difference between the most optimistic country, which is China, and the most skeptical, Japan.
Click here to zoom.
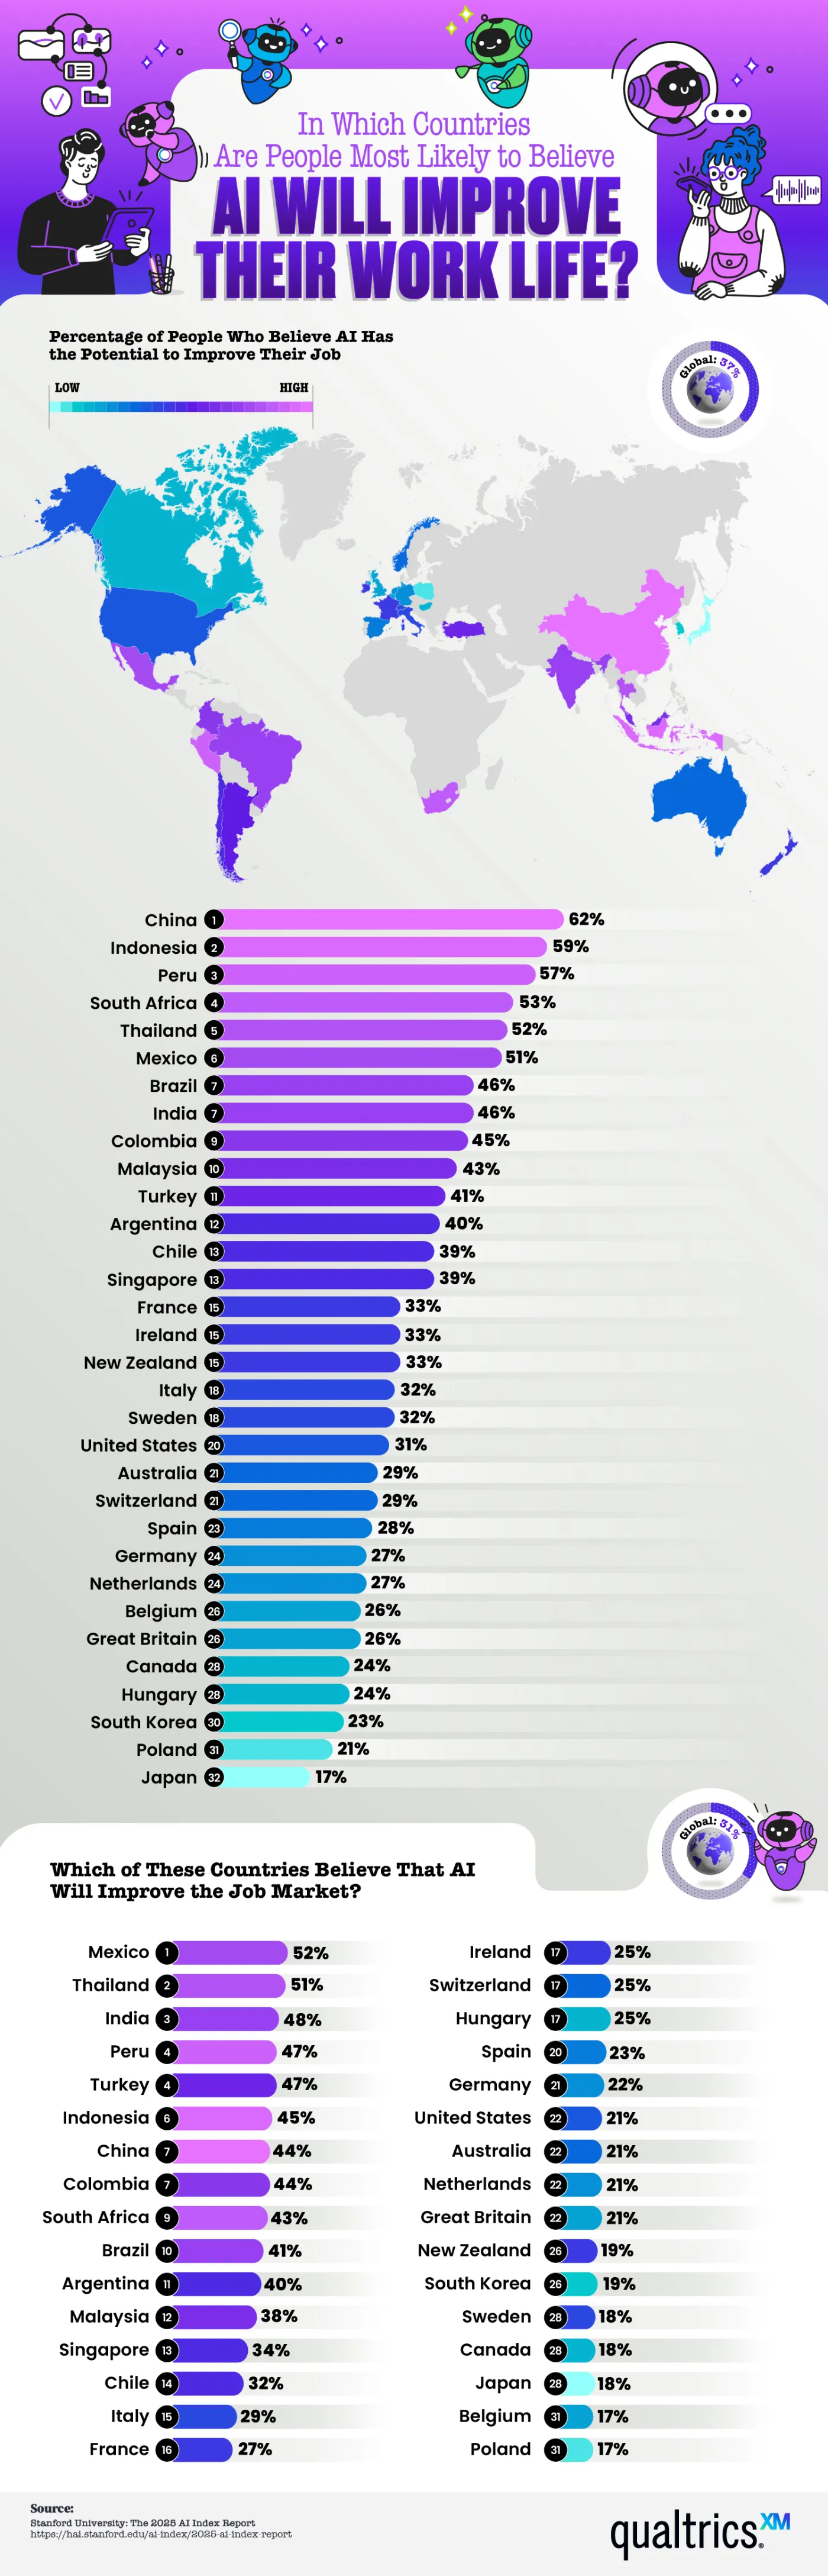
Nearly 80% of global companies report using AI in some capacity, and research indicates productivity gains, with lower-skilled workers benefiting the most. Even if this is the case, employee sentiment isn’t nearly as unified. The numbers the team shows here indicate a healthy level of AI skepticism. In fact, more than half of workers think AI will improve their lives in just 6 out of 32 countries studied. That means there are more skeptics than people excited about what AI will bring to the workplace. But why does optimism cluster in some regions while most remain skeptical?
Here are a few of the countries where optimism runs high:
- China – 62% of workers are optimistic
- Indonesia – 59%
- Peru – 57%
- South Africa – 53%
- Thailand – 52%
There is a mid-tier region with fewer optimistic workers, but still a healthy percentage. This includes Mexico, Brazil, India, Colombia, and Malaysia. Many of these countries have developing economies or a heavy state investment in AI infrastructure, as is the case in China. Workers in these places view AI as a tool to close skill gaps, raise wages, and improve living standards. These regional differences are easy to spot thanks to the map Qualtrics created, which color codes the level of optimism/skepticism.
At the other end of the spectrum, we find the highest number of skeptics in Western Europe and English-speaking countries. Here are the countries with the least faith in AI:
- United States – 31% of workers are optimistic
- Australia – 29%
- Great Britain – 26%
- Canada – 24%
- Japan – 17%
- Poland – 21%
The media narratives in these countries frame AI as a risk of automation-driven job loss, which shapes people’s perceptions even when AI adoption in their workplaces is the same as in optimistic locations. These nations are the same that rank lowest on the belief that AI will improve the job market.
Economic research suggests that AI tends to reshuffle tasks within a role rather than eliminate that job outright. New skills will be required to work with AI, and some positions will shift, but historically, new digital tools have created more roles than they’ve erased. The gap between the hard data and public sentiment in skeptical countries is definitely worth examining and tells a story.
As AI rolls out unevenly across the world’s workforce, it’s important for employers to understand where their employees actually stand on the issue. Beyond regional stereotypes or headline-driven assumptions, employers must look at facts like the data presented here to make thoughtful AI adoption decisions.
Logos are among the most dramatic and important aspects of marketing, shaping how consumers view a brand in ways that aren’t always visible. Logo designs are based on psychology, which informs us how shapes and colors make us feel, and how they can shape a brand’s trustworthiness and credibility. If a brand changes its logo, it must be done with care and intention, and with a clear reason to justify the switch. The team at LogoMaker displays the most effective logo switches and rebrands in a graphic based on increased web traffic.
Click below to zoom.
![]()
The team chose web traffic as an indicator of a successful logo because in the world of marketing, clicks and traffic are closely linked with sales and brand awareness. It’s a quantifiable way to measure customer behavior. The team used SEMrush traffic data to estimate traffic changes in the three months leading up to their rebrand announcement, compared with the two months after the launch. Their graph isolates traffic rates to the time of the rebrand to get the most accurate depiction of the effects. The team also helpfully included the old and new logos so readers can form their own opinions about changes.
According to the team’s results, these were the brands with the biggest traffic increases after their new logo launched:
- Pfizer
- MLB
- Premier League
- The Guardian
- Southwest
- VISA
- Target
- Jaguar
- IHOP
- Spotify
We see a wide range of industries represented in these results. Pfizer takes the lead after redesigning its logo from a pill shape to a double helix. This is also a good example of other factors, in addition to the rebrand, causing the traffic spikes. The rebrand occurred in 2021, the height of the COVID-19 pandemic, when the world was hoping for a company like Pfizer to develop an effective vaccine.
After Pfizer, we see a few sports leagues on the chart. Major League Soccer, or MLS, is in second place, followed by the UK’s Premier League in third. Both of them dramatically simplified their logos, making them clearer and possibly more memorable, as the increased traffic indicates. In fact, many of the companies on the list seem to have opted for simpler logo designs. This is quite possibly so the logos are more visible when they’re small, like on a phone screen. This could also reflect a changing aesthetic, shifting from the more stylized and classical designs of the 90s and 00s to today’s more bold, minimalist style.
The trend toward minimalist logo redesign reflects evolving consumer preferences and the demands of digital media. Companies across diverse industries, from pharmaceuticals to sports and retail, are embracing simpler, more impactful designs that enhance brand recognition and visibility in an increasingly mobile world. These changes not only boost traffic but also demonstrate how branding adapts to cultural shifts and technological advancements, helping organizations stay relevant and competitive in today’s fast-paced landscape.
-

 Business Visualizations2 years ago
America’s Most Valuable Companies Ranked by Profit per Employee
-

 Business Visualizations1 year ago
The Biggest Fortune 500 Company in Every State
-

 Business Visualizations1 year ago
The Biggest Employers by Industry
-

 Timelines2 years ago
Timeline Charts the Development of Communications Technology
-

 Business Visualizations9 months ago
The Largest Companies in America That Are Still Run by the Person Who Founded Them
-

 Charts2 years ago
Map Uncovers Countries with Most Powerful Passports
-

 Maps2 years ago
A Map to Gold and Silver
-
 Timelines2 years ago
The Evolution of Baby Names: A Century of Trends