Timelines
A History of the Oldest Flags in the World
The flag of Denmark has been in use since 1625, making it the oldest flag in the world that has been continuously used. Denmark’s national flag is called the Dannebrog. The white-on-red cross has been used as a symbol of Denmark allegedly since the 14th century, but it wasn’t until the 1600s that the current flag has been recognized as the country’s official flag.
Do you know the other flags that have been in continuous use the longest? The team at Wizard Pins examined flag designs from countries all around the world to visualize which ones have been continuously used by their respective countries the longest. Do you know which other countries have the oldest flags?
Click below to zoom
The countries with the oldest flags in continuous use include the following:
- Denmark (1625): Red background with a white Nordic cross
- Netherlands (1660): Horizontal bands of red, white, and blue
- Nepal (1743): The only irregularly-shaped flag consisting of two pennants with a red background (representing the color of the country’s national flower, the rhododendron) and a blue border (symbolizing the color of peace)
- United Kingdom (1801): The UK flag, also known as the Union Jack, is composed of the red cross of St. George, the saltire of St. Patrick, and the saltire of St. Andrew
- Chile (1817): The Chilean flag is composed of two equal horizontal bands of white and red with a blue square and five-pointed white star in the upper left corner
The flag of the United States, with all 50 stars and 13 states, was officially adopted in 1960.


Breakthroughs in technology can revolutionize industries and even give birth to new industries previously unimagined. The Qualtrics team explored the world’s most revolutionary products and services, arranged on a timeline that teaches us not only which tech has caused the biggest changes, but also how these developments interact with each other and advance technology and our lives as a whole. The timeline spans 1981 to 2022. It covers the realms of Computing and Internet, Entertainment and Media, and Mobile and Digital Services. Each item on the timeline has changed its industry and even changed the way humans live.
In the world of computing and Internet services, the timeline covers:
- IBM Personal Computer
- America Online
- Microsoft Windows 95
- Google Search Engine
- OpenAI ChatGPT
Click below to zoom.
The timeline covers the world of entertainment, featuring Sony PlayStation, Amazon, Craigslist, Netflix, Facebook, YouTube, and Nintendo Wii as the gamechangers. In the mobile and digital services realm, there’s a surprising diversity of products from smartphone models to apps like Uber to the Dyson DC01 Vacuum Cleaner, and even Red Bull energy.
It’s no secret that the personal computer revolutionized the business and computing industries. Before IBM’s PC, there was no market for personal computers; today, they’re a staple of modern life. Another 1980s brand, Red Bull, created a market where none previously existed. People traditionally get their caffeine fix from coffee, but energy drinks offer an easier-to-grab option on the go. Red Bull partnered with extreme-sports marketing to turn energy drinks into a lifestyle.
The timeline highlights AOL Instant Messenger as the Internet’s first big revolution. It’s a precursor to social media and helped make the World Wide Web a means of quick, easy communication. In 1998, Google Search Engines made the Internet an invaluable tool for knowledge. Google made it far easier to find websites of value on any topic under the sun (and even some beyond!)
From here on, the timeline is dominated by a range of innovative apps and Internet-based services. Amazon is the worldwide leader in e-commerce. It changed the way consumers shop forever, offering low prices, convenience, and fast delivery. Netflix changed the way people consume films and television by offering the first-ever streaming service. They offer an enormous library of new and old titles. No more waiting for a syndicated show to air. Netflix created a demand for “binge-worthy” content. The entertainment world touches every area of traditional arts and media. We see the Amazon Kindle changing how many book lovers read, offering a digital library that saves physical space and even money for some titles. Spotify became the leader of music streaming in 2008. Some think of it as the Netflix of music. Memberships offer unlimited streaming access to millions of songs and artists.
These are just a few of the industries that have been revolutionized by technology. We haven’t even touched on AI! Dive into the timeline to learn more about the most pivotal products and services of the modern era.
Ooma’s new article, “Advances in office technology and the upgrades that replaced them,” brings us on a sweeping journey through the history of the workplace, focusing on technological advances from the days of handwritten ledgers to the AI-infused systems used today. Their work goes beyond a retrospective and invites us to reflect on how today’s ordinary office tools were once revolutionary, replacing more labor-intensive methods. The team’s narrative tone and intuitive timeline design make the history of office technology feel relevant and dynamic. If you’re curious about how technology shapes the way we work, this timeline is for you.
Click below to zoom.
The article sets the scene by asking us to imagine an office without computers, phones, or instant messaging. The journey begins in a 15th-century scriptorium where monks copy texts by hand in a painstaking process. We move on to the first office building in London, which highlights the ways office spaces have transformed as technology advances.
The timeline traces a world of familiar office tech, including word processing, computing, communications, security, printing, and human resources. Each highlights a chapter in the pursuit of connectivity and efficiency. The timeline’s layout connects inventions such as the Gutenberg press, the first typewriter, and digital word processors like Microsoft Word. Fascinating facts add extra context to the information. For example, the IBM MT/ST was the first word processor that allowed edits without retyping pages, which surely seemed miraculous in an age of typewriters!
Office computing is perhaps the most important section. It traces our progress from the abacus, human calculations of rocket trajectories, ENIAC, and the first electronic computer. From there, it’s on to the Xerox Alto and IBM PC that revolutionized personal computing. Today’s laptops and AI assistants wouldn’t be possible without these predecessors.
Communication technologies are another fascinating subject featured here. Follow a path from pigeons and human messengers to the telegraph, the phone, the fax, email, VoIP, and on to modern platforms like Slack and Zoom. These technologies highlight how technology plays a huge role in the ways we communicate and collaborate.
The timeline doesn’t short us on details. It also addresses the development of office security and administration. We started with single human guards, then moved to private security firms, then to magnetic strip cards for building access, and finally to antivirus software. We can also take a look at how administrative jobs, like human resources, have evolved.
The timeline truly shines as a visual chart of technological evolution. Centuries of technological advances have been distilled into an easy-to-read map of progress. You can use this information as a quick reference or a detailed research document. It draws readers in, inviting us to learn more with clear visuals that break up text and make a complex history feel accessible and exciting. A well-crafted timeline transforms a historical overview into a story worth exploring, and that is exactly what this timeline accomplishes.
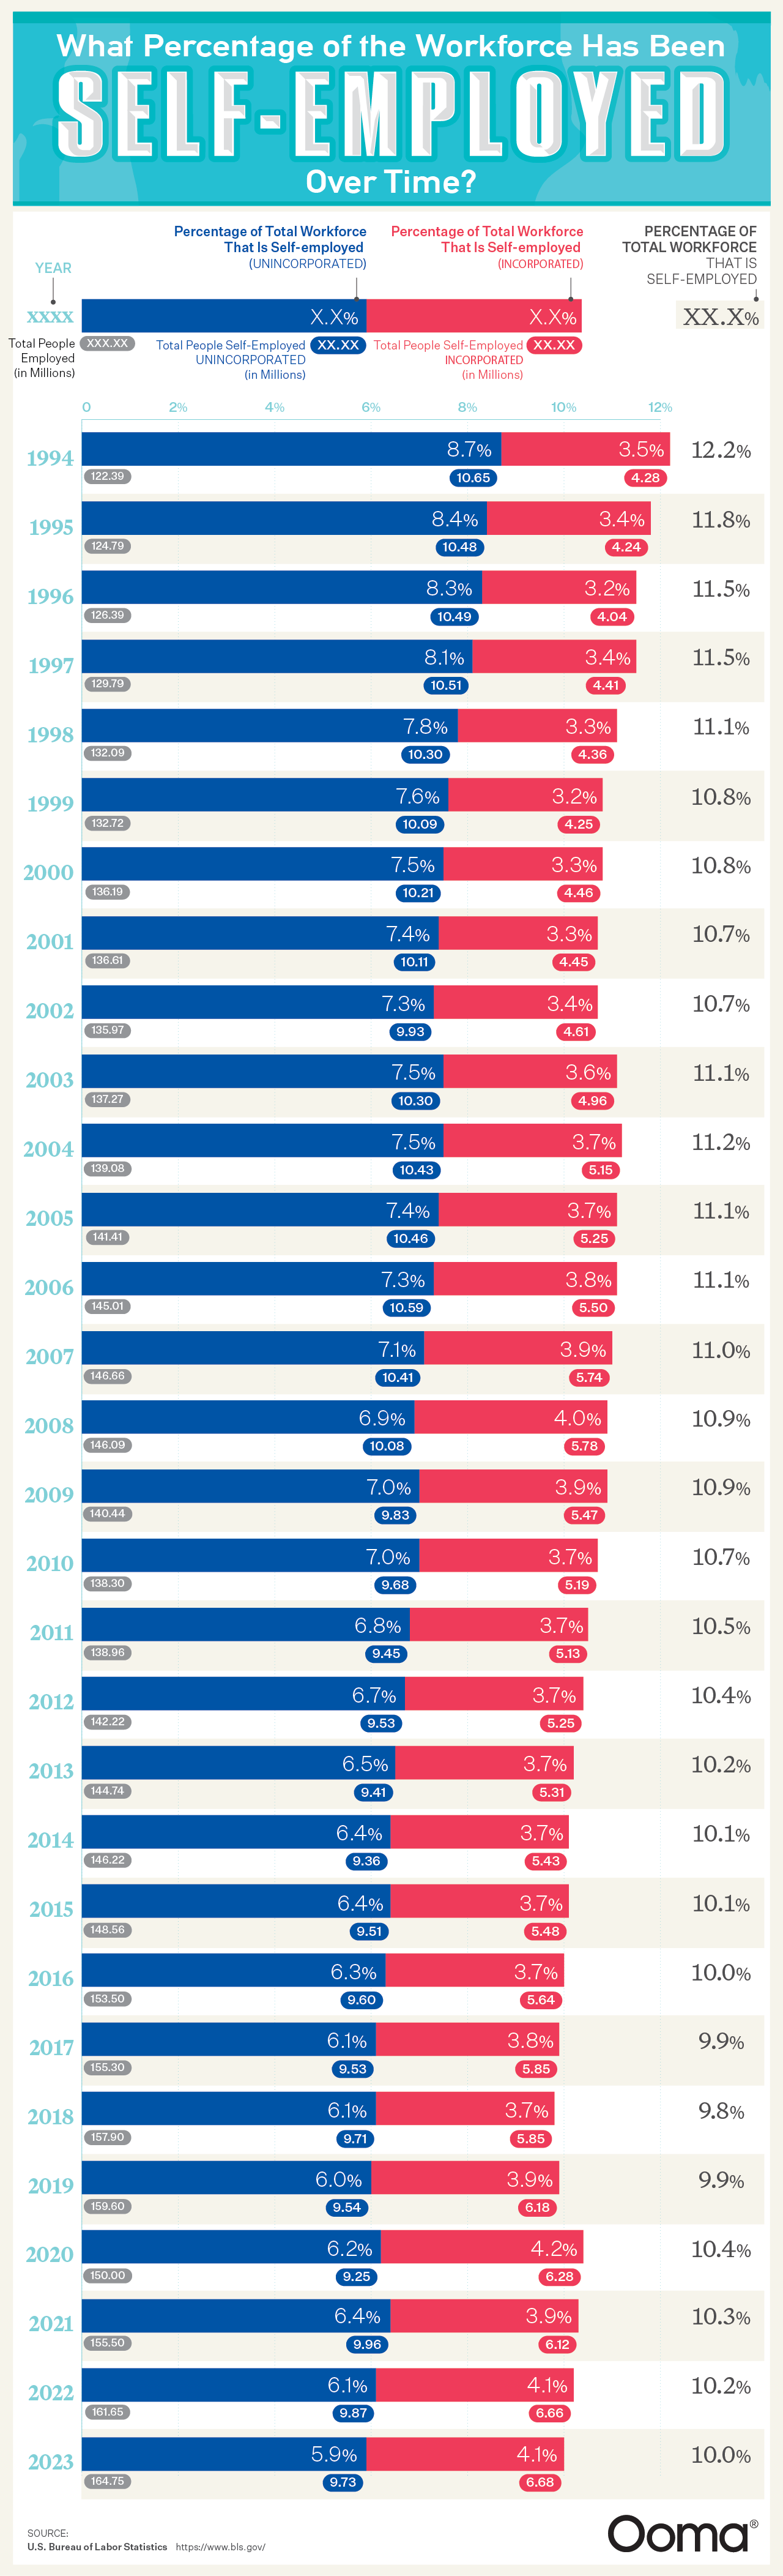
The U.S. economy and workforce landscape have seen many dramatic changes in the past three decades, not just in terms of trends, crises, and types of jobs workers pursue, but also in the way we work and structure careers. The team at Ooma created a new study displaying trending changes in self-employment. Their chart shows the percentage of the workforce that was self-employed each year. The numbers show that self-employment has always played a strong role in the American economy, with new Internet and digital industries pushing it to evolve. These changes present new opportunities and shake-ups to old work patterns.
Click below to zoom.
The Rise and Fall of Traditional Self-Employment
Ooma’s analysis is based on data from the U.S. Bureau of Labor Statistics. It shows that in 1994, self-employment represented 12.2% of the workforce. That’s 14.93 million Americans, a peak representing an economy where entrepreneurs, freelancers, contractors, and trades workers formed the backbone of the economy.
The next two decades saw a shift in self-employment, however. It declined to 9.8% by 2018, representing a shift to corporate employment in the era of social media and dot-com booms. The economy was recovering from a major recession that affected self-employed workers. Workers needed stability and benefits, and they turned away from gig work during the recession, with numbers plummeting to 59% in 2023.
The Impact of the Internet
Smartphone technology was developed in the late 1990s and perfected throughout the 2000s until it became a force that transformed the way we work. New apps like Uber, Instacart, and DoorDash ushered in a huge demand for gig work in the form of delivery drivers and people who could transform their own car into a taxi service. These platforms offered many work opportunities on top of a flexible schedule. People using these apps to get jobs could work whenever they wished.
Social media offered other exciting self-employment opportunities as we watched the rise of influencers and content creators who could market all kinds of digital goods and other services. A digital ecosystem made it more possible for personal brands to affordably market themselves to a wider audience.
The Pandemic as a Catalyst
The COVID-19 pandemic prompted huge changes in the way we work. Businesses closed down, layoffs surged, and many people looked for the quickest way to get flexible new employment. Self-employment options were the most accessible for many people. The self-employment workforce rose again to 4.2% in 2020. Many began to feel that starting their own business was more reliable than trusting a corporation. Marginalized people were especially drawn to self-employment, particularly women with families, and Black and Hispanic women. The flexible scheduling and greater power over work decisions was a more equitable fit for these women.
The team’s data proves that self-employment is so much more than just an alternative career choice. It can be an equalizer and drive American innovation. Self-employment can be a huge boost to local communities and continues to serve a vital role in our economy.
-

 Business Visualizations1 year ago
Everything Owned by Apple
-

 Business Visualizations1 year ago
America’s Most Valuable Companies Ranked by Profit per Employee
-

 Business Visualizations1 year ago
The Biggest Fortune 500 Company in Every State
-

 Business Visualizations10 months ago
The Biggest Employers by Industry
-

 Business Visualizations2 years ago
New Animated Map Shows Airbnb’s Fully Booked Cities Along the 2024 Eclipse Path of Totality
-

 Business Visualizations2 years ago
Everything the Luxury Giant LVMH Owns in One Chart
-

 Timelines1 year ago
Timeline Charts the Development of Communications Technology
-

 Charts2 years ago
How Many Crayola Crayon Colors Are There? A Lot.