Charts
A New Study Examines Infidelity in States Across America
NapLab looked at a sensitive topic for Americans everywhere by mapping survey results, which expose where people have engaged in and experienced the most infidelity. We can see from the results that cheating is, unfortunately, a very common experience, at least for the people who responded to the survey.
Click below to zoom.
The team’s data yields some surprising results. For example, 100% of respondents in North Carolina, Kentucky, and Alaska said they had cheated or been cheated on. Overall, in every state, over half the respondents said they have been cheated on. These are some hefty statistics.
Overall, these states ranked highest with residents most likely to cheat:
- Hawaii
- Louisiana
- Rhode Island
- Delaware
- Wyoming
- New Hampshire
- Maine
- North Carolina
- New Mexico
- Utah
These are the states where people are most likely to be cheated on:
- Kentucky
- Alaska
- Maryland
- North Carolina
- North Dakota
- Michigan
- West Virginia
- Oklahoma
- Maine
- South Carolina
Studies like this one can help us take steps to understand why infidelity occurs. Infidelity can be tricky to even define. Some may consider emotional involvement to be cheating, while others only consider physical romantic acts to be cheating. In other relationships, physical acts outside the relationship are acceptable as long as both partners are comfortable with them and the behavior stays within certain boundaries defined by the couple.
The data shows an interesting pattern, which is that more people reported being cheated on than cheating. This makes sense as cheating usually comes with a sense of shame. Not everyone admits to having cheated, but those who have been cheated on feel a sense of pain and outrage that makes them more likely to share their experience. Another interesting pattern is that the number of people who have self-reported that they cheated and have been cheated on is similar. That implies that many people have been both the cheater and the victim. How might that affect someone’s views on infidelity? The survey certainly leads to many more interesting questions.
People cheat for many varied reasons, including personal choices, social pressures, cultural norms, and dissatisfaction. Some couples say financial stress pushes them apart and builds resentment. The data may show some evidence for this, as low-income states like Kentucky and Louisiana rank highly on the list.
The team’s study leads to many more interesting questions to examine. For example, does age have anything to do with cheating rates? Studies seem to indicate it’s a yes. There have also been studies centered on gender, finding that men are more likely to cheat than women. Cultural factors are certainly impactful. A lot of research shows religious couples are less likely to cheat on one another, and the same is true in more conservative regions. This could be an inaccurate depiction, though, since stronger shame and taboos will make people more likely to carefully hide their infidelity and not admit to it. There’s no doubt that this study is a thought-provoking one.
Vacation rentals have opened up a whole new way to travel for people all over the world. Through platforms like Vrbo and Airbnb, travelers rent lofts, apartments, cottages, and ski chalets instead of a traditional hotel room. These options are very popular and can become a booming business for property owners. However, they come with their own set of risks to deal with. Property owners can take a well-rounded approach to guest and property safety by using Ooma’s pyramid chart, which displays the layers of vacation rental safety. They list the most important protections first and finish with insurance protection to top it all off.
Click below to zoom.
Here are the seven layers of safety according to Ooma:
- Access Control
- Life Safety Systems
- Perimeter Awareness
- Digital Protection
- Real-Time Monitoring
- Guest Education
- Liability Protection
Each layer comes with specific suggestions to implement safety precautions. Here’s the full list for property owners to check off:
- Keyless entry system, cloud-based access control software, physical key hidden away, reset lock access
- Smoke and carbon monoxide detectors, first aid kit, landline or VoIP service, fire code compliance, fire extinguishers
- Outdoor cameras, outdoor lighting, smart doorbells, fencing, and gates
- Secure Wi-Fi networks specific to guests, Wi-Fi password protection, and turn off unused smart devices
- Noise monitoring, occupancy monitoring, utility monitoring, environmental monitoring
- Guest safety guide, house rules, appliance instructions, emergency contacts, evacuation map
- Vacation rental insurance, local compliance, document safety steps
Short-term rentals come with some unique risks that owners must account for. Property damage is common when inviting strangers to stay in your home. These can be mild accidents, like stains from spills, or major issues, like appliance and utility malfunctions and damage. If guests are injured, owners are liable and must be covered by insurance. Wi-Fi networks can leave guests vulnerable to identity theft, so they must be properly secured. Guests should be aware of house rules, but may abuse them anyway, so activities like noise and occupancy levels should be monitored. Rental homes might be vulnerable to theft and squatters, too.
The team offers additional tips for each layer of safety. They suggest providing easy-to-find first aid kits for guests, following all fire code compliance, setting up outdoor cameras and motion-activated lighting, smart doorbells, turning off unused smart devices, creating a guest rule book, posting an evacuation map and emergency contacts, and documenting each step you’ve taken to provide a safe guest experience.
On top of all this, vacation rental owners need to make sure they keep up on cleanliness and safety inspections. Guests should also be aware of hazards that could cause a slip and fall accident and make sure they’ve taken due diligence in securing their property. All of these steps can help property owners run a successful vacation rental business while keeping guests safe and the property in peak condition. All vacation rental owners can learn something from the team’s layered approach to vacation rental safety.
The Oxi Fresh team has revealed the state of home cleanliness across the United States with a map ranking states by their score on the custom-made Oxi Fresh Home Cleanliness Index. Cleanliness can vary by cultural definitions and factors like busy lives can make our homes less clean than we would like. Studies have found that Americans spend about eight hours a month cleaning their homes. The team offers us a more in-depth look at the state of American cleanliness in their maps.
Click below to zoom.
The team formed the Home Cleanliness Index based on responses to survey questions. Five questions assessed how often residents perform specific cleaning tasks, like vacuuming, dusting, cleaning bathrooms, and changing bed sheets. They were also asked to rate their home’s cleanliness, the amount of clutter in their home, and how comfortable they would be with unexpected guests seeing their home in its current state. Lastly, the team asked whether residents in these states use a professional cleaning service.
These 10 states had the highest scores on the index:
- Wyoming
- Delaware
- Rhode Island
- Kansas
- Iowa
- Idaho
- Minnesota
- Arkansas
- Connecticut
- Tennessee
Wyoming residents are the cleanest, and they know it! 96% of them would be proud to have unexpected guests over who see the state of their home as it is. Wyoming homeowners deep-clean their carpets the most, mop the most, and change their bed linens the most often. It seems Wyoming homemakers prioritize cleaning and take great pride in their homes.
On the other side of the coin, these were the states with the lowest scores:
- New Hampshire
- North Carolina
- Maryland
- Maine
- Oregon
- Oklahoma
- Hawaii
- North Dakota
- Washington
- Utah
Utah had the lowest score overall at 69.76 out of 180 points. Utah residents reported the lowest scores for home cleanliness, but their data lends some credence to this. They dust, vacuum, and mop the least frequently. Utah may struggle with cleanliness due to its poor air quality. It has some of the worst air quality in the United States, with dust drifting in from the Great Salt Lake playa, as well as high emissions from gasoline vehicles and wood-burning stoves. Utah residents may feel they’re fighting a losing battle against dust, dirt, and grime and have lowered their standards.
There are many fun and interesting facts to glean from the team’s data. Delaware residents vacuum and mop the most, while Vermont residents maintain the cleanest kitchens with the highest number of kitchen counter wipe-downs. People in Iowa are the most likely to hire a professional cleaner. Arizona residents mop the least, maybe because the dry environment keeps out mud. Georgia and Arizona residents vacuum their carpets the least, but perhaps carpets and rugs aren’t as popular in these warm states. The data gathered here provide numerous opportunities to reflect on how various state factors may influence cleaning standards and norms.
Business Visualizations
The Largest Companies in America That Are Still Run by the Person Who Founded Them
In the corporate world, leadership changes are practically expected. CEOs come and go, boards shuffle seats, and strategies pivot with the seasons. For most large corporations, the founding vision eventually gives way to the influence of successors, but every once in a while, a company manages to scale the peaks of the Fortune 1000 while still being led by the very person who dreamed it up in the first place.
Going from running a business out of your garage to managing a multi-billion-dollar operation requires an impressive mix of genius, grit, and endurance that most would struggle to sustain across decades of board meetings, bold bets, and bottom-line pressure.
So, what does it take to build a business worth billions and still be the one calling the shots? To find out, our team at The Chartistry has pulled together a graphic that maps out the largest companies in the U.S. that are still being run by the same people who started them.
Click below to zoom.
Tech Giants Still Calling the Shots
The tech industry can be a volatile market, especially when billions of dollars are at stake every year, making founder-CEOs in this space a rare species. Mark Zuckerberg, founder and CEO of Facebook (now Meta), is a headline example. From the scrappy days of coding in his Harvard dorm to overseeing Meta’s $134.9 billion revenue machine, he hasn’t let go of the reins. His company now ranks 30th on the Fortune 1000 list, but it continues to operate under the umbrella of Zuckerberg’s vision.
Jensen Huang of NVIDIA is another powerhouse. He co-founded the company in 1993 and continues to lead it as CEO and President. NVIDIA is now a central player in the AI boom, raking in over $60.9 billion in 2024. The company landed at #65 on the Fortune list, and much of that momentum can be traced back to Huang’s technical savvy and leadership style.
Another founder-CEO of a big tech company is Michael Dell. After founding Dell Technologies in 1984, Dell stepped away briefly before returning to steer the company through its privatization and subsequent return to public markets. With $88.43 billion in revenue, it holds spot #48 on the list.
Long-Hauler Founders of the Biggest U.S. Companies
Wall Street can be brutal, yet some of the longest-tenured company founders make the ranks in this industry. Richard Fairbank has run Capital One since 1987, long before online banking was the norm. Under his leadership, the company pulled in $49.48 billion last year.
Larry Fink’s story is equally impressive. He co-founded BlackRock in 1988 and helped turn it into the world’s largest asset manager. It now generates $17.86 billion annually.
Then there’s Mark Millett, who co-founded Steel Dynamics in 1993. It might not make splashy headlines like tech and finance, but this steel manufacturer generated $18.8 billion last year, proving that innovation can lead to immense success in any space.
Is Elon Musk Actually the Founder of Tesla?
Elon Musk is arguably the most high-profile figure on the list, but his relationship with Tesla’s origins is less straightforward than the others on our list. Tesla was actually founded by Martin Eberhard and Marc Tarpenning in 2003. Musk joined shortly after as an investor and took a more active role over time. It wasn’t until a legal settlement in 2009 that Musk was “officially” determined to be a co-founder, along with four others. Today, he serves as the CEO and public face of Tesla, a company that posted $96.77 billion in revenue in 2024.
Why Are They Still Here?
While circumstances vary and some CEO-Founders stick around long after what’s best for the company, research seems to support that many of them remain the right person for the job. A Harvard Business Review study found that companies led by their founders outperformed others in market valuation by 10% over the long term. Especially in the early days when the potential rewards are higher, founders tend to prioritize innovation, take bigger strategic bets, and maintain a stronger emotional commitment to the company’s mission.
Additionally, founder-CEOs often make faster decisions, have deeper customer intuition, and are more adaptable when navigating new markets. These traits help fuel long-term growth and can serve as a stabilizing force in times of disruption. That said, success depends on their ability to scale alongside the business. The most effective founders seem to grow their leadership style as the company matures, surrounding themselves with experienced teams while staying grounded in the original vision.
In many cases, large companies will also adopt dual-class stock structures, which help founders maintain some control even as ownership becomes more distributed.
Out of the 1,000 biggest companies in America, only 59 are still run by their founders. Amounting to less than 6 percent, it’s both inspiring and daunting how successful many of their companies have become.
Along with shaping industries and building legacies, they’re keeping their original visions alive in a world that often trades the leadership of innovative founders for business-savvy executives. Their stories serve as a reminder that leadership is about commitment and conviction as much as it is about keeping a business running.
At The Chartistry, we know that there’s a great story behind every dataset. Explore more trends in executive leadership, company growth, and market innovation in America’s largest companies on our Business Visualization page. Or, if you’re looking for more inspiring stories of success, check out our Finance Visualizations.
Founders of Major Corporations Still Serving as CEO
The list of America’s largest companies that are still run by the person who founded them is based on data from Fortune’s list of the 1,000 biggest companies in the United States. Just 59 of the 1,000 biggest U.S. companies are still run by the person who founded them. The founder must be the current Chief Executive Officer (CEO) of the company, as of June 2025, to be included.
| Rank | Company | Forbes 1000 Rank (as of July 2024) |
Revenue in Billions (as of July 2024) |
CEO Name | Year Founded | Title (as of June 2025) |
| 1 | Meta Platforms | 30 | $134.90 | Mark Zuckerberg | 2004 | Co-Founder, CEO, Chairman |
| 2 | Tesla | 40 | $96.77 | Elon Musk | 2003 (Musk was designated as one of five co-founders in 2009 via a settlement.) |
Co-Founder, CEO |
| 3 | Dell Technologies | 48 | $88.43 | Michael Dell | 1984 | Founder, CEO, Chairman |
| 4 | NVIDIA | 65 | $60.92 | Jensen Huang | 1993 | Co-Founder, CEO, President |
| 5 | Capital One Financial | 91 | $49.48 | Richard Fairbank | 1987 | Co-Founder, CEO, Chairman |
| 6 | Salesforce | 123 | $34.86 | Marc Benioff | 1999 | Co-Founder, CEO, Chairman |
| 7 | Apollo Global Management | 136 | $32.64 | Marc Rowan | 1990 | Co-Founder, CEO, Chairman |
| 8 | Coupang | 168 | $24.38 | Bom Kim | 2010 | Founder, CEO, Chairman |
| 9 | Block | 186 | $21.92 | Jack Dorsey | 2009 | Co-Founder, CEO, Chairman |
| 10 | Steel Dynamics | 221 | $18.80 | Mark Millett | 1993 | Co-Founder, CEO, Chairman |
| 11 | BlackRock | 231 | $17.86 | Larry Fink | 1988 | Co-Founder, CEO, Chairman |
| 12 | Regeneron Pharmaceuticals | 311 | $13.12 | Leonard Schleifer | 1988 | Co-Founder, CEO, President, Co-Chairman |
| 13 | Wayfair | 346 | $12.00 | Niraj Shah | 2002 | Co-Founder, CEO, Co-Chairman |
| 14 | Carvana | 377 | $10.77 | Ernest Garcia III | 2012 | Co-Founder, CEO, President, Chairman |
| 15 | Airbnb | 396 | $9.92 | Brian Chesky | 2008 | Co-Founder, CEO |
| 16 | Intercontinental Exchange | 397 | $9.90 | Jeffrey Sprecher | 2000 | Founder, CEO, Chairman |
| 17 | Sanmina | 433 | $8.94 | Jure Sola | 1980 | Co-Founder, CEO, Chairman |
| 18 | DoorDash | 443 | $8.64 | Tony Xu | 2013 | Co-Founder, CEO |
| 19 | Prologis | 463 | $8.02 | Hamid Moghadam | 1983 | Co-Founder, CEO, Chairman |
| 20 | Blackstone | 464 | $8.02 | Stephen Schwarzman | 1985 | Co-Founder, CEO, Chairman |
| 21 | Skechers U.S.A. | 465 | $8.00 | Robert Greenberg | 1992 | Founder, CEO, Chairman |
| 22 | Super Micro Computer | 498 | $7.12 | Charles Liang | 1993 | Co-Founder, CEO, Chairman, President |
| 23 | Insperity | 541 | $6.49 | Paul Sarvadi | 1986 | Co-Founder, CEO, Chairman |
| 24 | Under Armour | 577 | $5.90 | Kevin Plank | 1995 | Founder, CEO, Chairman, President |
| 25 | SS&C Technologies Holdings | 600 | $5.50 | William Stone | 1986 | Founder, CEO, Chairman |
| 26 | Fortinet | 622 | $5.31 | Ken Xie | 2000 | Founder, CEO, Chairman |
| 27 | Urban Outfitters | 635 | $5.15 | Richard Hayne | 1970 | Co-Founder, CEO, Chairman |
| 28 | Ares Management | 644 | $4.99 | Michael Arougheti | 1997 | Co-Founder, CEO, Director |
| 29 | Nexstar Media Group | 648 | $4.93 | Perry Sook | 1996 | Founder, CEO, Chairman |
| 30 | Compass | 654 | $4.89 | Robert Reffkin | 2012 | Co-Founder, CEO |
| 31 | EPAM Systems | 669 | $4.69 | Arkadiy Dobkin | 1993 | Co-Founder, CEO, Chairman, President |
| 32 | Antero Resources | 670 | $4.68 | Paul Rady | 2002 | Co-Founder, CEO, Chairman, President |
| 33 | Snap | 679 | $4.61 | Evan Spiegel | 2011 | Co-Founder, CEO, Director |
| 34 | Zoom Video Communications | 683 | $4.53 | Eric Yuan | 2011 | Founder, CEO, Chairman, President |
| 35 | Rivian Automotive | 692 | $4.43 | RJ Scaringe | 2009 | Founder, CEO |
| 36 | PriceSmart | 697 | $4.41 | Robert Price | 1993 | Co-Founder, CEO (until Sept. ‘25), Chairman |
| 37 | eXp World Holdings | 708 | $4.28 | Glenn Sanford | 2008 | Founder, CEO, Chairman |
| 38 | Toast | 766 | $3.87 | Aman Narang | 2012 | Co-Founder, CEO, Director |
| 39 | Akamai Technologies | 771 | $3.81 | Dr. Tom Leighton | 1998 | Co-Founder, CEO |
| 40 | ScanSource | 776 | $3.79 | Michael Baur | 1992 | Co-Founder, CEO, Chairman |
| 41 | Dream Finders Homes | 784 | $3.75 | Patrick Zalupski | 2008 | Co-Founder, CEO, Chairman, President |
| 42 | Century Communities | 794 | $3.69 | Robert Francescon | 2002 | Co-Founder, CEO, President, Director |
| 43 | Euronet Worldwide | 796 | $3.69 | Michael Brown | 1994 | Co-Founder, CEO, Chairman, President |
| 44 | DraftKings | 798 | $3.67 | Jason Robins | 2011 | Co-Founder, CEO, Chairman |
| 45 | Atlassian | 811 | $3.54 | Mike Cannon-Brookes | 2002 | Co-Founder, CEO |
| 46 | Roku | 820 | $3.49 | Anthony Wood | 2002 | Founder, CEO, Chairman |
| 47 | Cheesecake Factory | 828 | $3.44 | David Overton | 1972 | Co-Founder, CEO, Chairman |
| 48 | Chefs’ Warehouse | 830 | $3.43 | Christopher Pappas | 1985 | Co-Founder, CEO, Chairman, President |
| 49 | AppLovin | 847 | $3.28 | Adam Foroughi | 2012 | Co-Founder, CEO, Chairman |
| 50 | PACS Group | 869 | $3.11 | Jason Murray | 2013 | Co-Founder, CEO, Chairman |
| 51 | Coinbase Global | 870 | $3.11 | Brian Armstrong | 2012 | Co-Founder, CEO, Chairman |
| 52 | CrowdStrike | 883 | $3.06 | George Kurtz | 2011 | Founder, CEO |
| 53 | Matador Resources | 930 | $2.81 | Joseph Wm. Foran | 2003 | Founder, CEO, Chairman |
| 54 | Viasat | 932 | $2.80 | Mark Dankberg | 1986 | Co-Founder, CEO, Chairman |
| 55 | Roblox | 935 | $2.80 | David Baszucki | 2004 | Co-Founder, CEO |
| 56 | ProFrac Holding | 971 | $2.63 | Ladd Wilks | 2016 | Co-Founder, CEO |
| 57 | Playtika Holding | 982 | $2.57 | Robert Antokol | 2010 | Co-Founder, CEO, Chairman |
| 58 | Stagwell | 993 | $2.53 | Mark Penn | 2021 | Founder, CEO, Chairman |
| 59 | Dropbox | 997 | $2.50 | Drew Houston | 2007 | Co-Founder, CEO |
Sources:
Corporate Websites
-

 Business Visualizations1 year ago
Everything Owned by Apple
-

 Business Visualizations12 months ago
America’s Most Valuable Companies Ranked by Profit per Employee
-

 Business Visualizations5 months ago
The Biggest Employers by Industry
-

 Business Visualizations8 months ago
The Biggest Fortune 500 Company in Every State
-
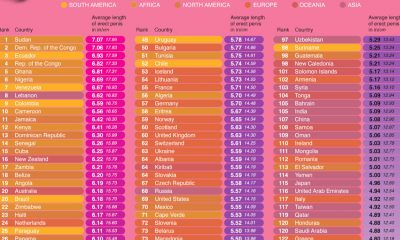
 Maps2 years ago
Penis Lengths Around the World
-
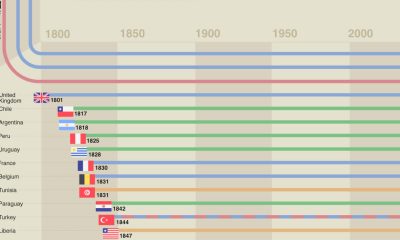
 Timelines2 years ago
A History of the Oldest Flags in the World
-
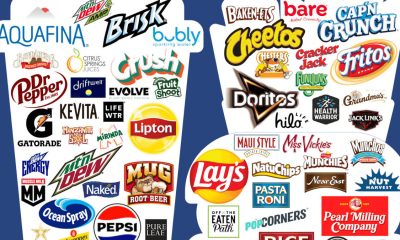
 Business Visualizations2 years ago
All The Brands Owned By PepsiCo
-

 Business Visualizations2 years ago
New Animated Map Shows Airbnb’s Fully Booked Cities Along the 2024 Eclipse Path of Totality