Charts
The Countries With the Fastest Internet Speeds in the World
Singapore is home to the fastest average internet speed in the world, where the average download speed is an incredible 238.59 megabits per second. There are many theories as to why this is, with what being that Singapore was founded with a compact and easily upgradable infrastructure. Not only that, but in Singapore, the economic freedom has led to a society that’s more high-speed and connected.
From Hewlett Packard, this visualization takes a look at where in the world you can find the fastest internet speeds, both in terms of average broadband and mobile speeds.
Click below to zoom
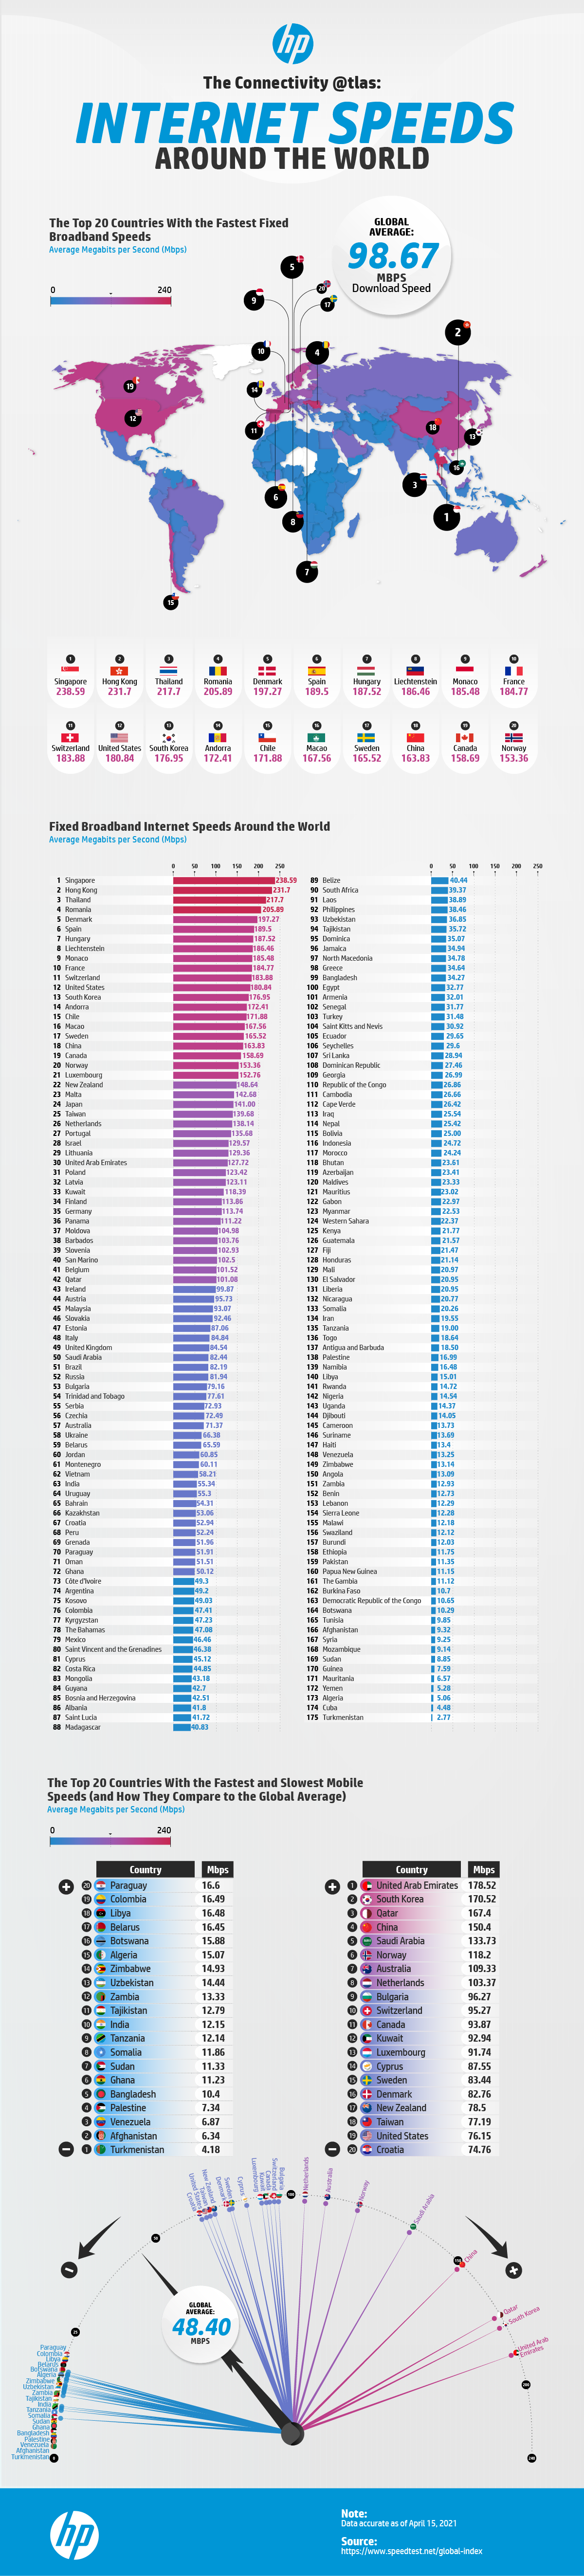
The fastest fixed broadband internet in the world can be found in Singapore, where the average speed is 238.59 megabits per second. According to the data, these are the 20 countries with the fastest fixed broadband internet.
- Singapore: 238.59 megabits per second
- Hong Kong: 231.70 megabits per second
- Thailand: 217.70 megabits per second
- Romania: 205.89 megabits per second
- Denmark: 197.27 megabits per second
- Spain: 189.50 megabits per second
- Hungary: 187.52 megabits per second
- Liechtenstein: 186.46 megabits per second
- Monaco: 185.48 megabits per second
- France: 184.77 megabits per second
- Switzerland: 183.88 megabits per second
- United States: 180.84 megabits per second
- South Korea: 176.95 megabits per second
- Andorra: 172.41 megabits per second
- Chile: 171.88 megabits per second
- Macau: 167.56 megabits per second
- Sweden: 165.52 megabits per second
- China: 163.83 megabits per second
- Canada: 158.69 megabits per second
- Norway: 153.36 megabits per second
In terms of the fastest cellular internet speeds, it’s the United Arab Emirates that takes the top spot, with an average speed of 178.52 megabits per second. These are the 15 countries from around the world that have the fastest cellular internet speeds on average.
- United Arab Emirates: 178.52 megabits per second
- South Korea: 170.52 megabits per second
- Qatar: 167.40 megabits per second
- China: 150.40 megabits per second
- Saudi Arabia: 133.73 megabits per second
- Norway: 118.20 megabits per second
- Australia: 109.33 megabits per second
- Netherlands: 103.37 megabits per second
- Bulgaria: 96.27 megabits per second
- Switzerland: 95.27 megabits per second
- Canada: 93.87 megabits per second
- Kuwait: 92.94 megabits per second
- Luxembourg: 91.74 megabits per second
- Cyprus: 87.55 megabits per second
- Sweden: 83.44 megabits per second
This map from NapLab highlights the locations with the highest instances of drowsy driving. This is such an important topic to study and gather data on. The National Highway Traffic Safety Administration says that in 2022, 693 people died in drowsy-driving-related crashes. Many people push their limits behind the wheel when they’re tired. After all, if you’re exhausted while traveling, nothing sounds more appealing than hurrying home to your warm, familiar bed. But maps like this one illustrate just how risky this decision can be.
The team at NapLab studied fatalities in drowsy driving accidents, adjusted rates by population density and then mapped out the locations that had the most accidents. Here are their findings.
Click below to zoom

For counties with 150,000-500,000 residents:
- Bastrop County, TX: 20.72 fatalities per 100,000
- Coconino County, AZ: 13.19 fatalities per 100,000
- Midland County, TX: 20 11.63 fatalities per 100,000
- Hunt County, TX: 10.16 fatalities per 100,000
- Liberty County, TX: 9.80 fatalities per 100,000
For counties with 25,000-150,000 people:
- Gillespie, TX: 40.03 per 100,000
- Milam, TX: 1039.02 per 100,000
- Walker, AL: 2132.64 per 100,000
- Cass, TX: 931.54 per 100,000
- Sweetwater, WY: 31.44 per 100,000
For counties with populations of 5,000 to 25,000:
- Pecos, TX: 190.02 per 100,000
- Reeves, TX: 178.23 per 100,000
- Madison, TX: 157.23 per 100,000
- Refugio, TX: 150.78 per 100,000
- Winkler, TX: 150.56 per 100,000
Texas counties topped most of the of the lists, which might be due to dark, quiet rural highways lulling drivers to sleep.
Boat lovers have a new way to pick their dream destination with this chart ranking states by how desirable they are for boaters. The SI Yachts team used a detailed scoring system to rank these states. The system considers some of the major factors important to boaters like average temperatures, number of sunny and cloudy days, amount of coastline, lakes, and rivers, hurricane risk, number of boats owned in the state, and the average cost of boater’s insurance. All these factors, averaged together, created the team’s ultimate list of boating states.
Click below to zoom.
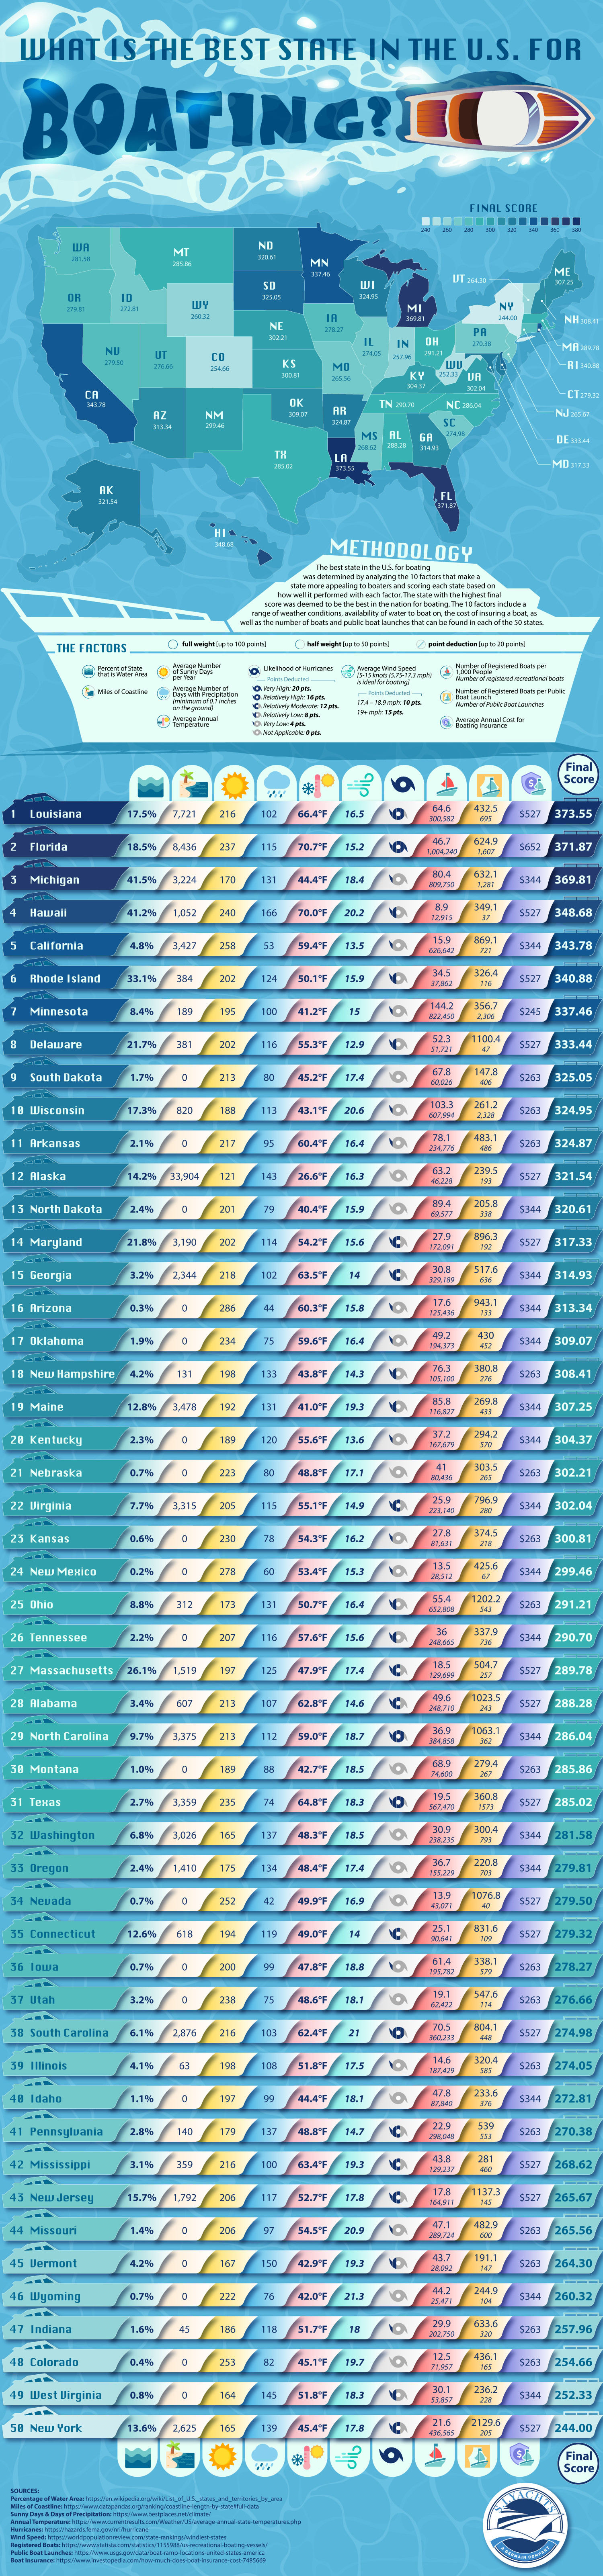
Despite the hurricane risks, Louisiana still comes out on top as the best state for boating. Miles and miles of coastline and waterways, low swampy areas, and a fishing legacy make boating a way of life in the Bayou State. As for the bottom of the list, New York was not the Empire State for boating. Expensive boater’s insurance and few days of ideal weather meant that despite this state’s abundance of lakes, rivers, and coastline, it just wasn’t an ideal place to own a boat.
Every boater has different priorities to guide where they want to set sail, but this chart is a great way to consider where you’ll find a boater’s paradise. There’s a great diversity of regions in the top states on this list so East or West, North or South, you’ll find the perfect boating destination.
Attention spans are nosediving in our modern society and it’s no surprise that technology and social media are most often given the blame for this. But are attention spans getting shorter for everyone? Maybe not. A new study by Brainscape, which analyzed their users study habits, has revealed that students’ attention spans are actually getting longer while studying. Yes, you read that right. In a world of shrinking attention spans, Brainscape users study sessions are getting longer, which means their attention spans are actually growing.
Click below to zoom
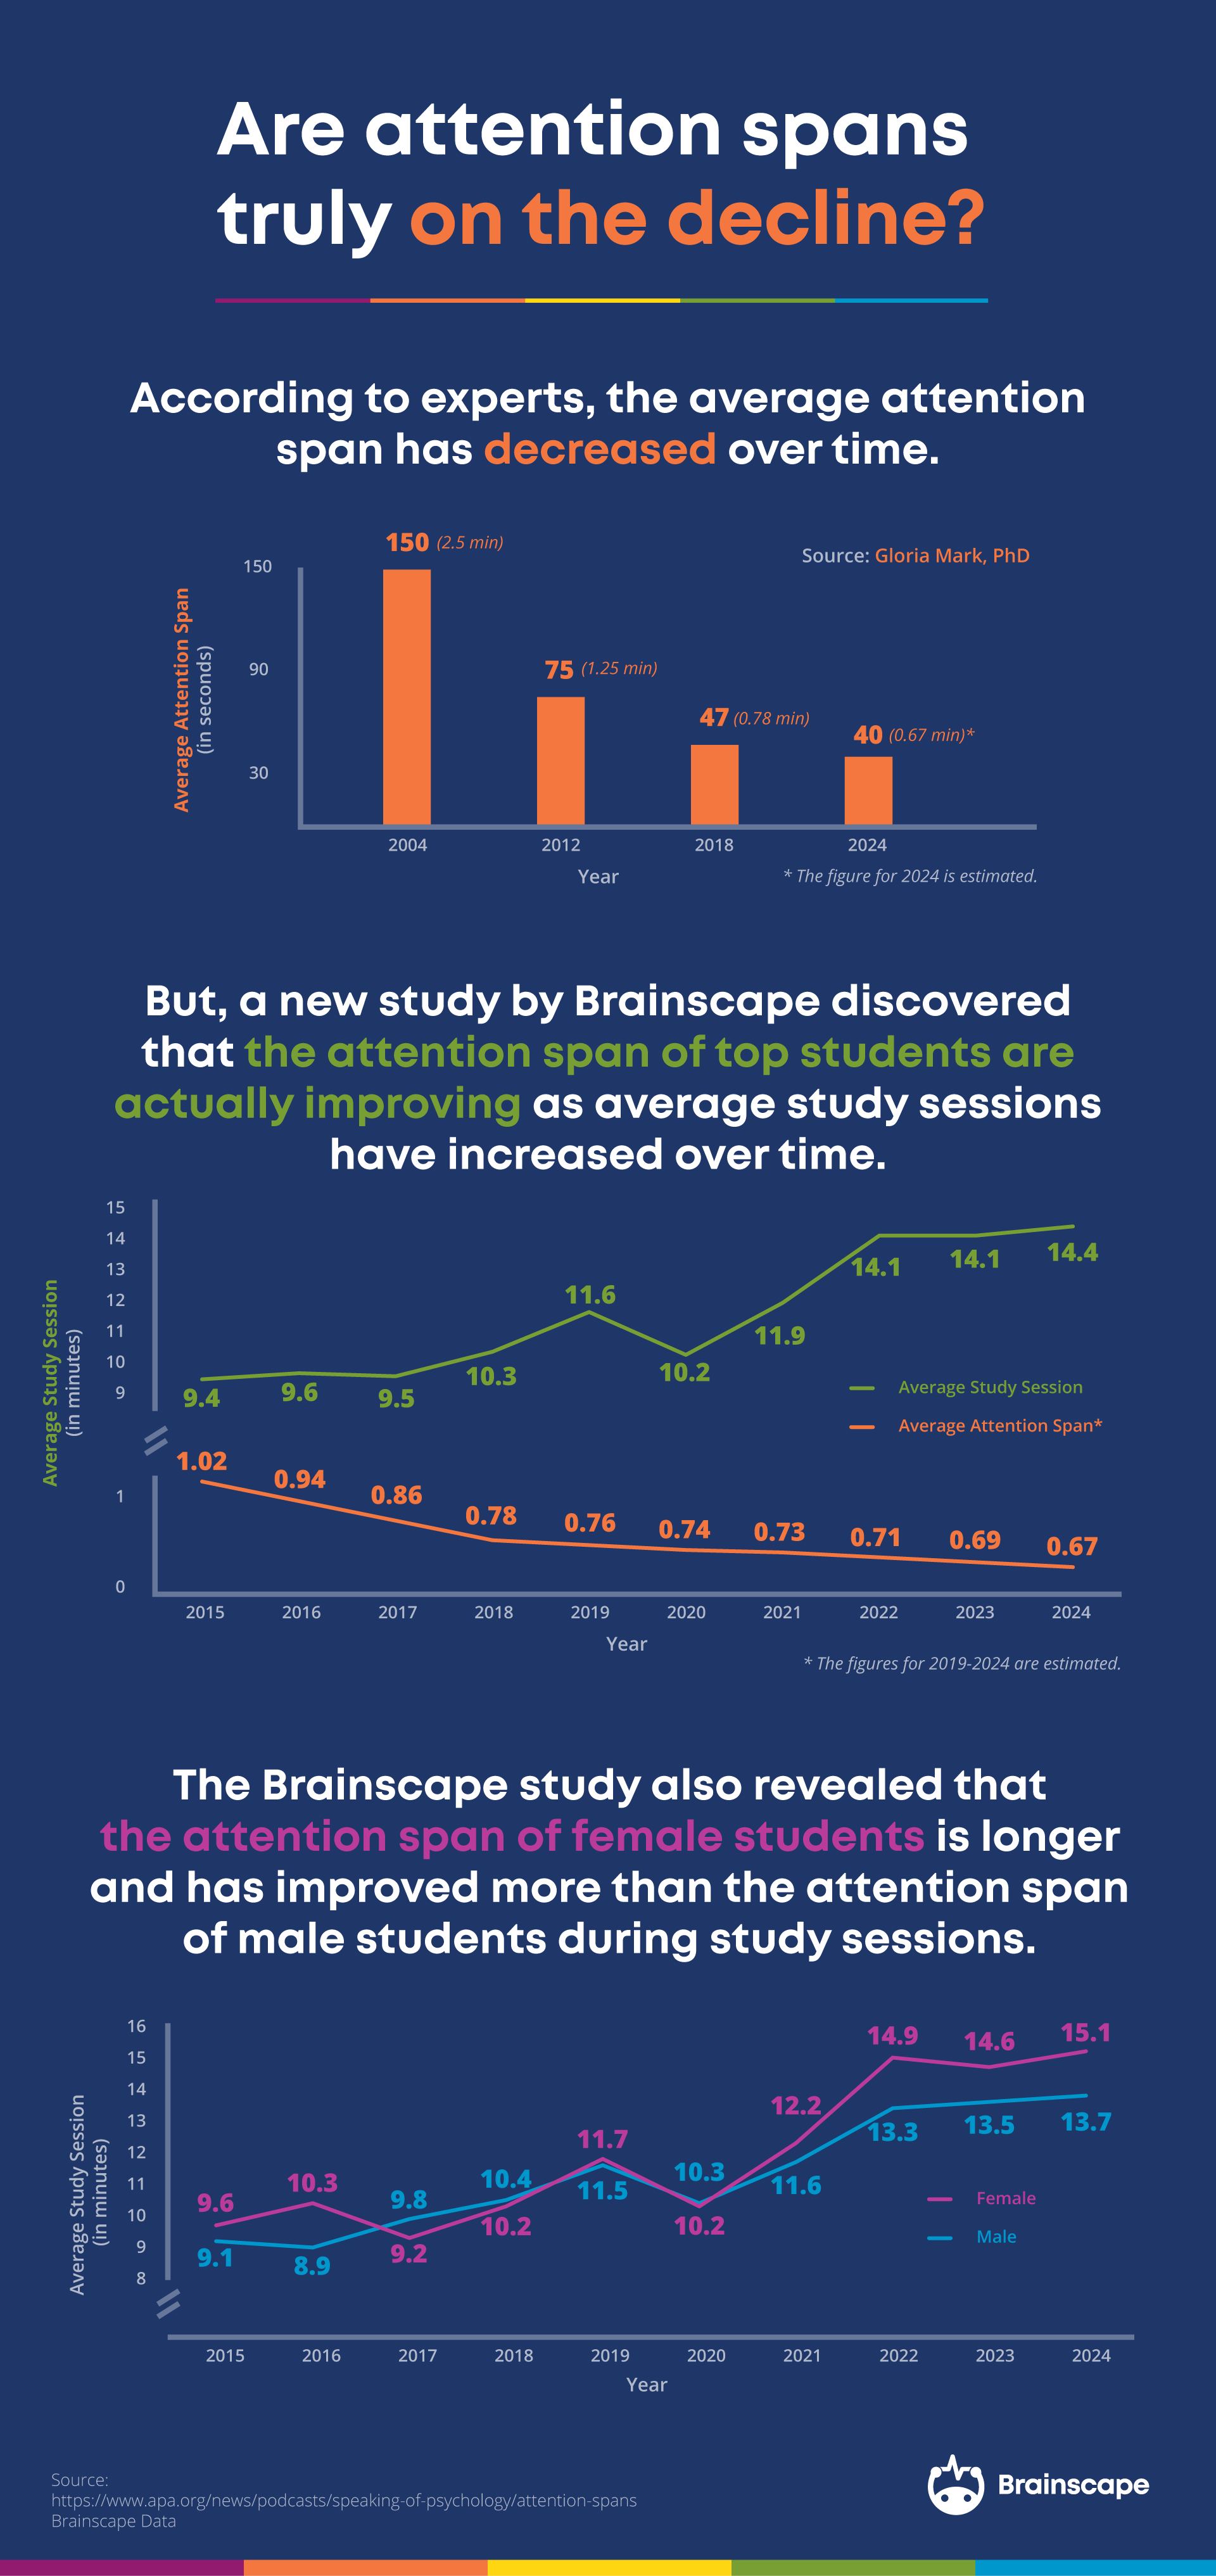
Brainscape used the length of study sessions as a relative measure of attention span. They compare their users’ sessions with the average number of minutes studies indicate the general public can focus and, as you can see, with each year attention spans grow. By 2024, students were actively studying for 5 minutes more per session than they were in 2015. While this number is impressive in its own right, users are usually completing several sessions a day, this means that they are studying a LOT more than they were 10 years ago.
For the general public, however, attention spans are assuredly still shrinking. To keep people’s attention, movie scenes are now shorter than they’ve ever been (even though the movies themselves are longer), and websites like TikTok, which is famous for their super-short attention span-friendly videos, is exploding in popularity. While TikTok is believed to be popular because of shorter attention spans, some believe that TikTok itself is helping to make those short attention spans even shorter.
It’s unclear if attention spans will ever get back to the level they were once at (it seems unlikely at this point), so it will be interesting to see how this problem will develop into the future.
-
 Charts3 years ago
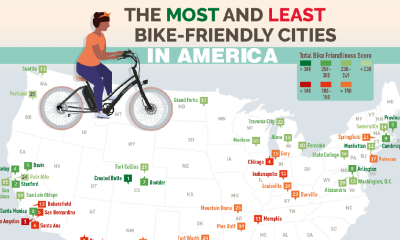
Where Are the Most Bike-Friendly Cities in America?
-
 Maps4 years ago
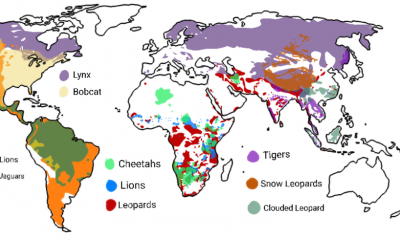
World Map Shows the Distribution of Big Cats Around the World
-

 Misc Visuals3 years ago
What Brands Does Nestlé Own?
-
 Timelines4 years ago
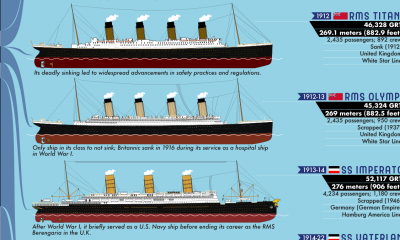
The Largest Passenger Ships in the World Since 1831
-
 Charts4 years ago
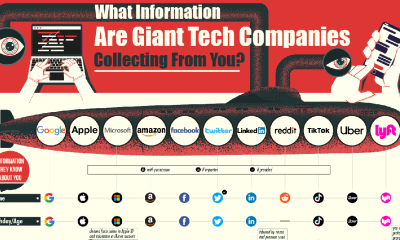
A Compilation of Information That Popular Tech Companies Collect From Their Users
-
 Charts4 years ago
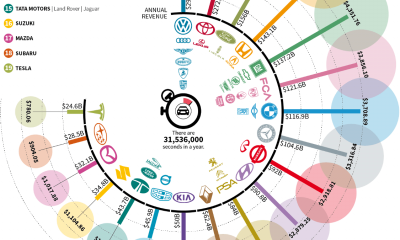
How Much Car Manufacturers Make Every Second
-
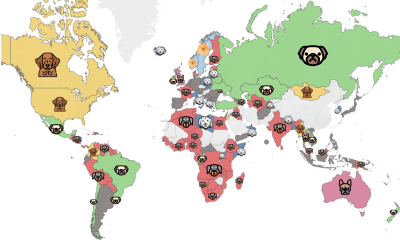
 Maps3 years ago
The Most Searched Dog Breeds In Every Country Around The World
-
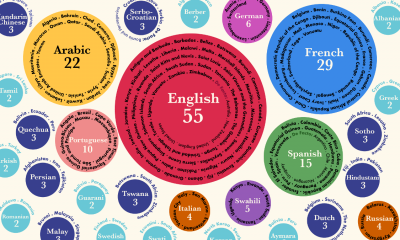
 Charts4 years ago
The Official Languages Found in the Most Countries Around the World