
Business Visualizations
Exploring Technology That Revolutionized Industries

Breakthroughs in technology can revolutionize industries and even give birth to new industries previously unimagined. The Qualtrics team explored the world’s most revolutionary products and services, arranged on a timeline that teaches us not only which tech has caused the biggest changes, but also how these developments interact with each other and advance technology and our lives as a whole. The timeline spans 1981 to 2022. It covers the realms of Computing and Internet, Entertainment and Media, and Mobile and Digital Services. Each item on the timeline has changed its industry and even changed the way humans live.
In the world of computing and Internet services, the timeline covers:
- IBM Personal Computer
- America Online
- Microsoft Windows 95
- Google Search Engine
- OpenAI ChatGPT
Click below to zoom.

The timeline covers the world of entertainment, featuring Sony PlayStation, Amazon, Craigslist, Netflix, Facebook, YouTube, and Nintendo Wii as the gamechangers. In the mobile and digital services realm, there’s a surprising diversity of products from smartphone models to apps like Uber to the Dyson DC01 Vacuum Cleaner, and even Red Bull energy.
It’s no secret that the personal computer revolutionized the business and computing industries. Before IBM’s PC, there was no market for personal computers; today, they’re a staple of modern life. Another 1980s brand, Red Bull, created a market where none previously existed. People traditionally get their caffeine fix from coffee, but energy drinks offer an easier-to-grab option on the go. Red Bull partnered with extreme-sports marketing to turn energy drinks into a lifestyle.
The timeline highlights AOL Instant Messenger as the Internet’s first big revolution. It’s a precursor to social media and helped make the World Wide Web a means of quick, easy communication. In 1998, Google Search Engines made the Internet an invaluable tool for knowledge. Google made it far easier to find websites of value on any topic under the sun (and even some beyond!)
From here on, the timeline is dominated by a range of innovative apps and Internet-based services. Amazon is the worldwide leader in e-commerce. It changed the way consumers shop forever, offering low prices, convenience, and fast delivery. Netflix changed the way people consume films and television by offering the first-ever streaming service. They offer an enormous library of new and old titles. No more waiting for a syndicated show to air. Netflix created a demand for “binge-worthy” content. The entertainment world touches every area of traditional arts and media. We see the Amazon Kindle changing how many book lovers read, offering a digital library that saves physical space and even money for some titles. Spotify became the leader of music streaming in 2008. Some think of it as the Netflix of music. Memberships offer unlimited streaming access to millions of songs and artists.
These are just a few of the industries that have been revolutionized by technology. We haven’t even touched on AI! Dive into the timeline to learn more about the most pivotal products and services of the modern era.
The invisible digital infrastructure is all around us. It powers every bank login, online order, every text sent, and every social media update posted. Vast networks that many of us rarely think about make these actions possible. Access to the digital infrastructure shapes a population’s economic standing and it even keeps entire governments running smoothly. Therefore, it’s no surprise that some countries spend huge sums to stay competitive in the digital infrastructure sector and there are clear winners as we can see in Ooma’s new study.
Click below to zoom.
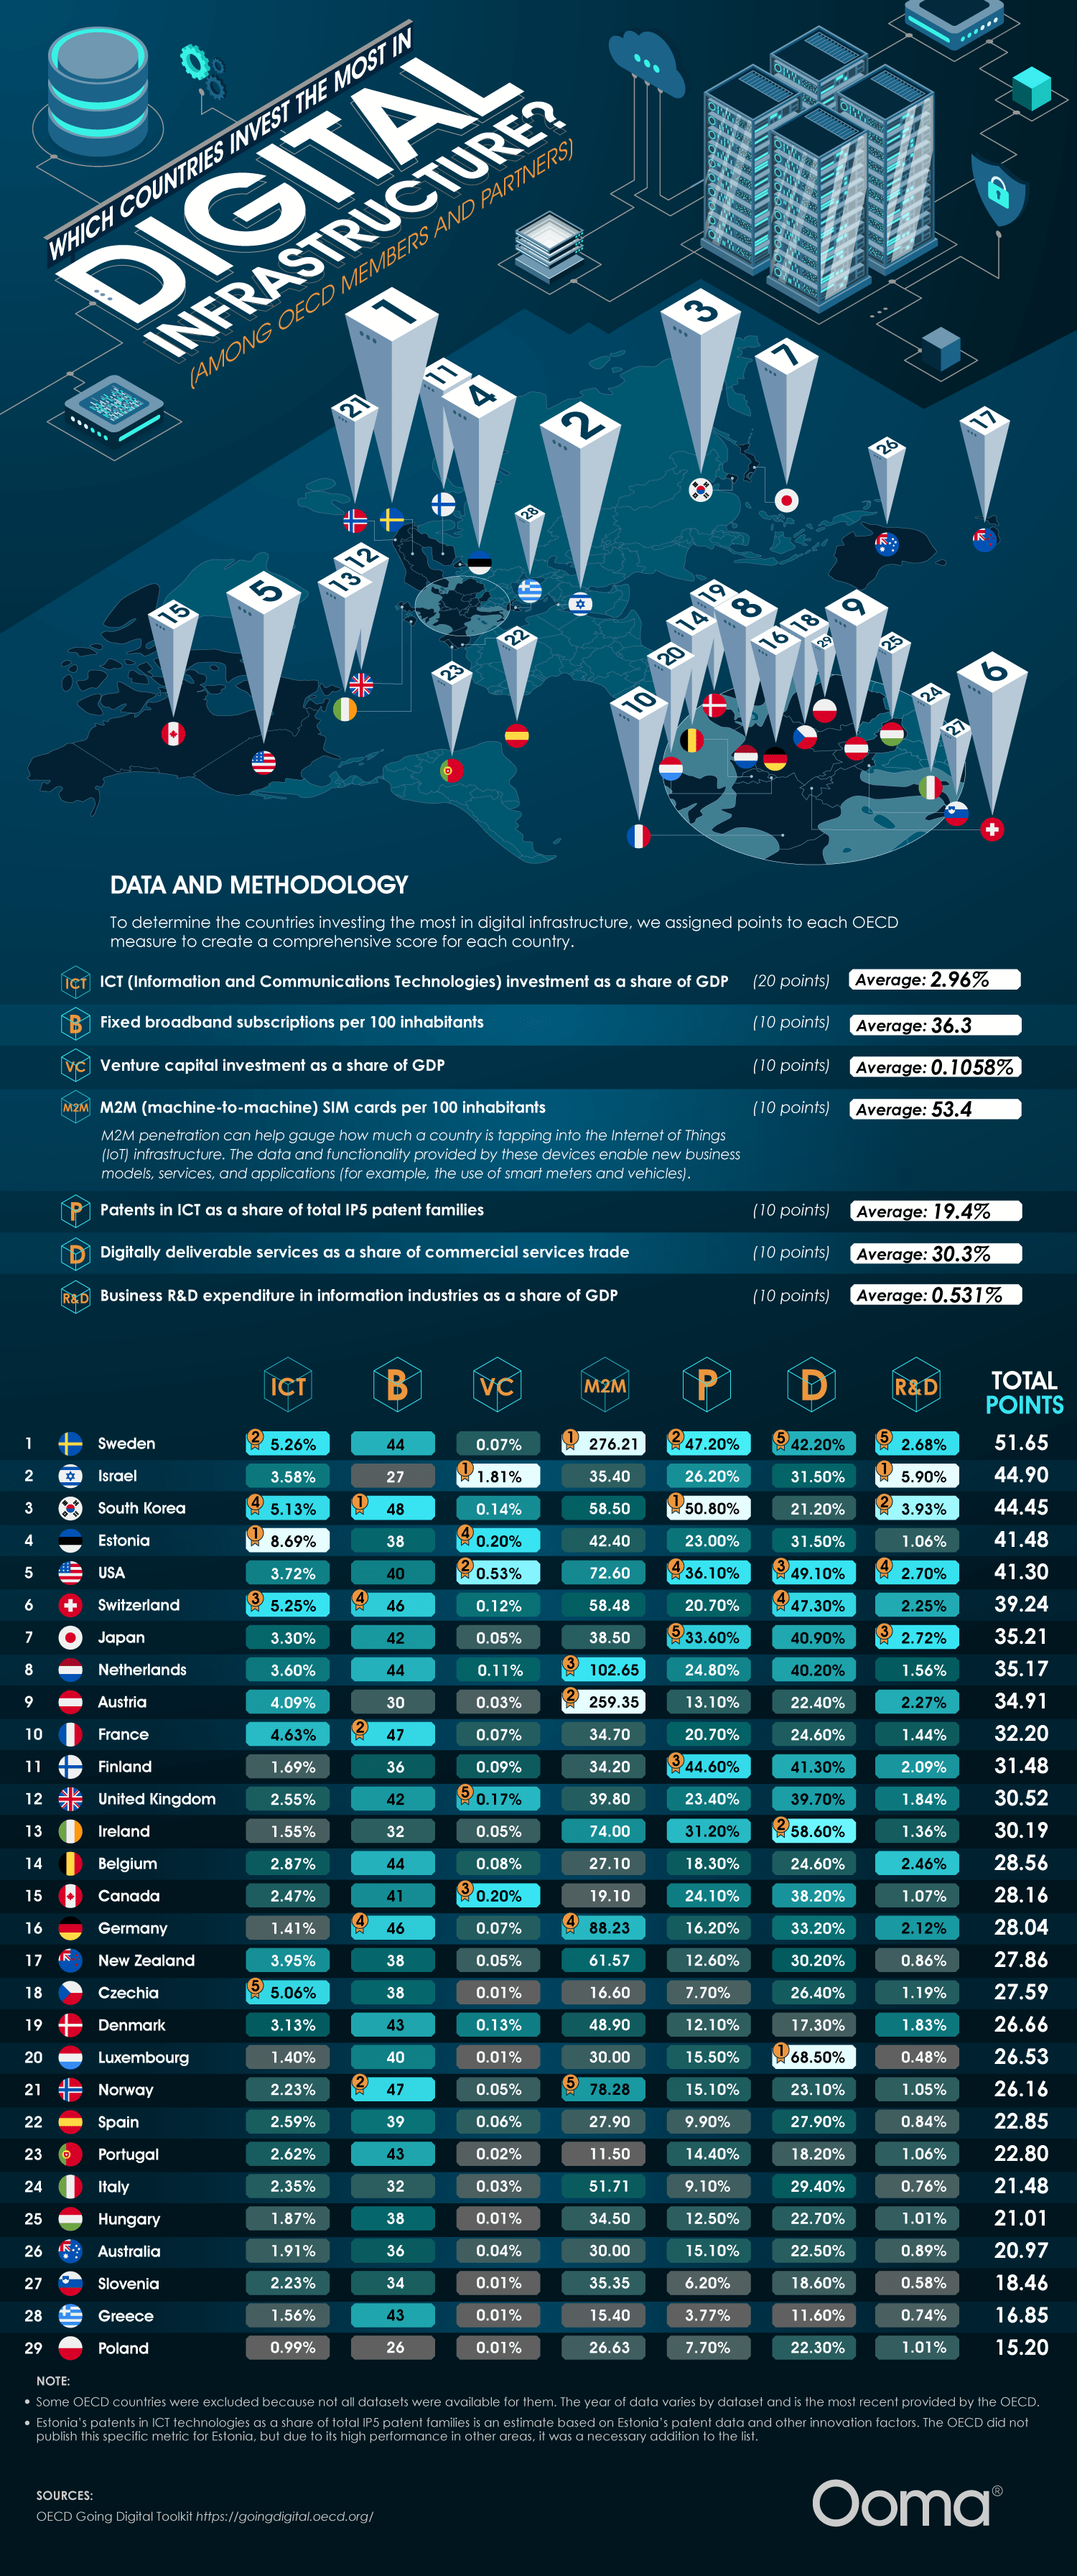
Think of this way: rather than roads and bridges, broadband networks, data centers, and cloud systems, the key to mobile connectivity is a country’s most valuable asset, which powers AI servers and social media. Advanced digital infrastructure correlates with higher GDP growth, higher productivity, a viable remote workforce, and a more digitally skilled workforce. These systems also allow faster access to government services, which can even be lifesaving since they offer quicker communication during emergencies like natural disasters.
The team’s study found 5 countries leading this digital infrastructure race. Sweden is in first place now with strong assets across the board, led by broadband subscriptions and business R&D spending. Israel is in second place with outsized venture capital relative to their GDP and heavy research funding into digital infrastructure. South Korea is in third, powered by ICT patents and top-tier broadband reach. Believe it or not, Estonia edges out the U.S. in fourth place. They’re a global digital pioneer with the most ICT investment as a share of GDP. The U.S. ranks #5, driven by digitally deliverable services and venture capital. The team used a points-based score across seven OECD measures, which include ICT investment, broadband, venture capital investment, M2M SIM cards, ICT patents, digital services trade, and business R&D.
These investments have a number of real-world impacts. In Estonia, they have nearly all their government services available online and a digital ID that can be used for everything from remote voting to public transport. Sweden has a highly developed e-commerce sector, universal household Internet connectivity, and, as a result, Stockholm is Europe’s financial hub. In Israel, the National Digital Agency and the Digital Israel initiative weave tech across education, government, and healthcare, transforming the country into a startup magnet. South Korea has one of the fastest Internet speeds globally and they dominate consumer electronics, competitive gaming, and semiconductors.
Countries investing in digital infrastructure are positioned to be world superpowers. Businesses in these countries benefit from fast communication and a digitally literate workforce. But seamless connectivity shouldn’t depend on geography. Every country and all people can benefit from a more digitally connected world, so the more countries that improve their digital infrastructure, the better. The leading countries on this chart can serve as role models while countries further down the list highlight areas for improvement and potential investment.

AI is embedded in workplaces worldwide by this point, and yet workers’ feelings about it vary dramatically. A study by Qualtrics examined how geography was related to feelings about AI in the workplace. They found that only 37% of workers globally believed that AI would improve their jobs. That average hides a 45-point difference between the most optimistic country, which is China, and the most skeptical, Japan.
Click here to zoom.
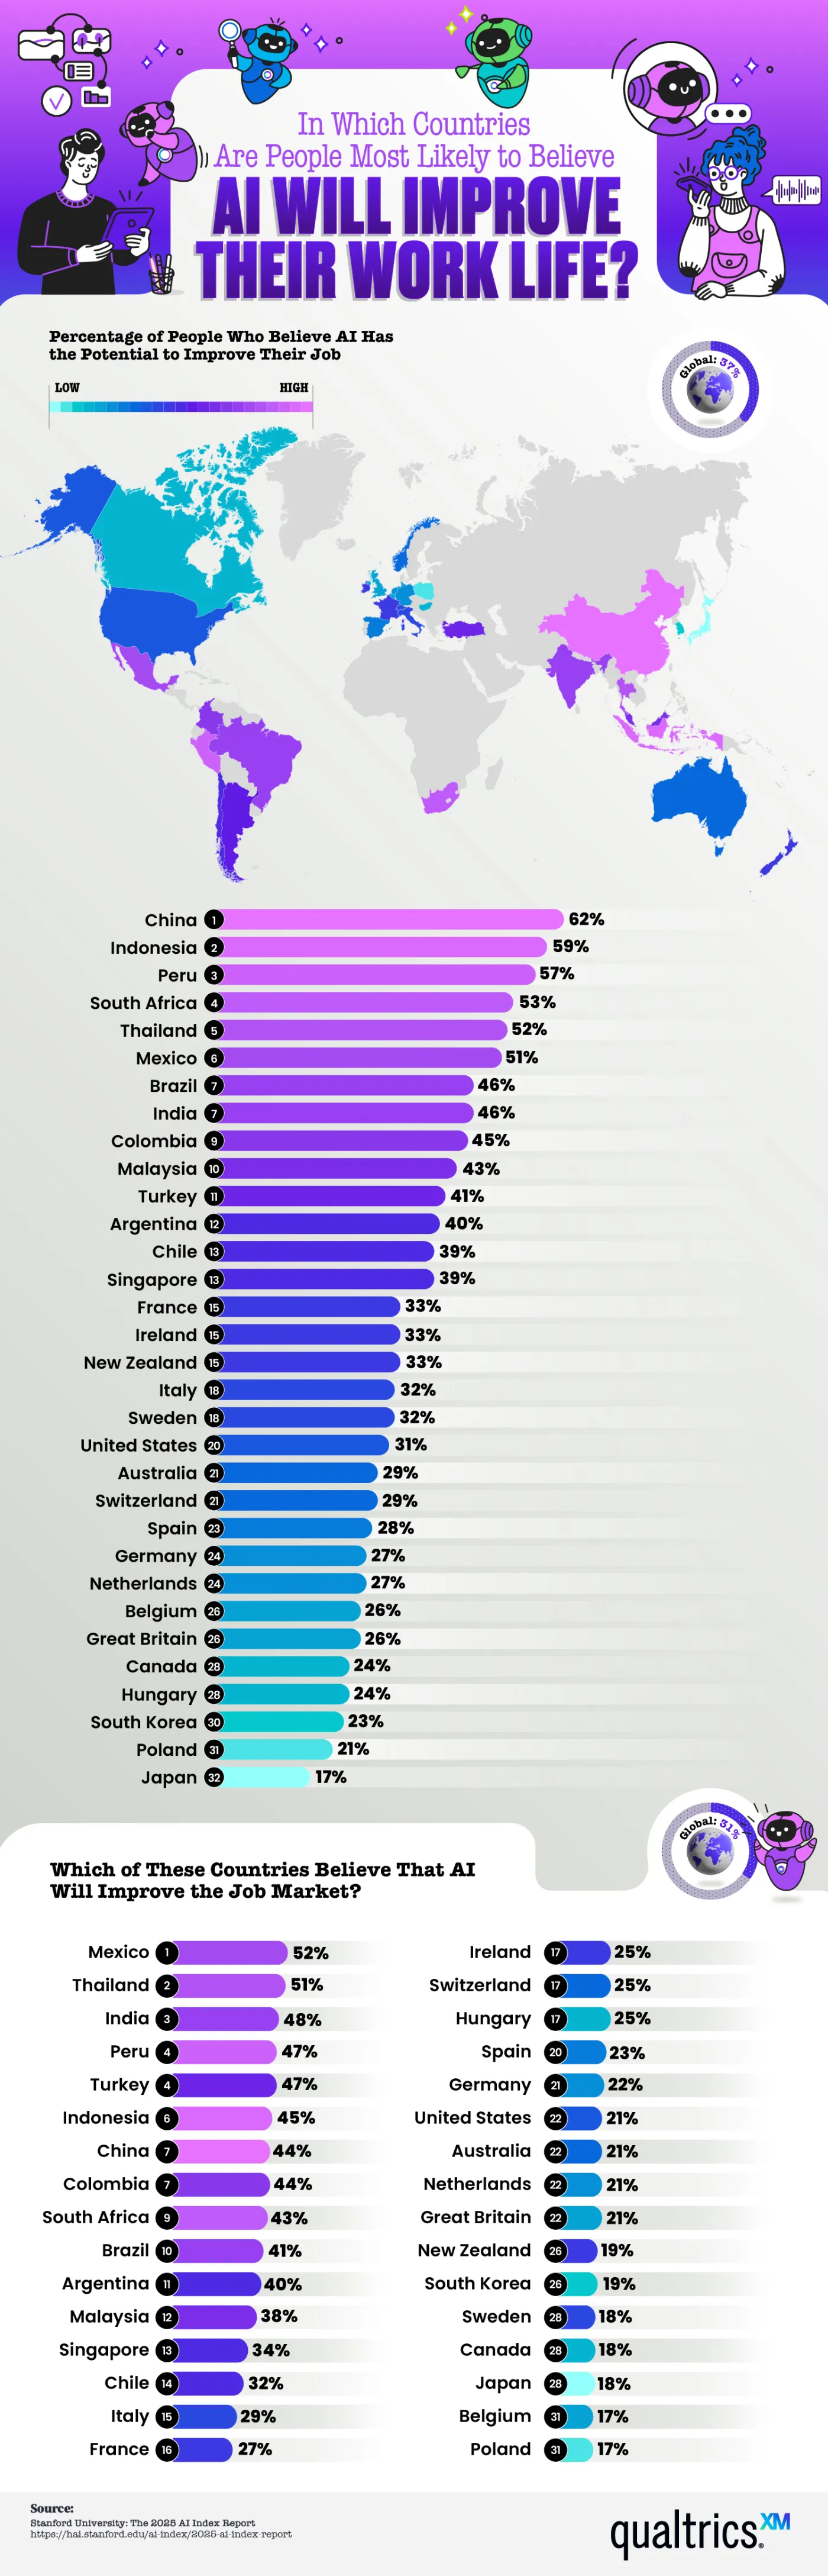
Nearly 80% of global companies report using AI in some capacity, and research indicates productivity gains, with lower-skilled workers benefiting the most. Even if this is the case, employee sentiment isn’t nearly as unified. The numbers the team shows here indicate a healthy level of AI skepticism. In fact, more than half of workers think AI will improve their lives in just 6 out of 32 countries studied. That means there are more skeptics than people excited about what AI will bring to the workplace. But why does optimism cluster in some regions while most remain skeptical?
Here are a few of the countries where optimism runs high:
- China – 62% of workers are optimistic
- Indonesia – 59%
- Peru – 57%
- South Africa – 53%
- Thailand – 52%
There is a mid-tier region with fewer optimistic workers, but still a healthy percentage. This includes Mexico, Brazil, India, Colombia, and Malaysia. Many of these countries have developing economies or a heavy state investment in AI infrastructure, as is the case in China. Workers in these places view AI as a tool to close skill gaps, raise wages, and improve living standards. These regional differences are easy to spot thanks to the map Qualtrics created, which color codes the level of optimism/skepticism.
At the other end of the spectrum, we find the highest number of skeptics in Western Europe and English-speaking countries. Here are the countries with the least faith in AI:
- United States – 31% of workers are optimistic
- Australia – 29%
- Great Britain – 26%
- Canada – 24%
- Japan – 17%
- Poland – 21%
The media narratives in these countries frame AI as a risk of automation-driven job loss, which shapes people’s perceptions even when AI adoption in their workplaces is the same as in optimistic locations. These nations are the same that rank lowest on the belief that AI will improve the job market.
Economic research suggests that AI tends to reshuffle tasks within a role rather than eliminate that job outright. New skills will be required to work with AI, and some positions will shift, but historically, new digital tools have created more roles than they’ve erased. The gap between the hard data and public sentiment in skeptical countries is definitely worth examining and tells a story.
As AI rolls out unevenly across the world’s workforce, it’s important for employers to understand where their employees actually stand on the issue. Beyond regional stereotypes or headline-driven assumptions, employers must look at facts like the data presented here to make thoughtful AI adoption decisions.
Logos are among the most dramatic and important aspects of marketing, shaping how consumers view a brand in ways that aren’t always visible. Logo designs are based on psychology, which informs us how shapes and colors make us feel, and how they can shape a brand’s trustworthiness and credibility. If a brand changes its logo, it must be done with care and intention, and with a clear reason to justify the switch. The team at LogoMaker displays the most effective logo switches and rebrands in a graphic based on increased web traffic.
Click below to zoom.
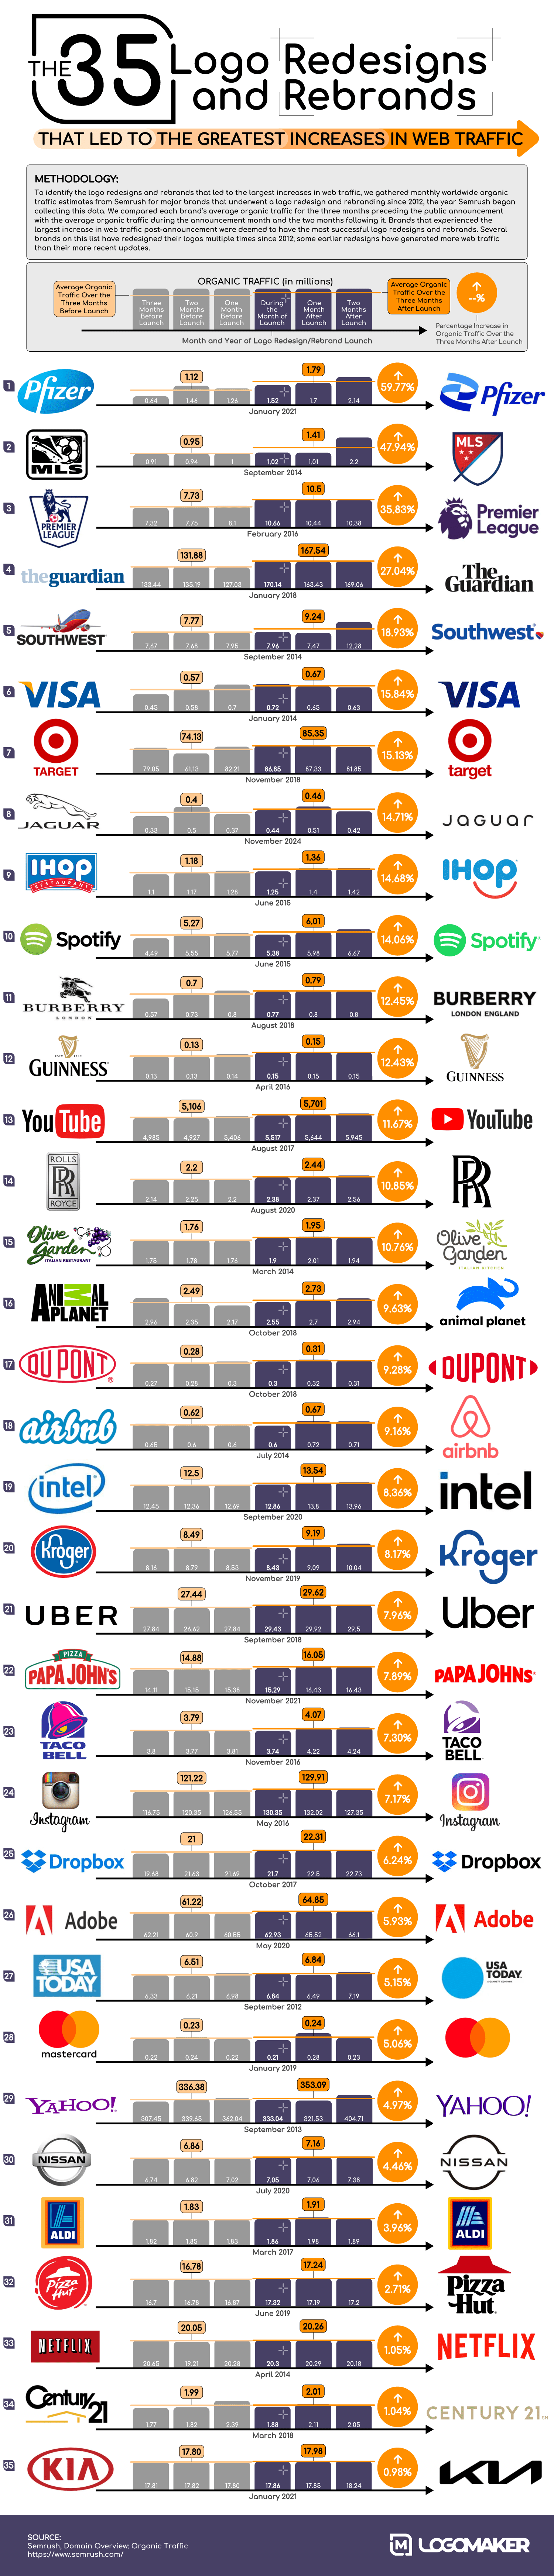
The team chose web traffic as an indicator of a successful logo because in the world of marketing, clicks and traffic are closely linked with sales and brand awareness. It’s a quantifiable way to measure customer behavior. The team used SEMrush traffic data to estimate traffic changes in the three months leading up to their rebrand announcement, compared with the two months after the launch. Their graph isolates traffic rates to the time of the rebrand to get the most accurate depiction of the effects. The team also helpfully included the old and new logos so readers can form their own opinions about changes.
According to the team’s results, these were the brands with the biggest traffic increases after their new logo launched:
- Pfizer
- MLB
- Premier League
- The Guardian
- Southwest
- VISA
- Target
- Jaguar
- IHOP
- Spotify
We see a wide range of industries represented in these results. Pfizer takes the lead after redesigning its logo from a pill shape to a double helix. This is also a good example of other factors, in addition to the rebrand, causing the traffic spikes. The rebrand occurred in 2021, the height of the COVID-19 pandemic, when the world was hoping for a company like Pfizer to develop an effective vaccine.
After Pfizer, we see a few sports leagues on the chart. Major League Soccer, or MLS, is in second place, followed by the UK’s Premier League in third. Both of them dramatically simplified their logos, making them clearer and possibly more memorable, as the increased traffic indicates. In fact, many of the companies on the list seem to have opted for simpler logo designs. This is quite possibly so the logos are more visible when they’re small, like on a phone screen. This could also reflect a changing aesthetic, shifting from the more stylized and classical designs of the 90s and 00s to today’s more bold, minimalist style.
The trend toward minimalist logo redesign reflects evolving consumer preferences and the demands of digital media. Companies across diverse industries, from pharmaceuticals to sports and retail, are embracing simpler, more impactful designs that enhance brand recognition and visibility in an increasingly mobile world. These changes not only boost traffic but also demonstrate how branding adapts to cultural shifts and technological advancements, helping organizations stay relevant and competitive in today’s fast-paced landscape.
-
 Business Visualizations2 years ago
Everything Owned by Apple
-
 Business Visualizations2 years ago
America’s Most Valuable Companies Ranked by Profit per Employee
-
 Business Visualizations1 year ago
The Biggest Fortune 500 Company in Every State
-
 Business Visualizations1 year ago
The Biggest Employers by Industry
-
 Timelines2 years ago
Timeline Charts the Development of Communications Technology
-
 Business Visualizations9 months ago
The Largest Companies in America That Are Still Run by the Person Who Founded Them
-
 Charts2 years ago
Map Uncovers Countries with Most Powerful Passports
-
 Maps2 years ago
A Map to Gold and Silver