Maps
Learn the Most Popular Couple Nickname in Every State
Preply’s new article on the most popular couple pet names in each state digs into one of life’s little joys: what couples call their partners. The piece also explores the importance couples place on these names. This is a crash course on love language, with “babe” and “honey” taking center stage, along with a surprising amount of “dumpling.”
The researchers surveyed thousands of U.S. residents nationwide and asked about their use of affectionate nicknames in relationships. They gave each state a score from 0 to 100 based on nickname frequency, variety, and whether folks saved their partner’s pet name on their phone instead of their given name. Basically, the more “boo” and the less “hey you,” the higher the score earned.
Click below to zoom.
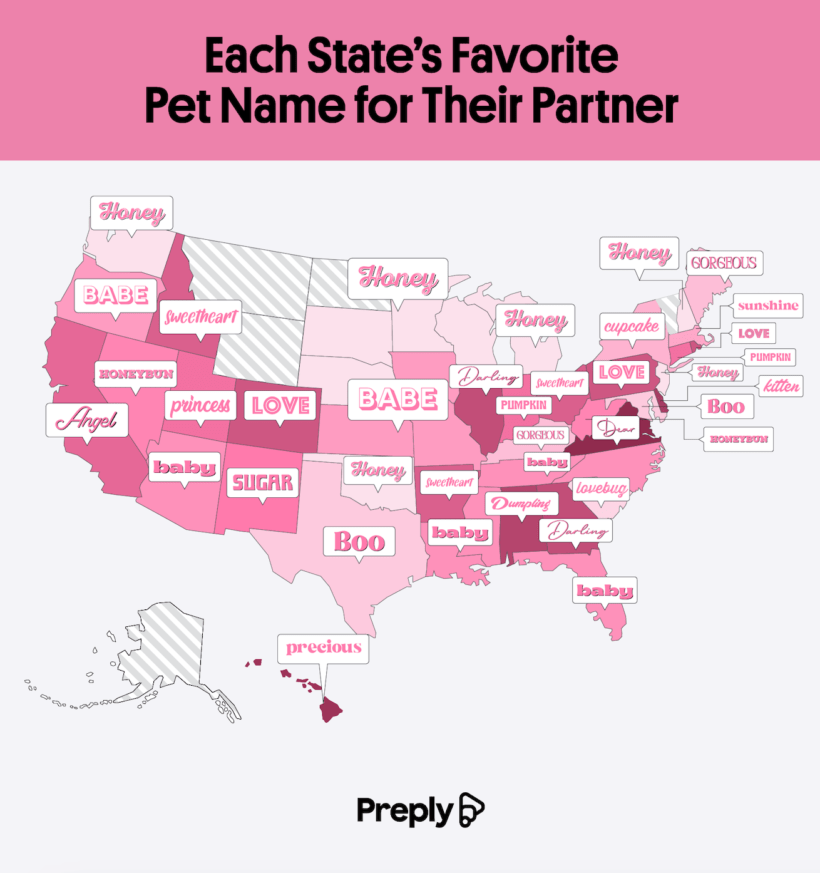
Topping the nickname list with nearly perfect scores were New York (99.84), Virginia (98.30), and Nevada (98.04). If you’ve ever wondered which states are all over pet names like syrup on pancakes, here’s your answer. Virginians are particularly committed. They love nicknames so much that many people save them as contacts in their phones, and they will proudly defend their choice. Meanwhile, Nevadans use nicknames as flashy as the Las Vegas Strip.
On the other hand, some states are less than enthusiastic about nicknames. Minnesota holds the dubious honor of being the least likely to use a pet name and label the behavior as cringe. They’re followed by Colorado and Massachusetts. In Minnesota, you’re more likely to hear someone say “sweetheart” with more sarcasm than sweetness.
An extra fun section displays the team’s favorite unique couple nicknames and the state where they found them. While “babe,” “love,” and “honey” might be the most commonplace, some couples would rather put their own unique spin on relationship names.
- Honey is the most common pick in the country. This warm, golden classic is popular in Nebraska, Michigan, New Jersey, and Washington.
- Baby reigns as the most popular nickname in Florida, Arizona, and Tennessee, showing off a more playful vibe.
- Cupcake takes the cake for New York, where it seems to be a sweet and city-trendy name.
- Dumpling is Alabama’s favorite and seriously adorable nickname, while the sweet “sugar” is the most popular in New Mexico.
- In places like Nevada and West Virginia, some fun and old-fashioned nicknames are popular, like “honeybun.” Why settle for honey when you can add the buns?
These quirky, regional flavors of affection paint a sweet picture of romance in the U.S. Almost two-thirds of all couples surveyed are called “love,” “honey,” or “babe” by their partners, often more than by their actual names. Around 69% of Americans believe pet names strengthen their relationship and feel nervous or suspicious that something is wrong when their partner doesn’t use their nickname. Over a third of people admitted to using the same nickname across different relationships, indicating that these names come as natural old favorites more than specific choices to match certain personalities. This map is a fun look at the way Americans express love through names.
A new study by LLC Attorney examines the booming side-gig economy across the United States, identifying which states have seen the largest increases in freelance work and why. The piece introduces us to an expanding “Gig Economy” driven by apps and services like Uber, DoorDash, and Fiverr. These apps have made on-demand work accessible on a wide scale. While the side-gig economy is growing overall, the team shows that growth isn’t evenly distributed. Some states have far more gig workers than others.
Click below to zoom.
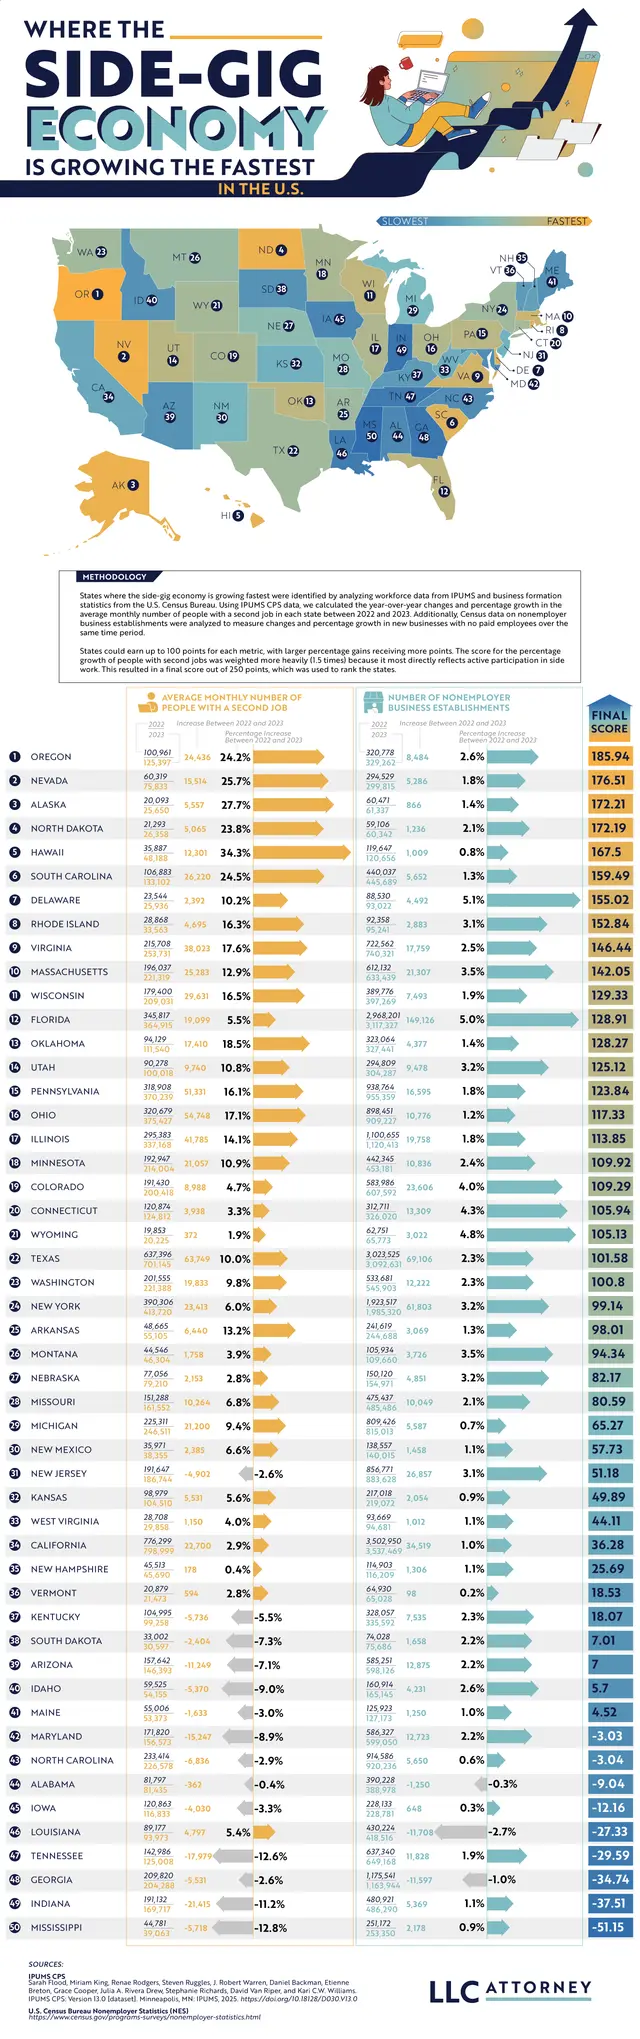
To get the data needed to create the map, the team analyzed year-over-year changes in the average monthly number of people holding a second side gig job and the growth of non-employer business establishments. Drawing on data from IPUMS CPS and the U.S. Census Bureau, the team created a color-coded map.
The top five states show us an interesting geographic picture. Oregon claimed the number one spot with a 24.2% rise in the average monthly number of people working a second gig job. Oregon has the highest number of gig workers in general. Nevada had one of the largest increases, at 25.7%, thanks to its tourism-heavy economy, which naturally generates demand for ride-sharing, Airbnb, and delivery services. Alaska takes third place, despite its smaller population. It had a 27.7% increase, while North Dakota follows in fourth with a 23.8% rise. Hawaii rounds up the top five with a huge 34.3% jump in residents working two jobs between 2022 and 2023.
These specific states lead the way because of two recurring issues. High costs of living, with rising costs of food, healthcare, and housing outpacing wage growth in these regions, lead more people to take on second jobs out of necessity. Hawaii has steep grocery and housing costs; Oregon and Nevada face similar cost-of-living issues.
These top-ranking states might appear to be thriving if we look at the Gig Economy numbers, but they have less diverse job markets, often relying on tourism. These seasonal and unpredictable jobs lead workers to seek ways to diversify their income.
The top ten states with the biggest gig economies are:
- Oregon
- Nevada
- Alaska
- North Dakota
- Hawaii
- South Carolina
- Delaware
- Rhode Island
- Virginia
- Massachusetts
Gig work can be convenient and a big asset to small business owners, but it also has downsides. Gig roles rarely include health insurance or benefits, income tends to be inconsistent, and the work is for people who don’t mind flying solo without coworker interaction. It does support independence and a flexible work schedule for people who value those qualities.
This map helps us understand the lasting changes the gig economy has had on the American economy. Side gig trends reflect how workers respond to economic changes, whether they face setbacks or opportunities. Side gigs create a fairly straightforward, low-effort way to make money, but they also drive steeper competition for jobs. Visualizing data can help us understand what drives economies and helps gig workers decide what opportunities will help them grow.
Many studies have proven the cognitive benefits of learning a second language, which is especially powerful for children. A new Preply study turns to the career world and the monetary benefits of being bilingual. After examining thousands of job advertisements, the team examined how language skills impact hiring trends, salaries, and career growth potential. Their findings help workers definitively decide whether a bilingual career is worth the study. Results show that salary gaps vary widely across countries, and some languages offer stronger benefits than others. Different industries value bilingual workers more than others too. The team’s analysis is a thorough examination of how bilingual abilities can impact a career.
Click below to zoom.
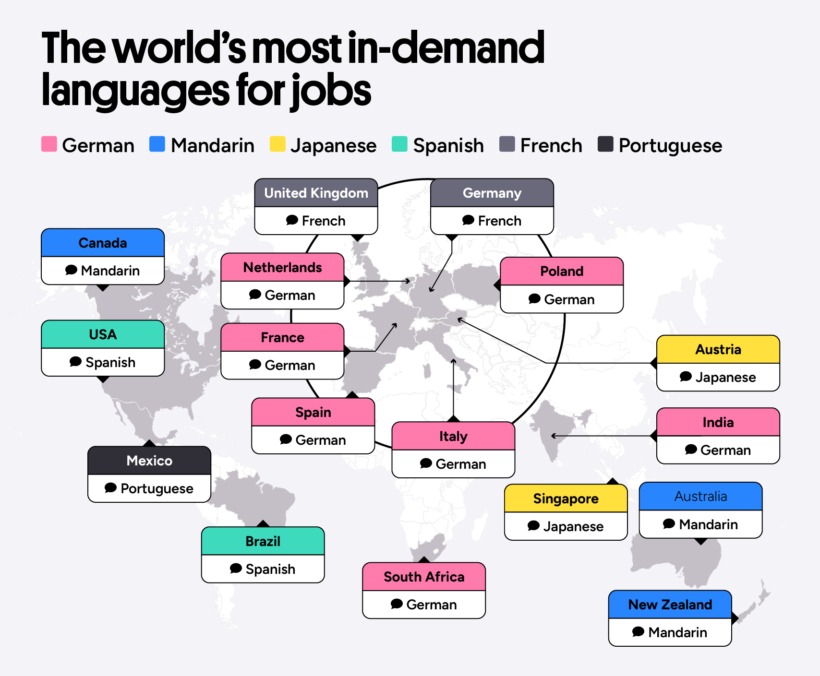
Despite variances, the Preply found that bilingual jobs do indeed pay more. The study found that bilingual workers earn an average of $9,353 more a year. In some countries, that amount is even higher, proving that a second language is one of the most valuable skills you can add to your resume.
These are the countries where speaking a second language pays the most:
- Spain – bilingual workers earn 19.4% more than single-language workers
- USA – 18.8% more
- Poland – 18.6% more
- UK – 11.5% more
- Italy – 4.8% more
- Canada – 3.3% more
Not all languages are worth the same salary increase. Research has uncovered five languages that lead to the highest salary increases. Japanese, Portuguese, Italian, German, and Russian are the most lucrative to learn. Japanese is the most valuable language to learn, giving workers a 20.9% salary increase with fluency. Japan is a world leader in engineering, technology, and the automobile industry, so Japanese fluency allows workers to communicate with these world-leading Japanese brands. The value of Portuguese lies in the many countries that speak it, including Brazil and parts of Africa. Italian fluency comes in handy, particularly in the tourism industry.
Speaking of industry differences, bilingual ability is more valued in some sectors than others. These American sectors had the highest number of job openings that required a second language:
- Sales
- Customer Service
- Social work
- Property and real estate
- Education
- Manufacturing
- Logistics
- Consulting and Strategy
- Accounting and Finance
- Healthcare and Nursing
- Marketing and PR
- Hospitality and Catering
Some of the positions this can lead to include call center reps, account managers, nurses, teachers, hotel managers, tech support experts, social workers, and salespeople.
In the USA, Spanish is the most sought-after second language. In Europe, many countries seek German and French speakers. Remember that it’s never too late to start to learn a second language. You’ll still see career benefits. While you may have to invest in hiring a tutor or start a class, this data makes it clear that this investment will pay off in the long run. Learning a second language not only enriches your life but can also open new doors and career possibilities. If you want to change careers, a second language can help you do this, and if you want to advance, a second language might be the key.
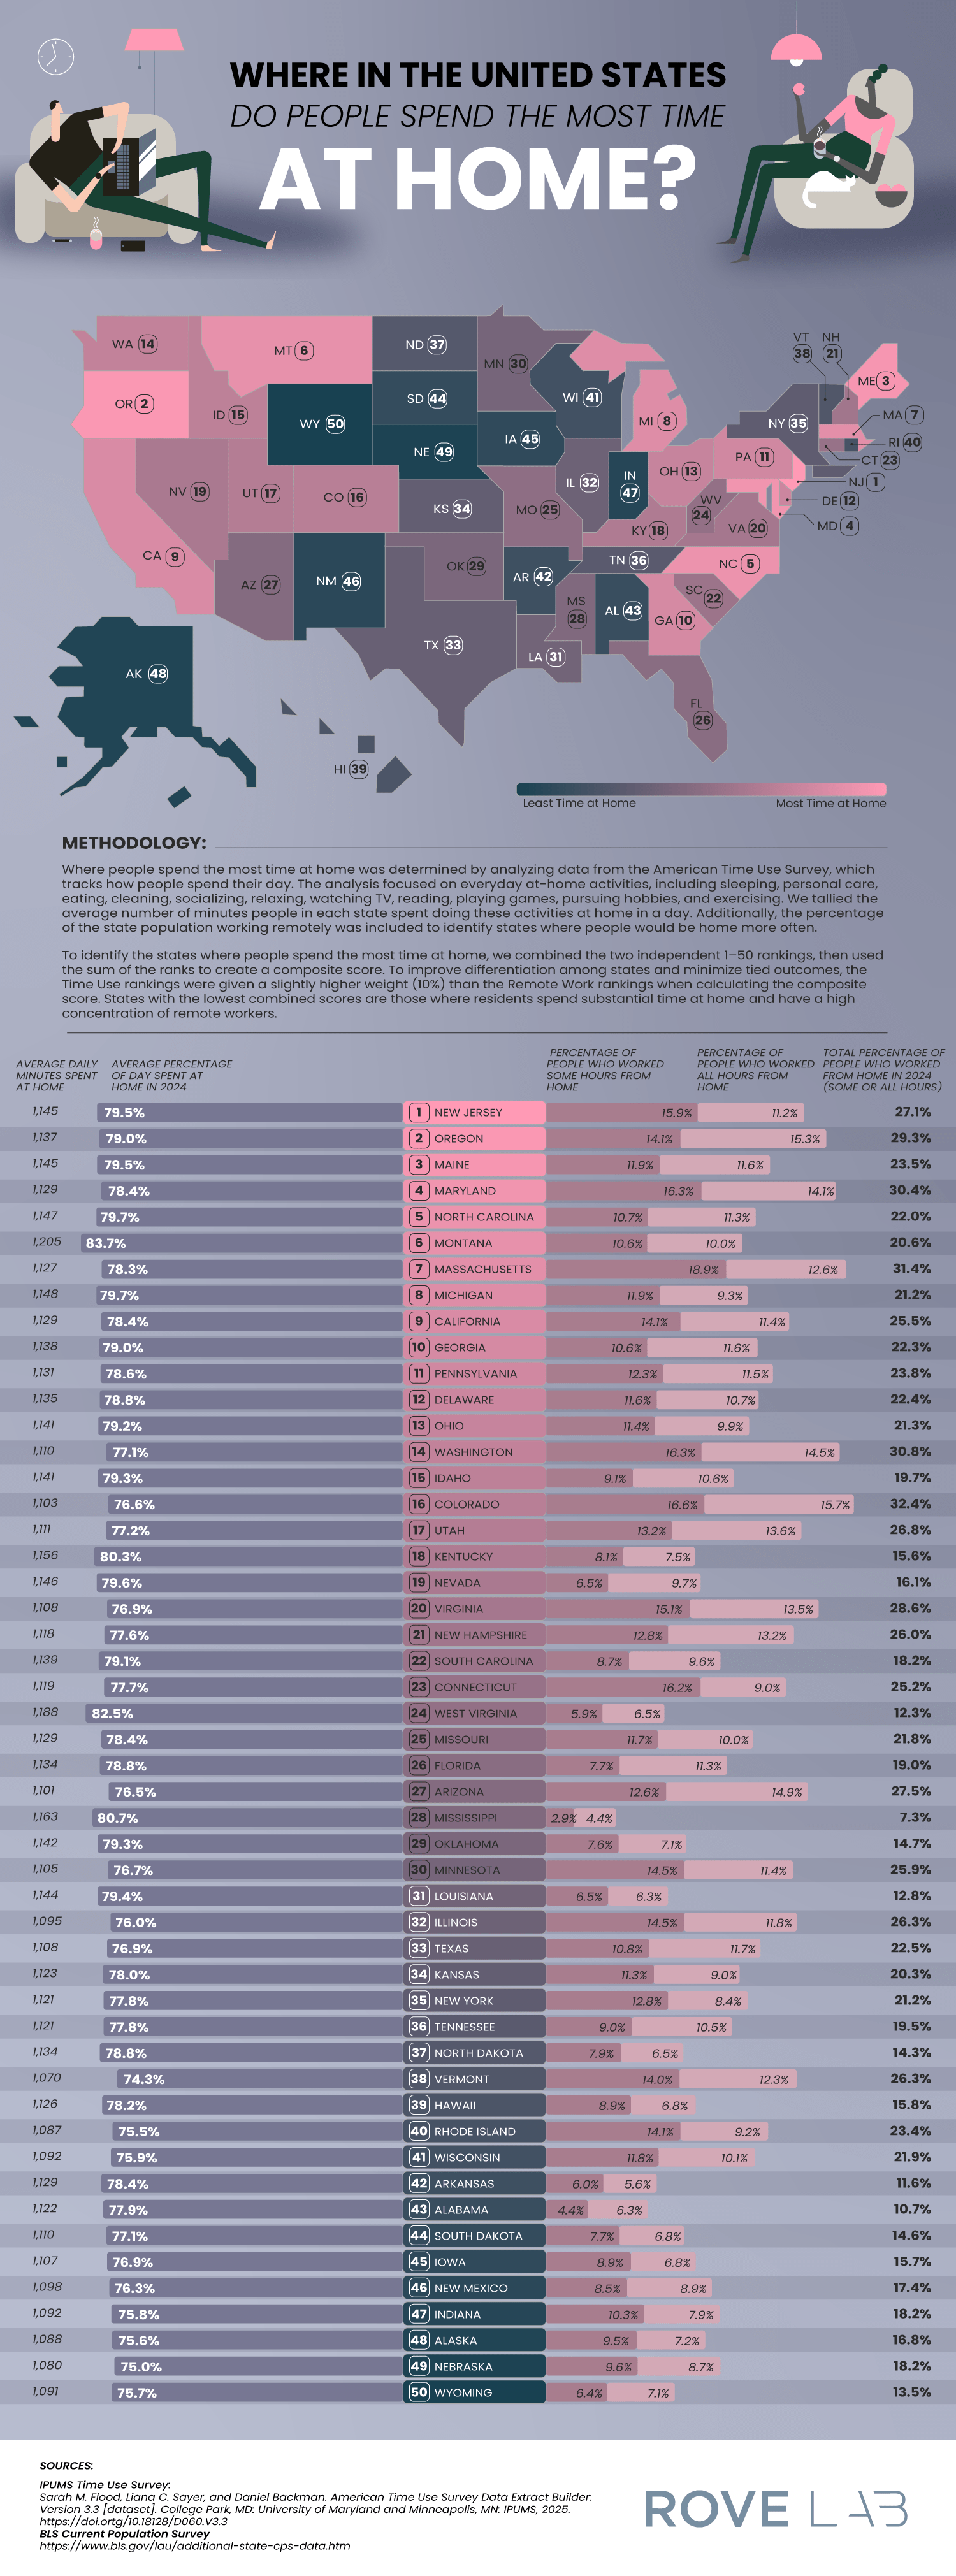
A new article from RoveLab presents a data-driven exploration of home-life habits in the United States, examining how much time Americans spend at home and how that changes across each state. Drawing on data from the American Time Use Survey and the Integrated Public Use Microdata Series, the study constructs a ranking of states based on how much time residents spend at home. This data combined at-home activity levels with remote work prevalence.
RoveLab situates its analysis within broader behavioral shifts in the American lifestyle. On average, Americans spend around 18 hours per day at home (including sleep), which reflects a gradual decline in time spent outside the home over the past two decades. This trend pre-dates the COVID-19 pandemic, which spiked time spent at home and prompted the rise of remote work.
Click below to zoom.
Other important facts on time spent at home add more context:
- 80% of Americans engage in daily household activities like cleaning, cooking, and home maintenance.
- 94% of Americans participate in leisure activities at home, including gaming, socializing, and exercise.
- Most Americans watch about 3.57 hours of television daily, which is more than the average amount of daily time spent on household tasks.
These statistics show that a home is the central site of both productivity and leisure, underscoring the growing connection between work and private life.
To determine which state residents are the most homelife-centric, the researchers developed a scoring system that incorporated:
- Average percentage of the day spent at home
- Average daily minutes spent at home
- Percentage of residents working remotely
- Weighted ranking emphasizing time-use data slightly more than remote work numbers
This multi-factor approach shows the team’s effort to balance behavioral statistics with labor trends, offering a comprehensive view of domestic time use.
The team found that residents in these states spend the most time at home:
- New Jersey: 5% of the day is spent at home (1,1495 minutes) and 27.1% of residents work remotely.
- Oregon: 79% of the day is spent at home and 29.3% of residents work remotely.
- Maine: 79% of the day is spent at home and 23.5% of residents work remotely.
New Jersey’s lead position is due to several structural factors, such as its proximity to major employment centers and a highly educated workforce, with over 40% of residents holding a bachelor’s degree. These factors create a population ideal for telecommuting. It shows us that socioeconomic factors can shape our daily routines.
At the low end of the scoring, Wyoming ranks as the state where people spend the least amount of time at home. This reflects a low rate of remote work. Montana relies on industries like agriculture, mining, and tourism, which all require in-person workers. The team also speculates that Wyoming’s emphasis on outdoor recreation leads residents to both work and play outside their homes.
By combining time-use data with employment patterns, the study provides valuable insight into how regional differences, evolving job requirements, and leisure habits shape modern American life.
-

 Business Visualizations2 years ago
Everything Owned by Apple
-

 Business Visualizations1 year ago
America’s Most Valuable Companies Ranked by Profit per Employee
-

 Business Visualizations1 year ago
The Biggest Fortune 500 Company in Every State
-

 Business Visualizations11 months ago
The Biggest Employers by Industry
-

 Business Visualizations2 years ago
New Animated Map Shows Airbnb’s Fully Booked Cities Along the 2024 Eclipse Path of Totality
-

 Timelines1 year ago
Timeline Charts the Development of Communications Technology
-

 Charts2 years ago
How Many Crayola Crayon Colors Are There? A Lot.
-

 Business Visualizations6 months ago
The Largest Companies in America That Are Still Run by the Person Who Founded Them