
Business Visualizations
New Study Ranks College Degrees by Return on Investment

With the high cost of college tuition making headlines, choosing a college major wisely becomes a crucial financial decision. Student Choice has analyzed college majors by their return on investment (ROI) and created a graph that ranks degrees by their ROI. Passion is certainly an important factor in choosing a college major, but knowing the ROI of a major helps prospective students plan for their future and understand their future financial prospects. This graph is a powerful tool for navigating a competitive job market.
Click below to zoom.
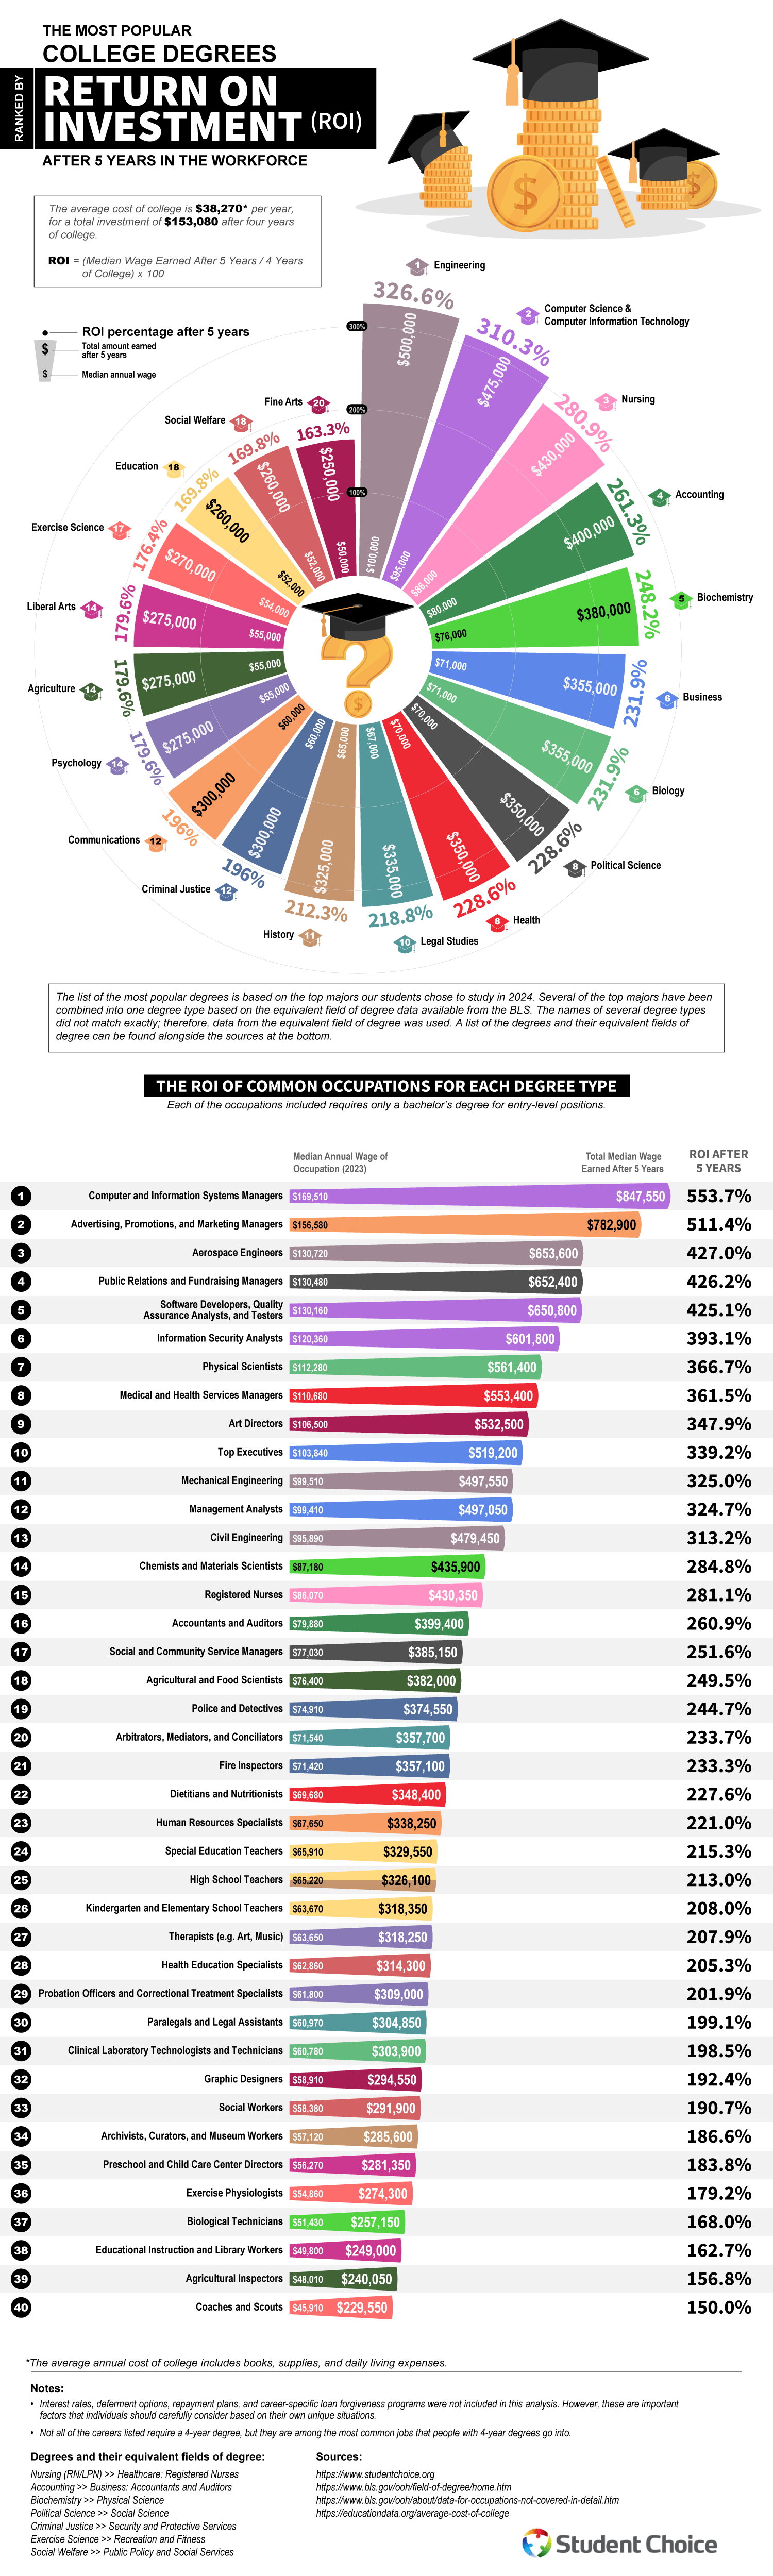
We can see STEM dominating the results, with an Engineering degree claiming the highest ROI at 326.6%. Computer Science earns second place with a 310.3% ROI, and Nursing has a 280.9% ROI. Student Choice gathered its data from the Bureau of Labor Statistics and compared five-year earnings to the cost of four years of college tuition. Unfortunately, Liberal Arts subjects are at the bottom of the list, although they still show a positive ROI. Education majors have a 169.8% ROI and Fine Arts have the lowest ROI at 163.3%.
The team also provided data on individual professions for which these majors qualify. The highest-paid engineers appear to be Aerospace engineers, with a whopping 427% ROI on their engineering degrees. Computer and IT Systems Managers with a degree in Computer Science have an even greater ROI, at 553.7%. Although Liberal Arts degrees have the lowest ROIs, there are still significant opportunities available in specific arts-related professions. For example, marketing managers can achieve a 511.4% ROI and earn degrees in Liberal Arts, Fine Arts, or Graphic Design to qualify. Art Directors show strong earning potential within the creative sector, with a 347.9% ROI.
Some might look at this data and conclude that they can aim for some of these careers without a four-year degree. Others might research how much more they would earn in the career path with a four-year degree. Many employers are willing to pay higher salaries to employees with higher levels of education. Some sectors offer student loan forgiveness options, which can help maximize ROI. There’s a public education loan forgiveness program that forgives student loans for teachers who work in low-income school districts for a certain length of time. Borrowers may find more flexible loan solutions from credit unions compared to federal loan systems as well. Data like this is key to helping prospective students plan for the future and achieve the best ROI.
While the data is useful and well-presented, all prospective students should consider several angles when making an important decision, like which major to declare. In addition to ROI, consider your personal instincts, financial circumstances, skills, and potential career satisfaction. While financial security is important and a strong ROI will help you secure it, job satisfaction is an important aspect of future happiness. Even so, Student Choice’s work here can help all prospective students plan for their financial future.

If you were to ask the average American on the street to name the industries that power the national economy, they’ll likely reply “manufacturing” or “tech.” But the Bureau of Economic Analysis says otherwise. As Ooma’s study shows, real estate, rental, and leasing hold the biggest slice of the U.S. economy.
In 2024, the U.S. produced more than $29 trillion in economic output, which outstripped Germany, China, and Japan combined. Looking at how gross domestic product (GDP) breaks down by industry shows the value added by sector after subtracting the costs of the inputs that industry consumed. For example, a carmaker buys steel, rubber, and semiconductors. The value added is the difference between those purchases and the selling price of the finished car. Add up that gap, the value added across every industry in the country, and you arrive at the GDP.
Click below to zoom.
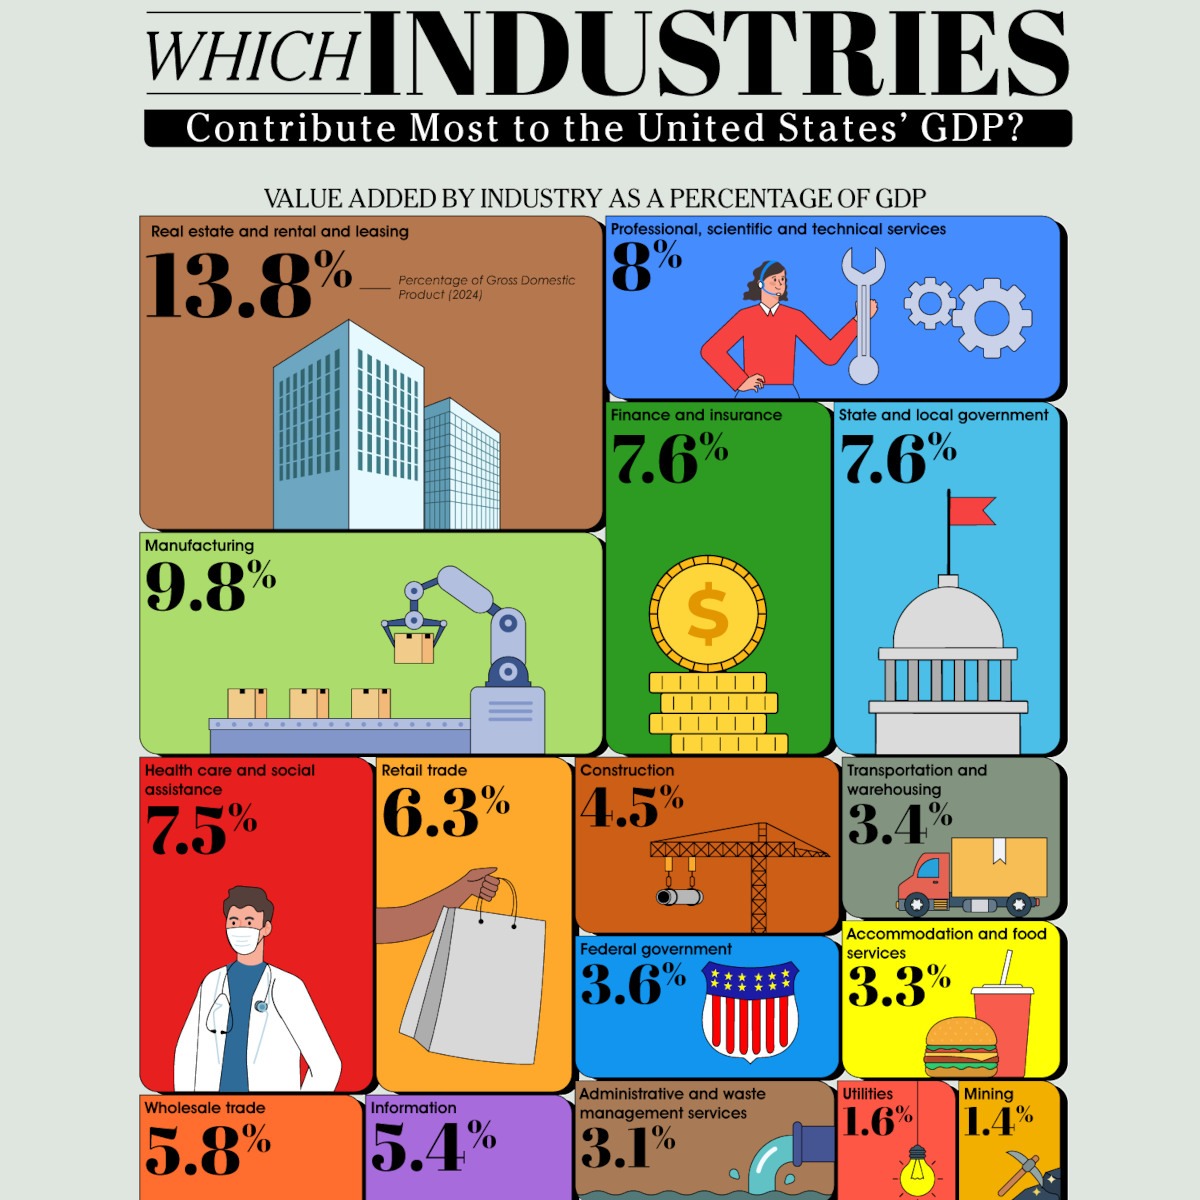
When Ooma ranked industries by their GDP, they found out that the money is concentrated in these industries:
Real estate, rental, and leasing – 13.8%: Real estate alone accounted for $3.68 trillion, the biggest of any sub-industry in the economy. Every mortgage payment, property tax bill, apartment lease, and commercial rent check pours into this sector. Rising home ownership costs over the past decade have pushed more citizens into renting, which has only inflated this industry.
Manufacturing – 9.8%: Factory employment has fallen for forty years due to automation and offshoring, but output hasn’t fallen. Chemical products created $554 billion, and computer and electronic products contributed $299.8 billion to the U.S. economy, helping keep the nation among the world’s top manufacturing nations despite a smaller workforce.
Professional, scientific, and technical services – 8.0%: This industry is made up of law firms, consultancies, engineering firms, and software developers. Legal services alone created $387.7 billion, and computer systems design added $552.2 billion to the American economy. This strongly shows how the American economy leans toward knowledge work.
Finance and insurance – 7.6%: Credit intermediation and Federal Reserve banks generated $1.01 trillion, insurance carriers contributed $791.8 billion, and securities and commodity contracts brought in $396.1 billion.
State and local government – 7.6%: Many rankings leave out these sectors, but government at the state and local level added $2.07 trillion, second only to real estate among all the sub-industries.
Health care and social assistance – 7.5%: Ambulatory care brought in $1.08 trillion and hospitals contributed $691.5 billion. This reflects genuine demand from an aging population and the fact that the U.S. spends more per capita on healthcare than any other developed nation.
Below these top-tier industries, retail trade, wholesale trade, information (Google, Meta, cloud providers, telecom), data processing, and internet publishing followed. Construction closed out the top ten industries at 4.5%, rising and falling in contributions with the real estate sector.
The largest components of American GDP aren’t the ones that produce a physical product. They’re the industries that manage property, deliver care, sell expertise, and move money.
Student Choice has published the 2026 updated version of its study, ranking the most popular college degrees by return on investment after five years in the workforce. The team’s premise is timely as they examine a hot topic: the cost of higher education. The average cost of college now exceeds $43,000 per year, so entering the workforce with these student loans became a high-stakes game. The analysis pairs the top 25 majors in 2026, based on a previous Student Choice study, with earnings data from the U.S. Bureau of Labor Statistics to calculate how much a graduate earns in their first five years relative to their four-year tuition investment. They illustrated their findings by ranking 20 degree types compared to 40 common occupations.
Click below to zoom.
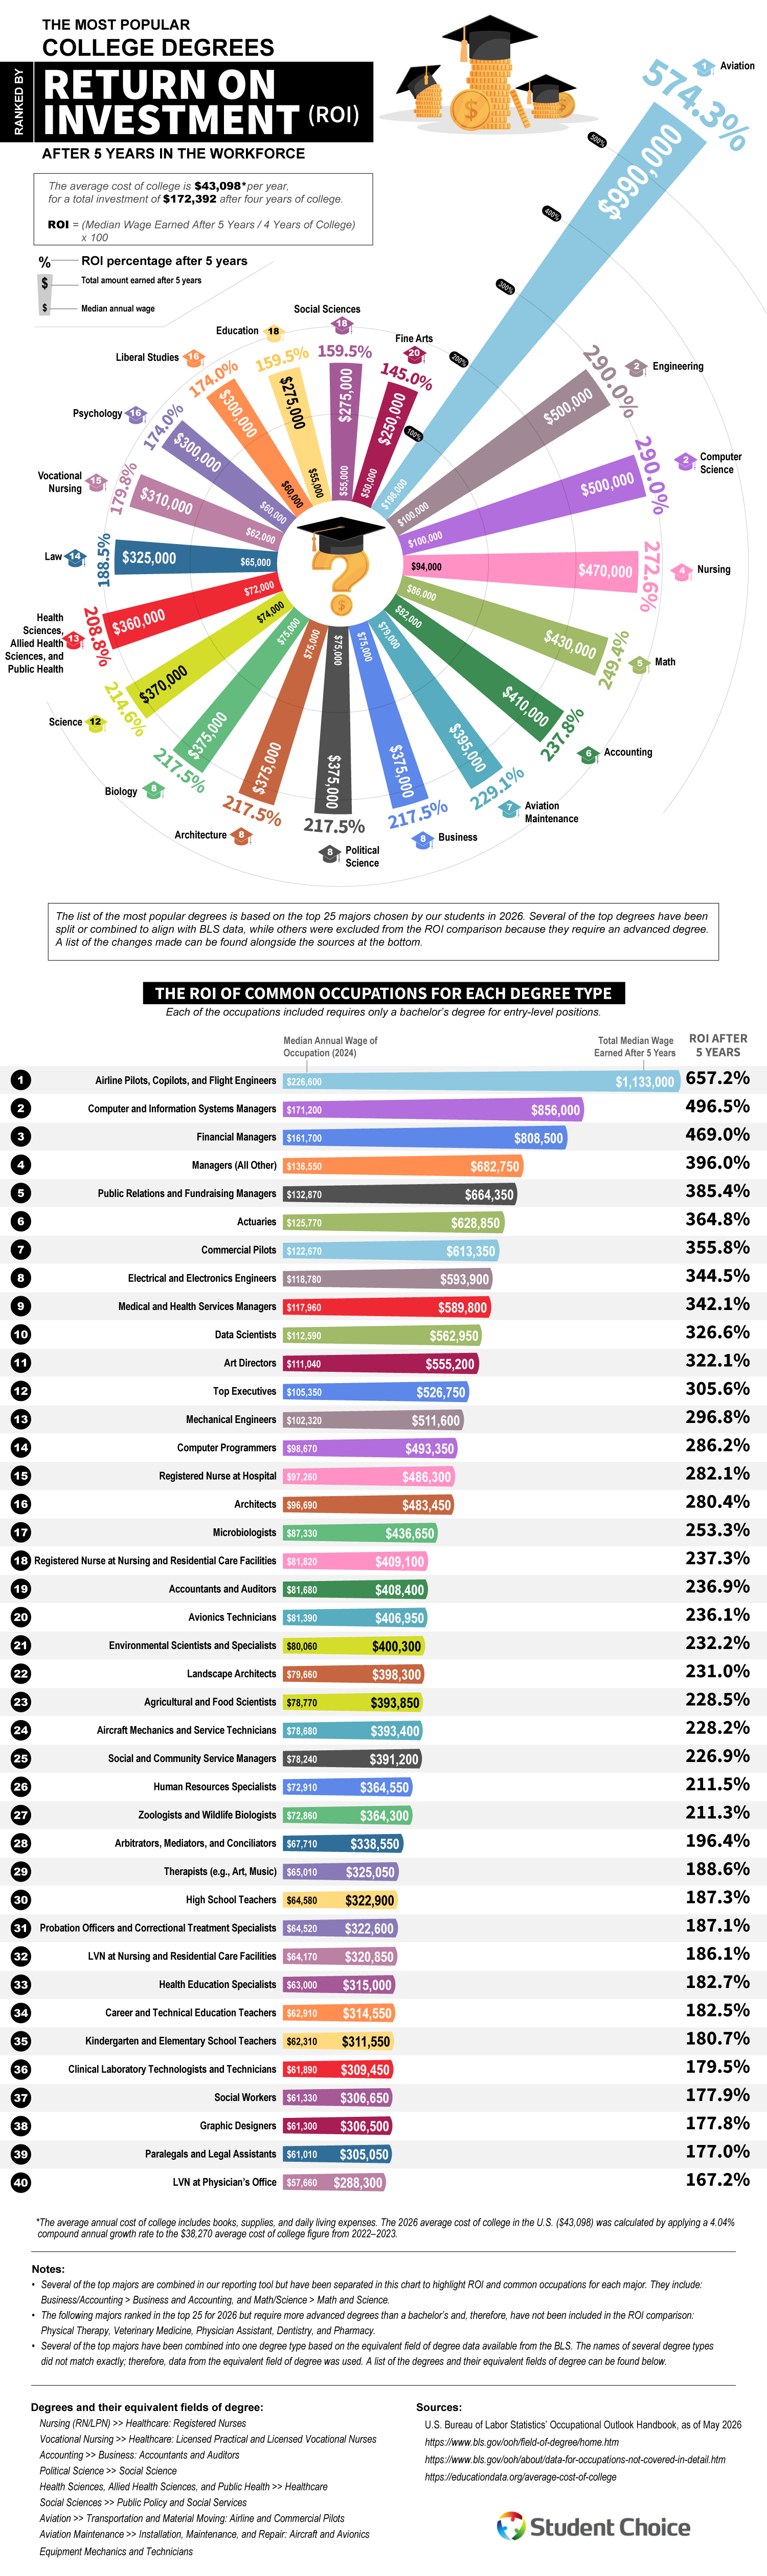
The team used a simple methodology. The average cost of college is $43,098 per year for a total investment of $172,392 for four years, with ROI calculated as median wages earned over five years divided by the four-year college cost. Majors that require advanced degrees like physical therapy, veterinary medicine, physician assistant, dentistry, and pharmacy were excluded from the ROI comparison even though these majors rank in the top 25.
Aviation tops the rankings chart, claiming the leading spot by a wide margin because of its astounding 574.3% ROI after five years, boosted by the median annual wage of $198,000. The field’s popularity is likely due to high pay and a looming pilot shortage as veteran airline workers retire. Engineering and computer science tied for second place at 290% each with median wages of $100,000 a year.
Healthcare and quantitative fields round out the upper tier. Nursing ranks fourth with an ROI of 272.6%, followed by math at 249.4% and accounting at 237.8%. Business, political science, architecture, and biology all tie for eighth at 217.5%, based on a $75,000 median wage. Education and social sciences sit near the bottom of the list at 159.5%, and fine arts at the bottom at 145%.
The study’s most helpful section might be the table that shows how career choice within a major can dramatically outperform the degree’s baseline. Aviation graduates who became airline pilots, copilots, or flight engineers reached a 652.7% return on a median wage of $226,600. Computer and information systems managers hit 496.5%, financial managers reached 469%, and public relations and fundraising managers reached 385.4%. Even lower-ranked majors can have exceptions. For example, fine arts majors who become art directors have a 322.1% return with a median salary of $111,040. Math majors working as actuaries earn 364.8%.
Overall, though, this study shows us that getting a degree pays off. Even accounting for student debt, the data suggests that degrees can double or triple the initial investment within five years. While most people will work for about four decades after student life, the returns will continue to compound. There is a growing preference for specialized, career-focused degrees with clear pathways into established professions so students can enjoy the ROIs we see here.
Student Choice has released the 206 updated version of its ongoing study tracking how America’s most popular college majors have changed over time. The analysis drew data from 105,623 student loan applications, using them as a proxy for where students are placing their bets on their future. The idea is that a student’s choice of major reveals more than their individual preferences. They can reflect labor shortages, salary expectations, emerging technologies, and shifting cultural attitudes about which degrees are most valuable. The team also supplied a graph comparing today’s top majors with those from four and eight years ago.
Click below to zoom.
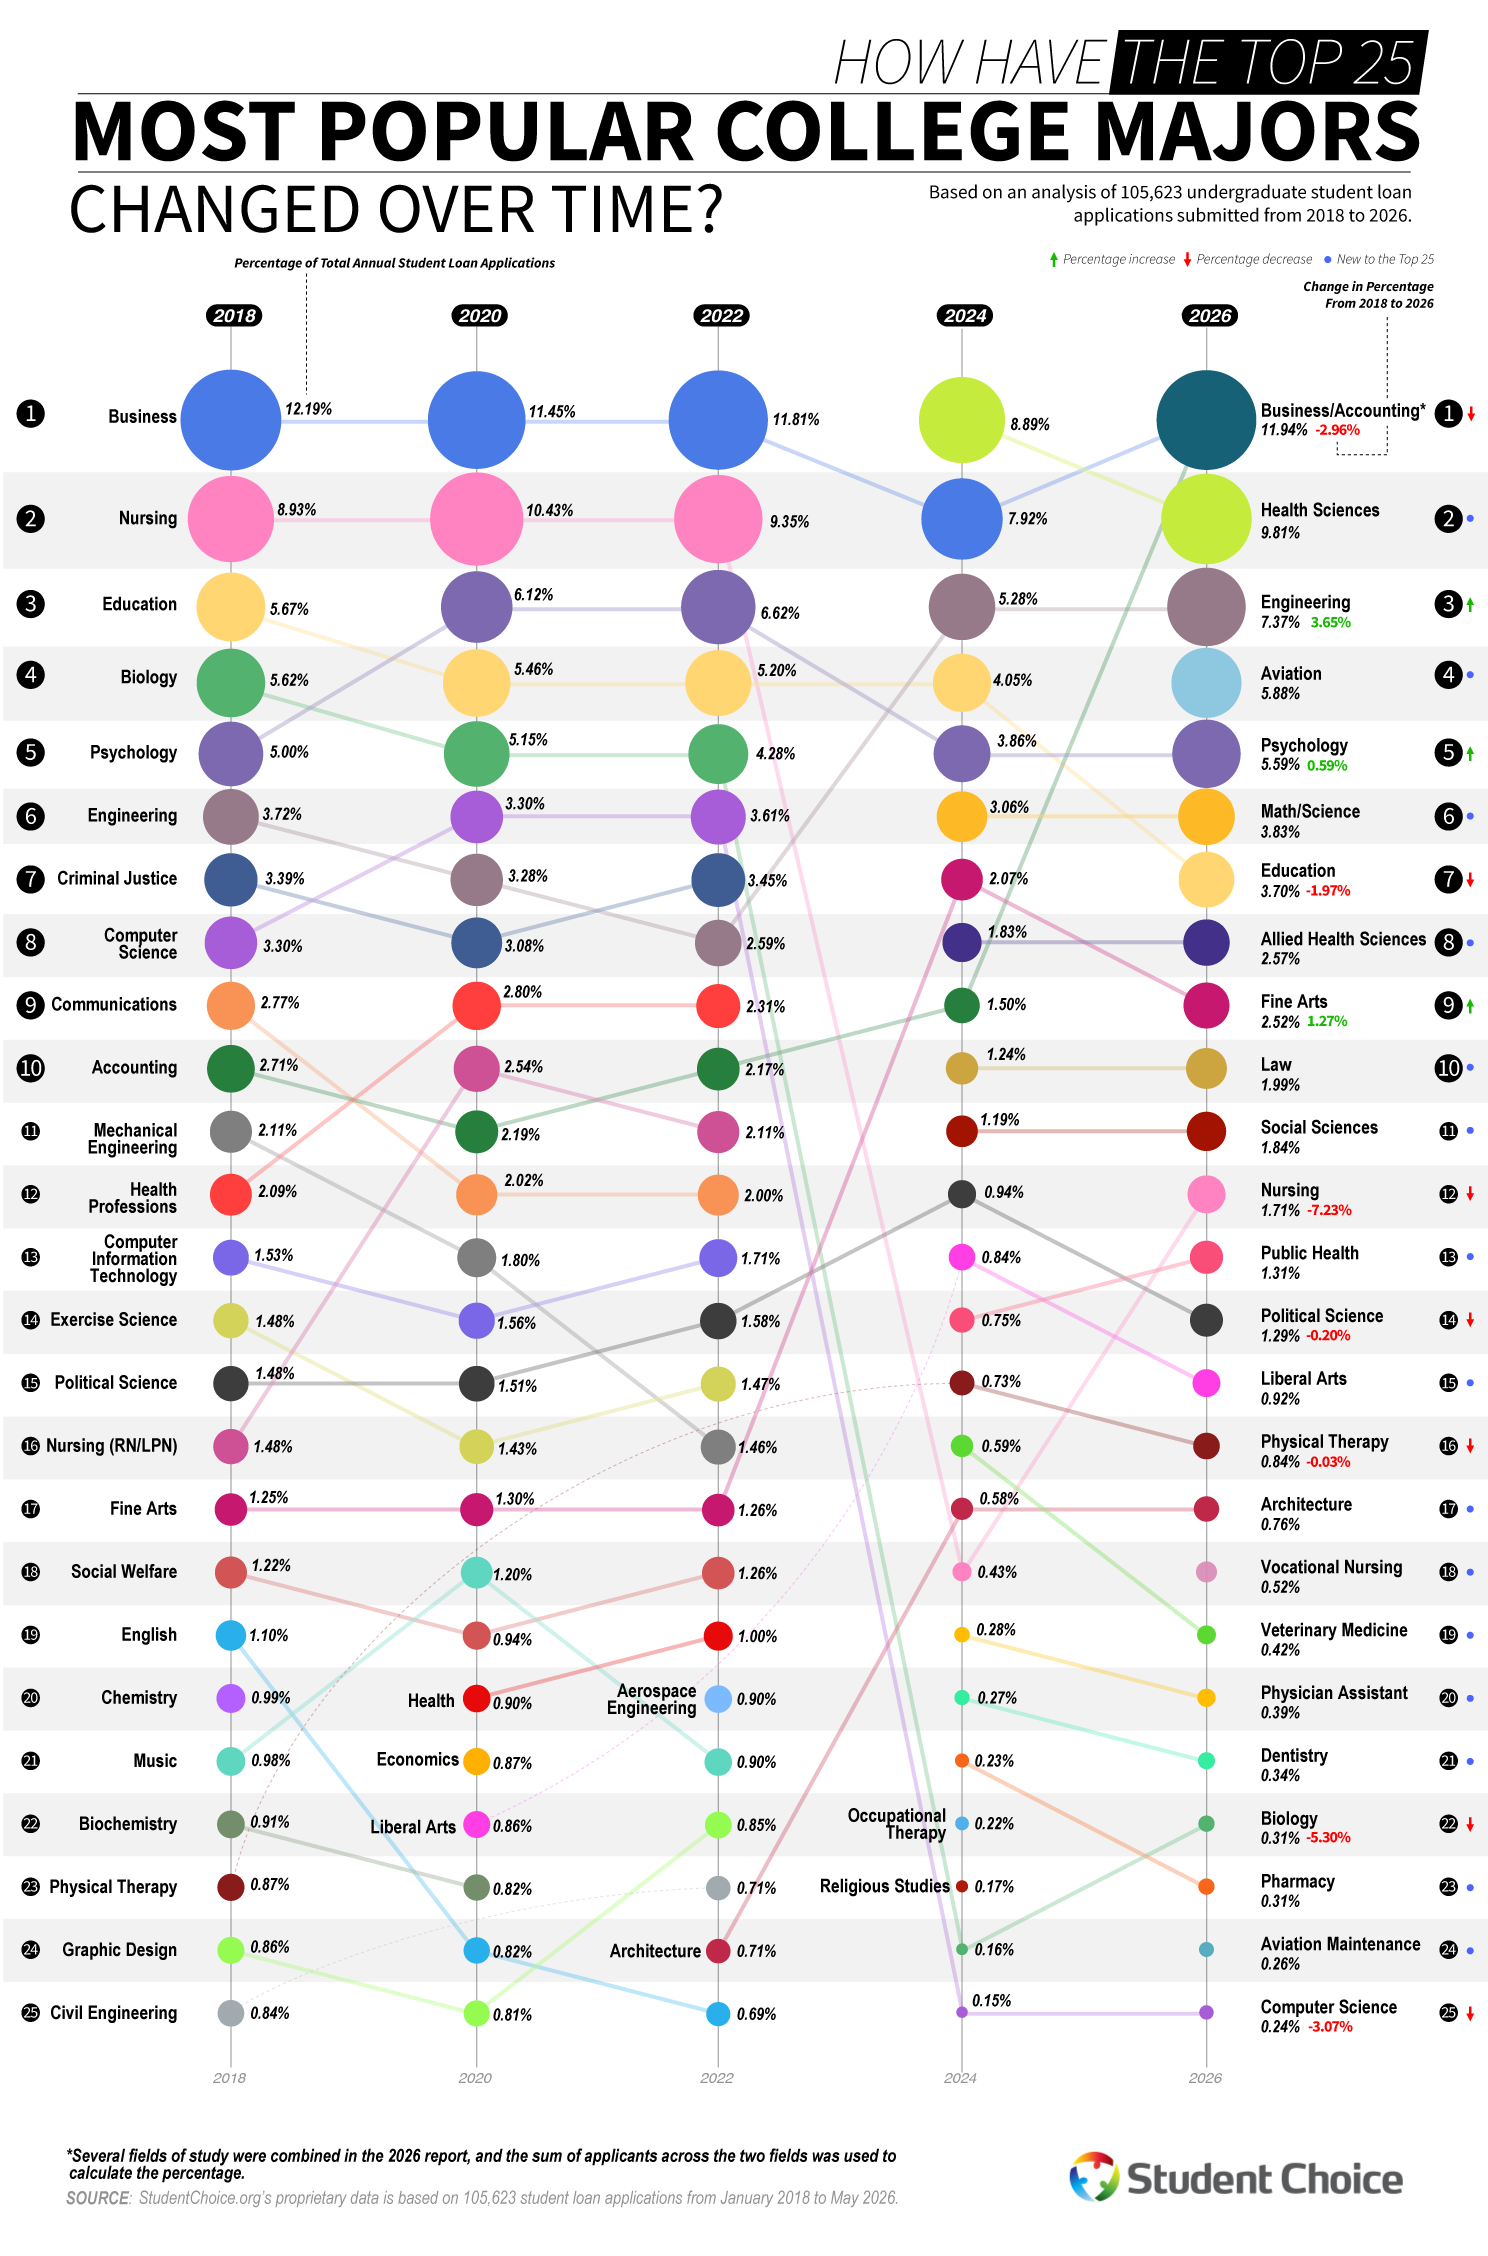
There has been a lot of disruption in recent years, but business majors have held steady. Business has been the leading major commanding between 11.45% and 12.81% of applications in 2017 and 2023. But that dominance has wobbled. In 2025, only 5.27% of applications were for a business major, but that percentage spiked back up in 2026 to 11.94%, still making it the most popular major.
Healthcare was consistently a top-two major for years, peaking in 2023 at 10.87% of applications. Now, nursing has tumbled to just 1.71% of applications in 2026. Health sciences replaced it to turn 9.81% with allied health sciences, public health, physical therapy, physician assistant studies, dentistry, and pharmacy, all landing in the top 25 of most popular majors.
The biggest growth seen in the study is in engineering and aviation. Engineering climbed from 3.91% to 7.37% in 2026. A 3.46-point gain is one of the biggest increases in this dataset. Aviation didn’t crack the top 25 of majors until 2025, when it had explosive growth, then settled into fourth place in 2026 at 5.88%. The surge in aviation maintenance rankings points to broader interest in the field, likely inspired by well-documented pilot shortages. When there’s a need, hungry young students will step up to fill it.
Psychology enjoyed modest and steady growth, inching from 4.99% in 2017 to 5.59% in 2026. Computer science took a surprising fall from a rising 3.61% to only .24% in 2026, ranking dead last in the top 25. Student Choice believes this could be due to some reporting category changes in 2025, but also speaks to the volatility of the tech job market.
Liberal arts and education lost ground, with education sliding from 5.99% of applications in 2017 to 3.70% in 2026. This decline is linked to teaching wages failing to keep up with other fields. Communications, English, and History all dropped off the top 25 entirely, yet Fine Arts bucked the trend, doubling in popularity from 1.35% to 2.25%, cracking the top ten most popular majors.
Overall, students are becoming more specialized and career-focused, drawn to healthcare, engineering, and aviation, while retreating from generalist majors and degrees that were once safe bets. The team at Student Choice cites finances as one of the biggest concerns central to a student’s decision on what major they choose
-
 Business Visualizations2 years ago
Everything Owned by Apple
-
 Business Visualizations2 years ago
America’s Most Valuable Companies Ranked by Profit per Employee
-
 Business Visualizations2 years ago
The Biggest Fortune 500 Company in Every State
-
 Business Visualizations1 year ago
The Biggest Employers by Industry
-

 Charts2 years ago
Map Uncovers Countries with Most Powerful Passports
-
 Business Visualizations11 months ago
The Largest Companies in America That Are Still Run by the Person Who Founded Them
-
 Timelines2 years ago
Timeline Charts the Development of Communications Technology
-

 Timelines2 years ago
The Evolution of Baby Names: A Century of Trends