
When you visit a mattress store or browse through mattress options online, there are a lot of choices that make...


None of us wants to worry about scams, theft, and safety while on vacation, but it’s an unfortunate reality in the world of vacation home rentals....
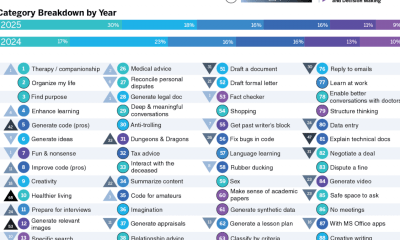

The team at Qualtrics released a fascinating new study on the 100 most common ways people are using AI in 2025. They gathered their data from...
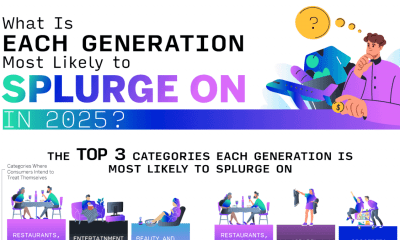

Spending money is a deeply personal choice, but it can still signal values, needs, and priorities on a larger scale. The team at Qualtrics specifically examined...


Cybercrimes are an all-too-common occurrence that every modern business needs to protect itself from. The team at Ooma makes a compelling case for this with a...


NapLab’s new study, “Most Popular Sex Positions,” is so much more than a cheeky peek at bedroom habits. It’s a fascinating examination of human intimacy, preference,...
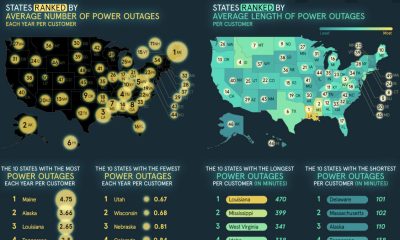

The team at Ooma sheds light on a common American annoyance: power outages. The team studied data from the U.S. Energy Information Administration to figure out...


Before the Internet, the traditional workday happened on-site or in an office space. Businesses relied on face-to-face interaction in customer service and functions. Physical presences were...


Fishing is one of America’s most popular pastimes, from families casting off their wooden docks to seasoned captains of offshore vessels. The Eastern American seaboard has...
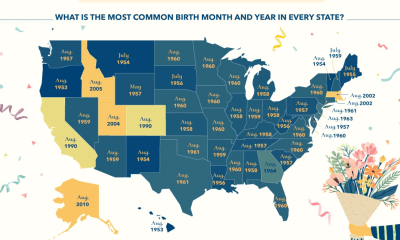

Have you ever noticed that certain months seem to have daily birthdays in your social circle? Kremp Florist’s new study shows birth patterns that reveal remarkable...


For years, the billionaire club was dominated by the likes of Elon Musk, Jeff Bezos, and Mark Zuckerberg, all men. However, this new infographic from the...