Charts
Ranking Every U.S. State as a Family Vacation Destination
There’s nothing better than a chart that can help out with complicated decisions. This graph from Florida Rentals can help you choose your next family vacation destination. Using factors that families find important in a travel destination, the team was able to rank every state in the U.S. by how great a family vacation destination it is. Here are the factors they used to create their scoring system:
- Hotel rooms per capita
- Restaurants per capita
- Museums per capita
- Total number of amusement parks
- Total miles of beaches
- Average annual temperature
- Cost of living
Click below to zoom
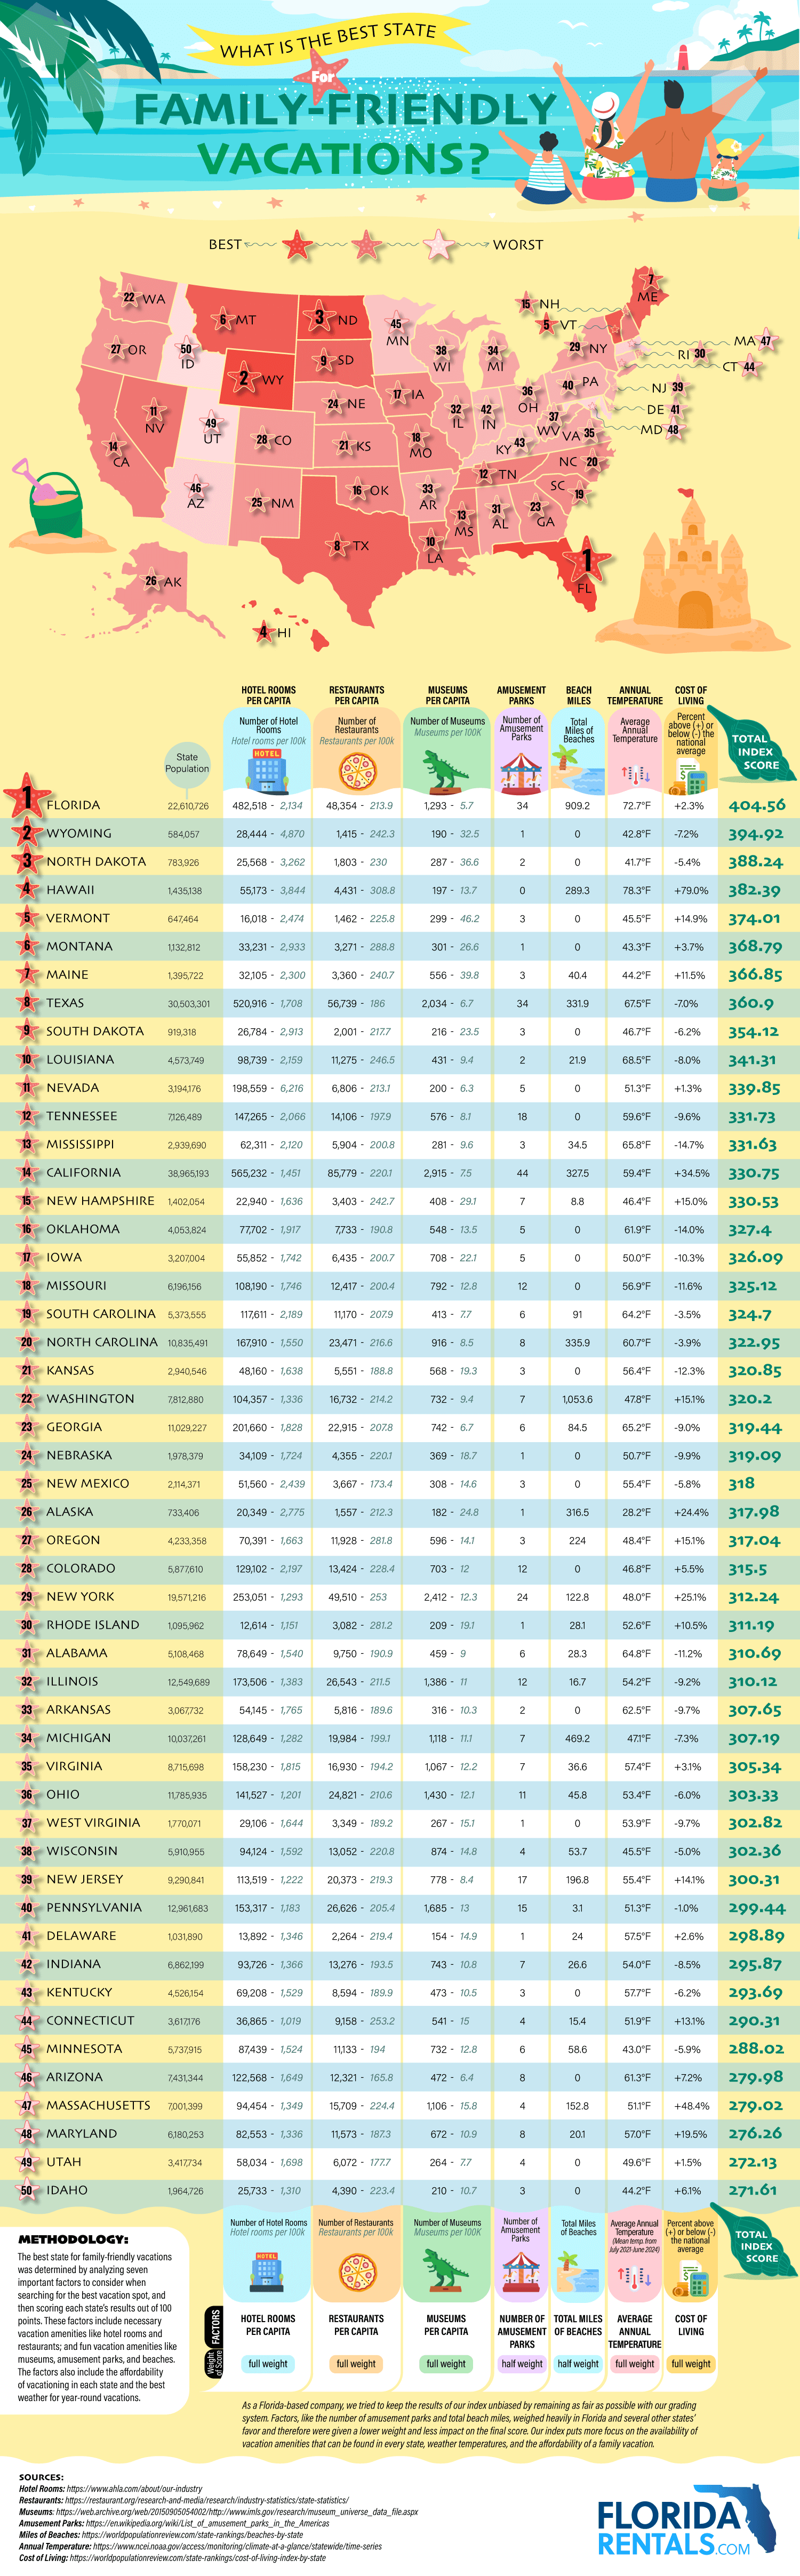
The team at Florida Rentals surely celebrated when their home state, Florida made the top of the list. This result probably doesn’t surprise you. After all, families from all over the world travel to the sunshine state to enjoy the over 900 miles of beaches and to visit top attractions like Sea World, Universal Studios, and Walt Disney World. Combine that with great weather, plenty of hotels and restaurants, and affordable places to stay and there’s no doubt that Florida earned its top spot.
Here’s the top ten states on the list:
- Florida
- Wyoming
- North Dakota
- Hawaii
- Vermont
- Montana
- Maine
- Texas
- South Dakota
- Louisiana
Wyoming might be a surprise, but it actually has a huge number of hotels and museums per capita, making it a great destination for families that want to beat the heat and learn something while doing it. The same is true of North Dakota in the number 3 spot.
Explore the details in the infographic to find out what each and every state has to offer as well as potential drawbacks to planning a vacation there. Some states are expensive, others have extreme weather, and some might be chock full of amusement parks. Your number one will depend on your family’s priorities!
Most of us get tired of brands asking for our phone numbers and email addresses because we’re spammed with too many advertisements. But sometimes, providing your contact information will connect you with a brand’s loyalty program, which can offer discounts, free prizes, and cash back. One in ten companies has a loyalty rewards program, so the team at Qualtrics decided to analyze which one gives you the biggest return on investment. They focused only on base-level, free-to-join programs that give customers rewards through regular shopping; that way, the results truly reflect the rewards you earn for the money you spend.
Click below to zoom.
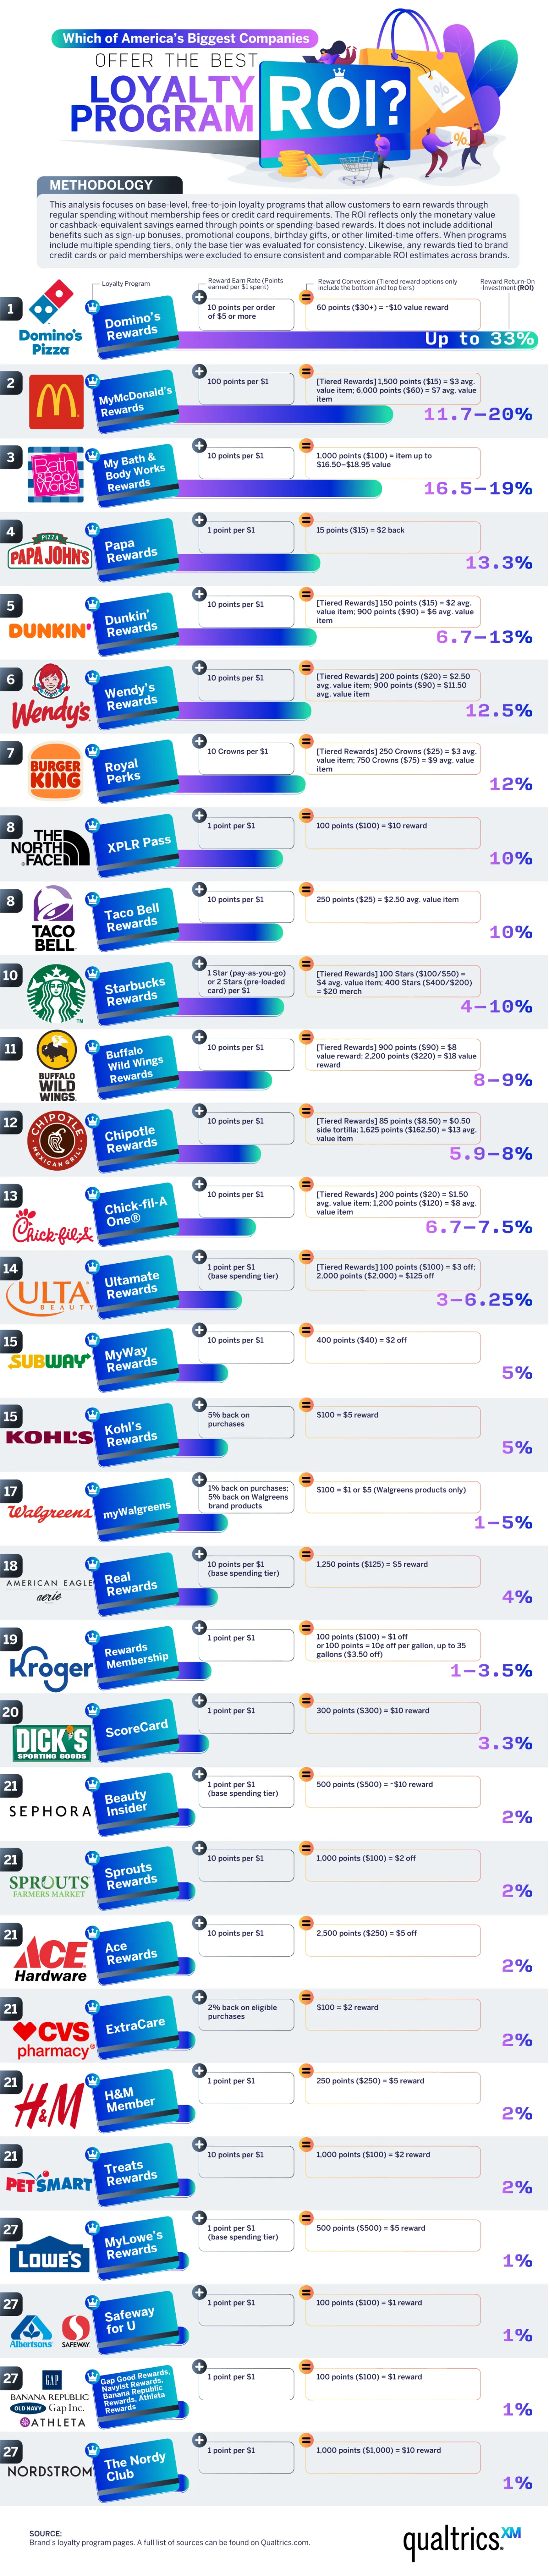
In the food and beverage industry, Domino’s Pizza offers the best ROI. The team calculated an almost 33% ROI for Dominos, which is by far the best offer, even across industries. You’ll receive about $10 of free food for every $30 spent. McDonald’s isn’t far behind at an 11 to 20% ROI with the MyMcDonald’s Rewards app. You’ll earn 100 points for every dollar spent, and you can use these points to purchase menu items. Papa John’s, Dunkin’, Wendy’s, and Burger King also have strong programs, with ROIs between 10% and 13%. The fast-food industry offers some of the best loyalty programs, earning eight out of the ten best rewards programs on the list.
In the retail and beauty space, Bath & Body Works leads with a 16.5%–19% ROI through the My Bath & Body Works Rewards program. The program allows shoppers to redeem points earned through purchases for free items, early access to sales, and an annual birthday gift. Ulta Beauty’s Ultamate Rewards program offers a decent ROI, too, at 3% to 6% for items that are normally on the expensive side. Their competitor Sephora has a Beauty Insider program that offers a lower 2% ROI, but exclusive free samples and early access to new products supplement it.
Brand rewards are weaker among clothing retailers. H&M, Gap Inc., and American Eagle/Aerie offer a 1%–4% ROI. These programs are still useful for loyal shoppers who know they’ll buy from these brands repeatedly.
Pharmacy and grocery store rewards can be a great help for budget-savvy shoppers. These stores have lower ROIs but can still offer decent rewards. Walgreens’ program took the lead, offering 1% back on most purchases and 5% back on Walgreens’ brand products, resulting in significant savings on generics. CVS has an ExtraCare program with a higher 2% ROI and personalized coupons.
In the grocery sector, Kroger and Safeway/Albertsons offer the highest ROIs, between 1% and 3.5%. These chains also offer a fuel rewards program that can be an incredible budget-saving boon. Lowe’s and Ace Hardware offer 1%–2% rewards programs that may be most helpful to frequent shoppers and small business owners who need materials from these stores.
Outdoor lovers and athletes can earn powerful rewards through the North Face’s XPLR Pass, which offers a 10% ROI, and the Dick’s Sporting Goods ScoreCard program offers a 3.3% ROI. The findings on this chart can help you save big the next time you shop!
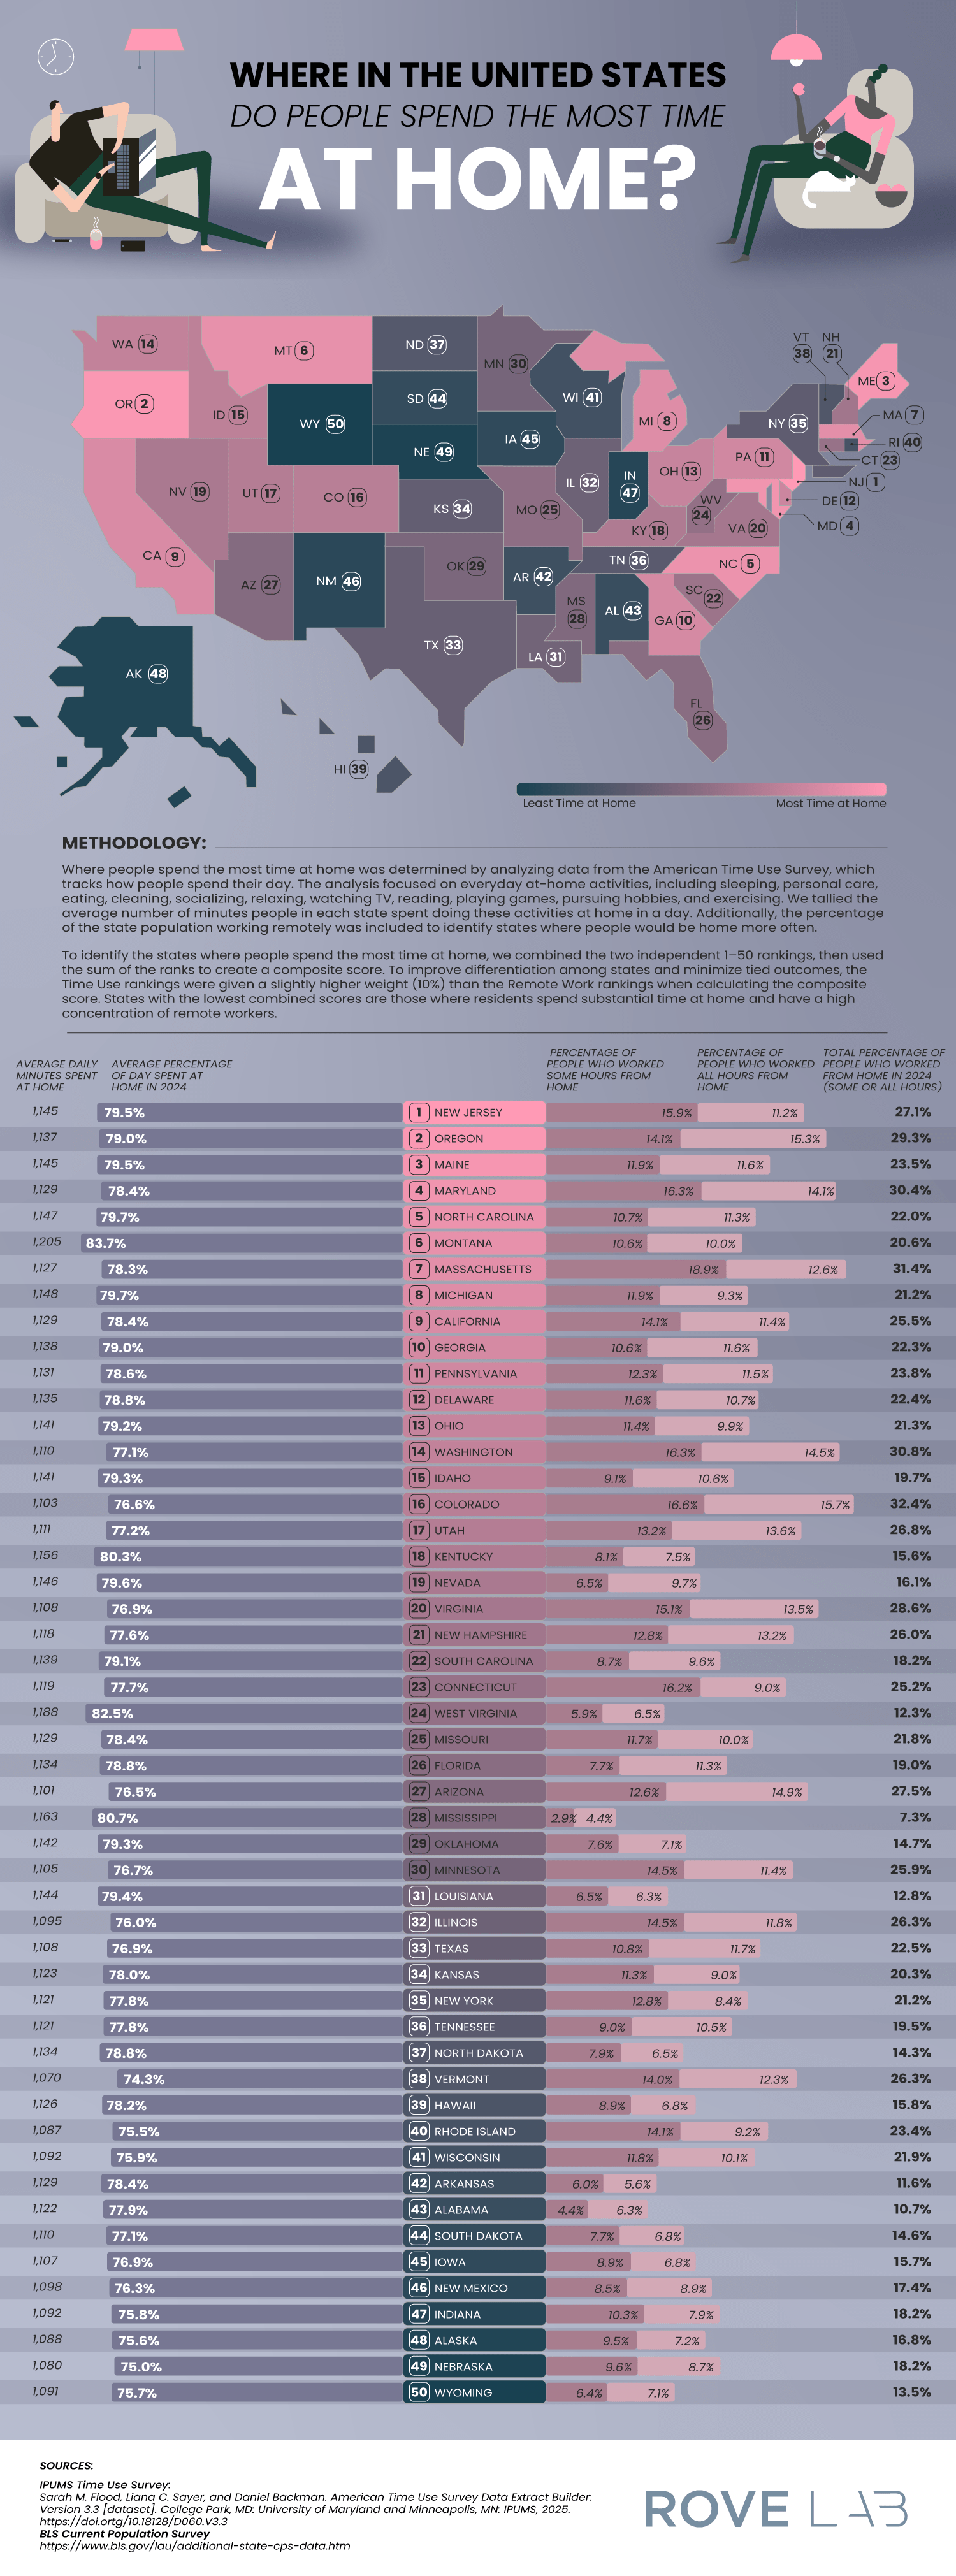
A new article from RoveLab presents a data-driven exploration of home-life habits in the United States, examining how much time Americans spend at home and how that changes across each state. Drawing on data from the American Time Use Survey and the Integrated Public Use Microdata Series, the study constructs a ranking of states based on how much time residents spend at home. This data combined at-home activity levels with remote work prevalence.
RoveLab situates its analysis within broader behavioral shifts in the American lifestyle. On average, Americans spend around 18 hours per day at home (including sleep), which reflects a gradual decline in time spent outside the home over the past two decades. This trend pre-dates the COVID-19 pandemic, which spiked time spent at home and prompted the rise of remote work.
Click below to zoom.
Other important facts on time spent at home add more context:
- 80% of Americans engage in daily household activities like cleaning, cooking, and home maintenance.
- 94% of Americans participate in leisure activities at home, including gaming, socializing, and exercise.
- Most Americans watch about 3.57 hours of television daily, which is more than the average amount of daily time spent on household tasks.
These statistics show that a home is the central site of both productivity and leisure, underscoring the growing connection between work and private life.
To determine which state residents are the most homelife-centric, the researchers developed a scoring system that incorporated:
- Average percentage of the day spent at home
- Average daily minutes spent at home
- Percentage of residents working remotely
- Weighted ranking emphasizing time-use data slightly more than remote work numbers
This multi-factor approach shows the team’s effort to balance behavioral statistics with labor trends, offering a comprehensive view of domestic time use.
The team found that residents in these states spend the most time at home:
- New Jersey: 5% of the day is spent at home (1,1495 minutes) and 27.1% of residents work remotely.
- Oregon: 79% of the day is spent at home and 29.3% of residents work remotely.
- Maine: 79% of the day is spent at home and 23.5% of residents work remotely.
New Jersey’s lead position is due to several structural factors, such as its proximity to major employment centers and a highly educated workforce, with over 40% of residents holding a bachelor’s degree. These factors create a population ideal for telecommuting. It shows us that socioeconomic factors can shape our daily routines.
At the low end of the scoring, Wyoming ranks as the state where people spend the least amount of time at home. This reflects a low rate of remote work. Montana relies on industries like agriculture, mining, and tourism, which all require in-person workers. The team also speculates that Wyoming’s emphasis on outdoor recreation leads residents to both work and play outside their homes.
By combining time-use data with employment patterns, the study provides valuable insight into how regional differences, evolving job requirements, and leisure habits shape modern American life.
An article from LLC Attorney.com offers one of the most detailed, data-rich comparisons of how much major gig and marketplace platforms extract in fees from workers’ earnings versus how much the workers keep. This article goes beyond anecdotal evidence and offers practical insights alongside raw data. Every freelancer, business owner, and part-time gig worker should understand the information presented here so they can wisely choose where to sell their products and services.
Click below to zoom.
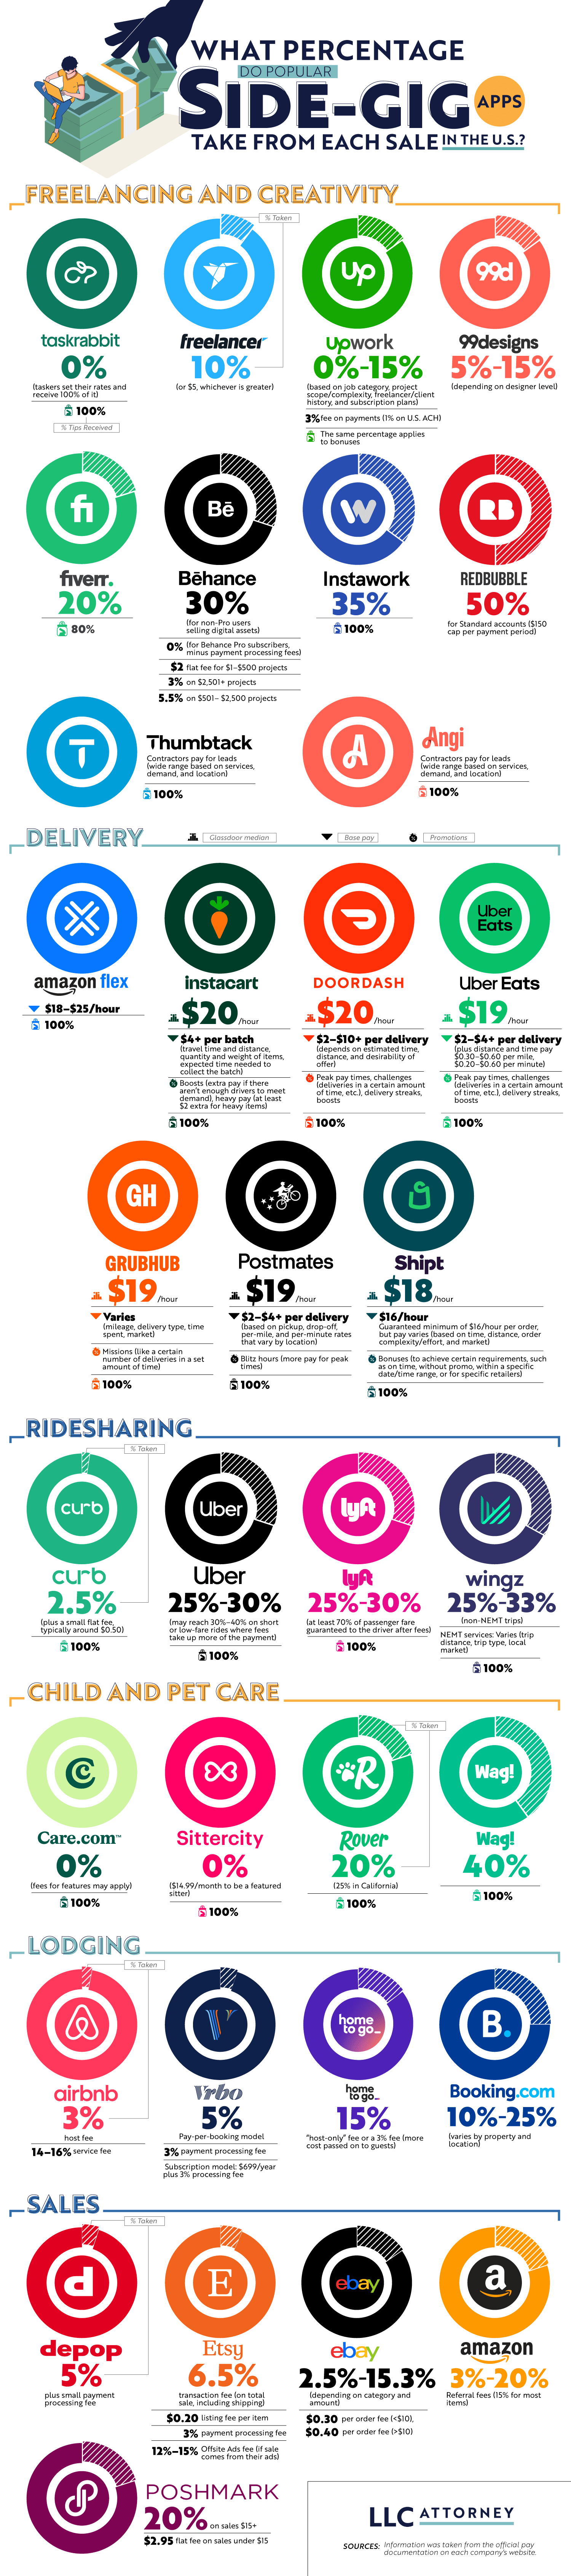
The article’s most important message is that platforms vary widely in how much they take from earnings. These differences can have a big impact on the workers’ bottom line. Here are some examples:
Rideshare Apps: Major platforms like Lyft and Uber typically take about 25% to 30% of passenger fares, and in some cases more for low-priced trips. Drivers do get to keep 100% of tips.
Delivery Services: Delivery gig earnings are reported as base pay plus tips. Workers receive the full tip amount, but pay varies by platform and market demands.
Creative Marketplaces: Platforms like Etsy charge a 6.5% transaction fee on their total sale price, plus a payment processing fee of around 3%. There are also optional advertising fees, so the total fee is about 10%. Poshmark takes 20% of sales over $15.
Pet Care Apps: Some pet care apps, like Rover, take about 20% of earnings in fees, while Wag takes a significantly higher portion, around 40%.
The article also discussed lodging and rental platforms. Hosts on Airbnb pay a 3% host service fee, plus a guest service fee of approximately 14% to 15%. Platforms like Vrbo and Booking.com have variable fee structures that usually land between 10% and 25%, depending on the model.
What makes this article especially useful is the visual chart, which lets you quickly peruse and compare dozens of apps. If a worker juggles multiple platforms, let’s say they’re a DoorDash delivery driver, have an Etsy shop, and flip items on Poshmark, they can compare all these platforms quickly and decide which are the most profitable. This is also crucial information to help people set prices effectively.
The article places these fees in the context of the gig economy boom. Millions of people supplement their income and build independent businesses using these apps. About 16.6% of side hustlers report delivery or ride-sharing gig work as their part-time side hustle, with an online shop and freelancing close behind. Recent surveys show that 70% of Americans earn extra cash through side gigs, often via the apps listed in the chart. Even so, many users underestimate the extent of platforms’ control over visibility, fees, and pricing.
Understanding each platform’s fee structures is integral to a financial platform. These fees and the pricing workers set can have a strong influence on whether a side hustle is profitable. The information presented here is a decision-making tool that combines clear, comparative data with important context to help side hustlers succeed in their ventures.
-

 Business Visualizations1 year ago
Everything Owned by Apple
-

 Business Visualizations1 year ago
America’s Most Valuable Companies Ranked by Profit per Employee
-

 Business Visualizations1 year ago
The Biggest Fortune 500 Company in Every State
-

 Business Visualizations10 months ago
The Biggest Employers by Industry
-

 Business Visualizations2 years ago
New Animated Map Shows Airbnb’s Fully Booked Cities Along the 2024 Eclipse Path of Totality
-

 Timelines1 year ago
Timeline Charts the Development of Communications Technology
-

 Charts2 years ago
How Many Crayola Crayon Colors Are There? A Lot.
-

 Business Visualizations6 months ago
The Largest Companies in America That Are Still Run by the Person Who Founded Them