Business Visualizations
The Biggest Fortune 500 Company in Every State
Every year, Fortune magazine publishes its much-anticipated Fortune 500 list. This list is meticulously analyzed by company owners, investors, and influential figures in the business world. So, what makes the Fortune 500 so significant? In this article, our team at The Chartistry provides an in-depth examination of the list, exploring why it attracts so much attention and what it takes for a company to be included.
Click below to zoom
What is the Fortune 500?
The Fortune 500 is the finance magazine’s list of the 500 most profitable companies in the United States. The company ranked at the top of the list brings in the most revenue based on its financial documents from the most recent fiscal year. The Fortune 500 list for 2024 has Walmart ranked in the top spot with revenue of $648.125B. In fact, this giant retail store has been ranked number one for the last eleven years.
What Does It Take to Make It Onto the Fortune 500?
To become a Fortune 500 company, a business must be incorporated and conduct operations in the U.S. In addition, the company’s financial documents must be public for it to be considered by Fortune.
Why Do Companies Want to Be on This List?
Fortune magazine published its first list of the top 500 U.S. companies in 1955. Since then, the presence of reputable companies such as Exxon Mobil, Goldman Sachs Group, and General Mills has given the list an air of prestige. Plus, these 500 businesses bring in incredible amounts of revenue and contribute to the strength of our economy. Wouldn’t you want your company to appear on a list alongside Walmart, Amazon, and Berkshire Hathaway?
Have Any Companies Appeared on the Fortune 500 for Decades?
Yes, some companies have made repeated appearances. Some famous names have been on the list every year since 1955, including Kellogg, Chevron, and Exxon Mobil, to name a few.
Fortune 500 Companies by State
Walmart, the number one ranked company on the Fortune 500, is located in Arkansas, with its headquarters in Bentonville. Fortune’s number two company, Amazon, is the biggest in Washington, with its headquarters in Seattle. Exxon Mobil is the biggest Fortune 500 company in Texas, and it does business out of Houston.
An interesting thing to note about this list is that not all 50 states are home to a Fortune 500 company. The states without one include:
- Alaska
- Hawaii
- Maine
- Mississippi
- Montana
- New Hampshire
- New Mexico
- North Dakota
- South Dakota
- Utah
- Vermont
- West Virginia
- Wyoming
The Largest Fortune 500 Company Headquartered in Each State
| State | Biggest Fortune 500 Company |
Location of Headquarters |
Fortune 500 Rank (2023) |
2023 Revenue (in millions) |
Percent Change in Revenue From 2022 |
| Alabama | Regions Financial | Birmingham, AL |
483 |
$7,531 |
14% |
| Alaska | N/A | N/A | N/A | N/A | N/A |
| Arizona | Avnet | Phoenix, AZ |
163 |
$24,311 |
24.4% |
| Arkansas | Walmart | Bentonville, AR |
1 |
$611,289 |
6.7% |
| California | Apple | Cupertino, CA |
4 |
$394,328 |
7.8% |
| Colorado | Arrow Electronics | Centennial, CO |
109 |
$37,124 |
7.7% |
| Connecticut | Cigna Group | Bloomfield, CT |
15 |
$180,516 |
3.7% |
| Delaware | DuPont | Wilmington, DE |
250 |
$16,549 |
-3.6% |
| District of Columbia | Fannie Mae | Washington, D.C. |
28 |
$121,596 |
19.7% |
| Florida | World Kinect | Miami, FL |
70 |
$59,043 |
88.4% |
| Georgia | Home Depot | Atlanta, GA |
20 |
$157,403 |
4.1% |
| Hawaii | N/A | N/A | N/A | N/A | N/A |
| Idaho | Albertsons | Boise, ID |
53 |
$71,887 |
3.2% |
| Illinois | Walgreens Boots Alliance | Deerfield, IL |
27 |
$132,703 |
-10.7% |
| Indiana | Elevance Health | Indianapolis, IN |
22 |
$156,595 |
13% |
| Iowa | Principal Financial | Des Moines, IA |
236 |
$17,492 |
22.6% |
| Kansas | Seaboard | Merriam, KS |
364 |
$11,243 |
21.8% |
| Kentucky | Humana | Louisville, KY |
42 |
$92,870 |
11.8% |
| Louisiana | Lumen Technologies | Monroe, LA |
237 |
$17,478 |
-11.2% |
| Maine | N/A | N/A | N/A | N/A | N/A |
| Maryland | Lockheed Martin | Bethesda, MD |
60 |
$65,984 |
-1.6% |
| Massachusetts | General Electric | Boston, MA |
52 |
$76,555 |
3.2% |
| Michigan | Ford Motor | Dearborn, MI |
19 |
$158,057 |
15.9% |
| Minnesota | UnitedHealth Group | Minnetonka, MN |
5 |
$324,162 |
12.7% |
| Mississippi | N/A | N/A | N/A | N/A | N/A |
| Missouri | Centene | St. Louis, MO |
25 |
$144,547 |
14.7% |
| Montana | N/A | N/A | N/A | N/A | N/A |
| Nebraska | Berkshire Hathaway | Omaha, NE |
7 |
$302,089 |
9.4% |
| Nevada | MGM Resorts International | Las Vegas, NV |
315 |
$13,128 |
35.6% |
| New Hampshire | N/A | N/A | N/A | N/A | N/A |
| New Jersey | Johnson & Johnson | New Brunswick, NJ |
40 |
$94,943 |
1.2% |
| New Mexico | N/A | N/A | N/A | N/A | N/A |
| New York | JPMorgan Chase | New York, NY |
23 |
$154,792 |
21.7% |
| North Carolina | Bank of America | Charlotte, NC |
32 |
$115,053 |
22.6% |
| North Dakota | N/A | N/A | N/A | N/A | N/A |
| Ohio | Cardinal Health | Dublin, OH |
14 |
$181,364 |
11.6% |
| Oklahoma | Oneok | Tulsa, OK |
173 |
$22,387 |
35.3% |
| Oregon | Nike | Beaverton, OR |
93 |
$46,710 |
4.9% |
| Pennsylvania | Cencora | Conshohocken, PA |
11 |
$238,587 |
11.5% |
| Rhode Island | CVS Health | Woonsocket, RI |
6 |
$322,467 |
10.4% |
| South Carolina | Sonoco Products | Hartsville, SC |
498 |
$7,251 |
29.7% |
| South Dakota | N/A | N/A | N/A | N/A | N/A |
| Tennessee | FedEx | Memphis, TN |
41 |
$93,512 |
11.4% |
| Texas | Exxon Mobil | Houston, TX |
3 |
$413,680 |
44.8% |
| Utah | N/A | N/A | N/A | N/A | N/A |
| Vermont | N/A | N/A | N/A | N/A | N/A |
| Virginia | Freddie Mac | McLean, VA |
45 |
$86,717 |
31.6% |
| Washington | Amazon | Seattle, WA |
2 |
$513,983 |
9.4% |
| West Virginia | N/A | N/A | N/A | N/A | N/A |
| Wisconsin | Northwestern Mutual | Milwaukee, WI |
111 |
$36,921 |
0.5% |
| Wyoming | N/A | N/A | N/A | N/A | N/A |
Do Some States Have More Than One Fortune 500 Company?
Yes, several states have multiple companies on the list. Texas leads with 55 companies on the Fortune 500, followed by California with 52 and New York with 50. These states all boast a large population and bustling metropolitan areas.
Do Some States Have Just One Fortune 500 Company?
Yes, some states on the list are home to just one. These states include Delaware, Kansas, Kentucky, and South Carolina. In terms of total population, each of these states ranks in the lower half on the list of 50. Delaware has the lowest population, with 1,044,320 people in 2024.
Are Some Cities Home to More Than One Fortune 500 Company?
Absolutely! In fact, some cities serve as the home base for multiple Fortune 500 companies. Some notable examples include:
Chicago
Illinois has 33 Fortune 500 companies, including Walgreens, McDonald’s, and United Airlines, among others. Dozens of these companies are headquartered in the Chicago area.
Houston
Of the 55 Fortune 500 companies in Texas, Houston is home to 21. Exxon Mobil, Sysco, and Hewlett Packard Enterprise (HPE) are just a few of the impressive companies in the collection.
Atlanta
According to our chart, the biggest Fortune 500 company in Georgia is Home Depot, ranked at number 20. But Home Depot is not alone. There are 18 Fortune 500 companies in Atlanta, including Aflac, Delta Air Lines Inc., The Coca-Cola Company, UPS, and others.
Make sure to explore our other lists and visuals, which provide insight into the world of big business. One list ranks companies by employee profits (which happens to be one of our original visualizations), while another categorizes the most profitable companies by industry. It’s no surprise that many Fortune 500 companies frequently appear on various lists throughout the year, highlighting their achievements.
The Number of Fortune 500 Companies in Each State
| State | State Abbreviation | Number of Fortune 500 Companies in Each State |
| Texas | TX |
55 |
| California | CA |
52 |
| New York | NY |
50 |
| Illinois | IL |
33 |
| Ohio | OH |
24 |
| Virginia | VA |
24 |
| Florida | FL |
23 |
| Pennsylvania | PA |
23 |
| Georgia | GA |
19 |
| Michigan | MI |
18 |
| Massachusetts | MA |
17 |
| Minnesota | MN |
15 |
| Connecticut | CT |
14 |
| New Jersey | NJ |
14 |
| North Carolina | NC |
13 |
| Washington | WA |
12 |
| Arizona | AZ |
10 |
| Colorado | CO |
10 |
| Tennessee | TN |
10 |
| Missouri | MO |
8 |
| Wisconsin | WI |
8 |
| Indiana | IN |
7 |
| Oklahoma | OK |
6 |
| Arkansas | AR |
4 |
| Nebraska | NE |
4 |
| Rhode Island | RI |
4 |
| Idaho | ID |
3 |
| Maryland | MD |
3 |
| Alabama | AL |
2 |
| District of Columbia | DC |
2 |
| Iowa | IA |
2 |
| Louisiana | LA |
2 |
| Nevada | NV |
2 |
| Oregon | OR |
2 |
| Delaware | DE |
1 |
| Kansas | KS |
1 |
| Kentucky | KY |
1 |
| South Carolina | SC |
1 |
| Alaska | AK |
0 |
| Hawaii | HI |
0 |
| Maine | ME |
0 |
| Mississippi | MS |
0 |
| Montana | MT |
0 |
| New Hampshire | NH |
0 |
| New Mexico | NM |
0 |
| North Dakota | ND |
0 |
| South Dakota | SD |
0 |
| Utah | UT |
0 |
| Vermont | VT |
0 |
| West Virginia | WV |
0 |
| Wyoming | WY |
0 |
Source:


AI is spreading rapidly, especially in the workplace. According to surveys, 46% of American workers have used AI a few times in the past year. As the AI industry rapidly expands, Ooma examined how quickly U.S. states are adopting artificial intelligence in the workplace with a data-driven snapshot of current usage and future expectations. Using U.S. Census Bureau survey data, the team’s work highlights geographic trends and broader implications for business as AI becomes more enmeshed in daily business dealings.
Click below to zoom.
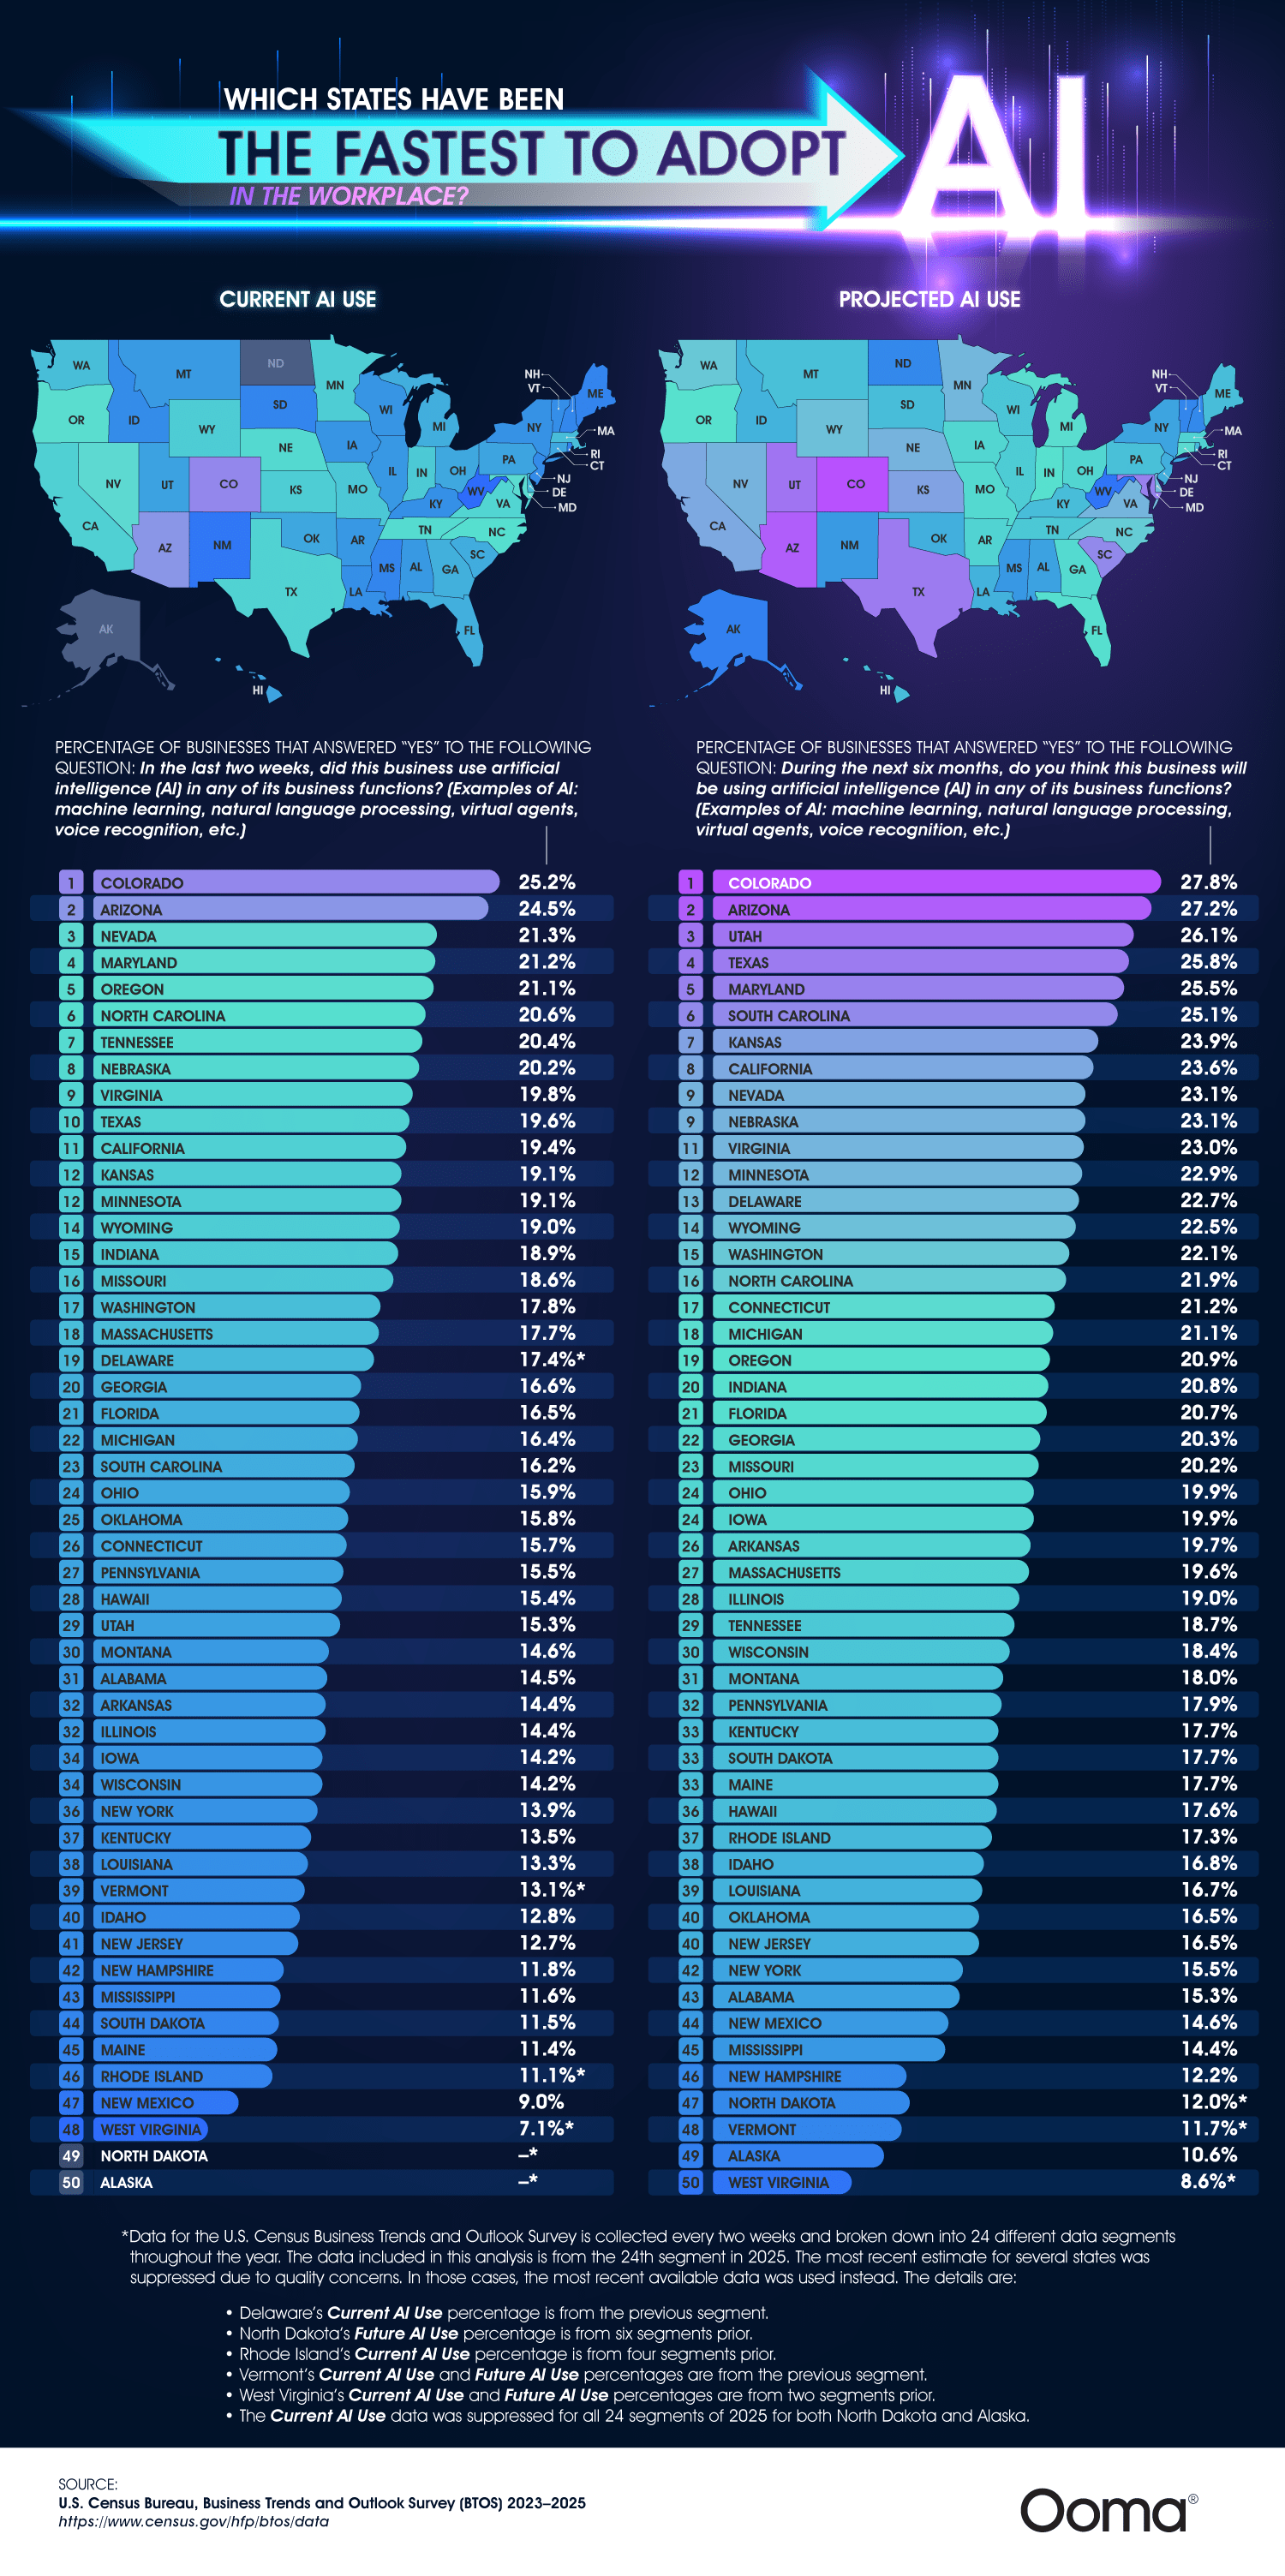
The team’s research ranks states on two key metrics: current AI adoption (whether businesses have recently used AI tools) and projected adoption (whether businesses expect to use AI in the near future). These combined elements allow us to see not only where AI is already in use, but where momentum is building. The infographic provides a visual way to compare states and identify these patterns.
One of the most striking findings is that Colorado, Arizona, and Nevada lead the way in the current AI usage. Over one-fifth of his businesses have recently adopted AI. Colorado stands out as a top state, with 25% of businesses already using AI in some capacity. These tools can include machine learning, virtual assistants, natural language processing, and other AI capabilities, supplementing everyday business tasks such as data analysis, communication, and customer service.
The map also reveals that the same states dominate in projections for future AI use. Colorado and Arizona take top rankings once again. This suggests that early adopters are more likely to keep investing in AI and remain in their leadership positions. States like Utah and Texas ranked highly in future projections, indicating these are emerging areas for AI growth.
We can see states on the opposite end of the spectrum, lagging behind the leaders. West Virginia, Alaska, and parts of the Northeast report much lower levels of current and anticipated use. Even though it’s an economically robust and influential state, New York ranks low for adoption, showing that size and economic power don’t always indicate rapid AI growth.
The team’s work suggests that differences might be influenced by factors like industry composition, workforce skills, and access to tech infrastructure. States with strong technology sectors and a growing startup economy are the most likely to adopt AI quickly, while states with more traditional economies and heavy reliance on physical labor might have slower transitions.
Remember that AI adoption is still in the early stages. Even in leading states, only one in four businesses reports using AI, so there’s still a lot of room for growth. This aligns with broader trends showing AI is expanding rapidly, but it hasn’t yet reached saturation.
The article paints a picture of a fragmented but rapidly spreading AI landscape in the U.S. While some states lead the charge, widespread adoption is still rolling out and could shake up these rankings a lot in the coming years.
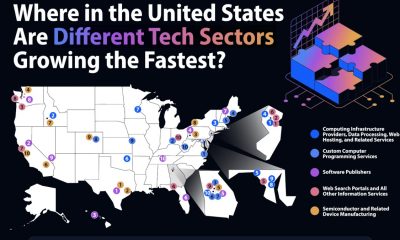
Tech is one of the world’s biggest industries, with many of the dominant Fortune 500 tech companies based in the United States. Four tech companies alone are worth trillions of dollars, and though the industry is full of rapid changes, it’s not going anywhere. The Pulse team examined locations around the country where key tech industries are booming and mapped their findings. The map shows that while Silicon Valley is the traditional home of the tech industry, there are growing tech centers around the country.
Click below to zoom.
One of the sectors spreading geographically is computing infrastructure and data services. Somerset, New Jersey, is the hub of this sector, with a significant employment increase between 2023 and 2024. Dense fiber networks and proximity to financial clients in New York City make New Jersey an ideal location for this sector. However, Ada County, Idaho, and a few counties in Maryland also support this sector.
As for custom computer programming services, the biggest hub is in Norfolk City, Virginia. There are several major software firms there, supported by the Norfolk Innovation Corridor, a “technology zone” that includes businesses, public works, hospitals, and universities. Tech startups here earn major tax incentives and other benefits. Georgia and Maine have growing centers of custom programming services too.
Software publishing is booming in the state of Texas. In Bexar, Texas, employment in this sector had doubled. San Antonio and Austin are also full of software publishing companies. Pittsburgh emerges as a hub for software publishing too, thanks to the University of Pittsburgh.
Web search portals and information services have a home in the New York City metropolitan area, particularly in Union and Essex counties. Multnomah County, Oregon, home of Portland, also has a healthy number of companies in this sector, along with many other types of creative and digital media companies.
Semiconductors are commonly manufactured in Williamson County, Texas, north of Austin. Samsung made a $17 billion investment in a semiconductor facility in Taylor, Texas, making the area a leader in the industry. NVIDIA, located in Santa Clara County, California, is another leader in this industry.
From Ohio to Maine, it’s clear that California doesn’t have the tech industry on lock. Many other cities have responded to the booming economy supported by thriving tech companies. Many cities have been totally revolutionized thanks to a major tech company opening its headquarters there. Tech businesses bring skilled workers with money to spend on many other local industries, so many communities welcome these companies with open arms.
Students and entrepreneurs can use data and maps like this to pinpoint where they may want to relocate for their job search or startup. Overall, this map offers a fascinating way to look at the state of the American tech industry by shifting our focus away from Silicon Valley and considering how tech could impact other states and cities in the future.
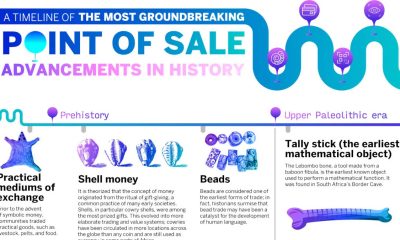
Before we used banks, barcodes, or Bitcoin, humans still developed sophisticated point-of-sale systems to exchange something of value with a stranger. We’ve reinvented solutions time and again over human history, and the team at Qualtrics created a timeline that shows us the story of this history is a lot more dramatic than your tap-to-pay transaction suggests.
Trading between humans began with the exchange of goods rather than coins or paper. Livestock, pelts, and food were the stuff of life, the most valuable items we could possess. There was no central authority to set prices and values for these things, so trades were negotiated on a case-by-case basis. The first move toward abstraction came with the exchange of goods for cowry shells and tally sticks. An interesting fact: cowry shells have been found across continents, even among civilizations that never met each other.
A major currency turning point in the ancient world was Mesopotamia’s clay tokens, used to exchange for grain and to pay off debts. Ancient Egyptians expanded on this with labor tokens that existed in a tiered system as an early form of payroll. The Code of Hammurabi, from 1750 BC, established complex rules governing credit, debt, and contracts. Economic regulation is a lot older than many people may assume.
When the Silk Road opened in 138 BC, goods, currencies, and ideas traveled thousands of miles. Muslim merchants created sakk, a document that ordered banks to pay a third party, so they didn’t have to travel with heavy coins. The sakk is the direct ancestor of a check. The Song Dynasty of China created a system of paper receipts called jiaozi, which became the world’s first paper currency.
During the Industrial Revolution, James Ritty created the mechanical cash register to help secure coins and bills from untrustworthy cashiers pocketing spare change. He called the machine, “the Incorruptible Cashier.” The Diners Club card, introduced in 1950 by American Express, became the first plastic credit card. A pack of Wrigley’s Juicy Fruit gum became the first product with a barcode scanned at the checkout in 1974.
The digital age brought about the most dramatic and rapid development. In 2009, Square turned smartphones into point-of-sale registers. This dramatically lowered barriers to entry for small businesses everywhere that could process QR codes and contactless payment methods to sell goods and services. The newest advances are in the realm of biometrics. Michigan businesses started using payments triggered by eye recognition in 2023.
From clay tokens to retinal scans, we’ve come a long way in economic innovation. These advances and technologies tell the story of humans creating solutions to the problem of developing enough trust to trade with strangers. The timeline also shows us how commerce is so tightly woven into human history and development. Some may say it’s the keystone, the foundation of human civilization. This piece is an entertaining and informative visual tale of the development of money, sales, and trade.
-

 Business Visualizations2 years ago
Everything Owned by Apple
-

 Business Visualizations1 year ago
America’s Most Valuable Companies Ranked by Profit per Employee
-

 Business Visualizations11 months ago
The Biggest Employers by Industry
-

 Timelines1 year ago
Timeline Charts the Development of Communications Technology
-

 Charts2 years ago
How Many Crayola Crayon Colors Are There? A Lot.
-

 Business Visualizations6 months ago
The Largest Companies in America That Are Still Run by the Person Who Founded Them
-

 Maps2 years ago
A Map to Gold and Silver
-
 Charts2 years ago
What it Takes for Musicians to Earn $1 with Streaming